Electrical Symbols — Semiconductor
Semiconductors are crystalline or amorphous solids with distinct electrical characteristics. They are of high resistance — higher than typical resistance materials, but still of much lower resistance than insulators. Their resistance decreases as their temperature increases, which is behavior opposite to that of a metal. Finally, their conducting properties may be altered in useful ways by the deliberate, controlled introduction of impurities into the crystal structure, which lowers its resistance but also permits the creation of semiconductor junctions between differently-doped regions of the extrinsic semiconductor crystal. The behavior of charge carriers which include electrons, ions and electron holes at these junctions is the basis of diodes, transistors and all modern electronics.

Pic. 1. Semiconductor Library
ConceptDraw DIAGRAM is a powerful software for creating professional looking electrical diagram quick and easy. For this purpose you can use the Electrical Engineering solution from the "Engineering" area of ConceptDraw Solution Park.
Electrical Engineering Solution for ConceptDraw DIAGRAM provides the stencils libraries of ready-to-use predesigned 926 vector symbols, templates and samples that make your electrical drawing quick, easy and effective.
26 libraries of the Electrical Engineering Solution of ConceptDraw DIAGRAM make your electrical diagramming simple, efficient, and effective. You can simply and quickly drop the ready-to-use objects from libraries into your document to create the electrical diagram.

Pic. 2. Electrical Engineering symbols
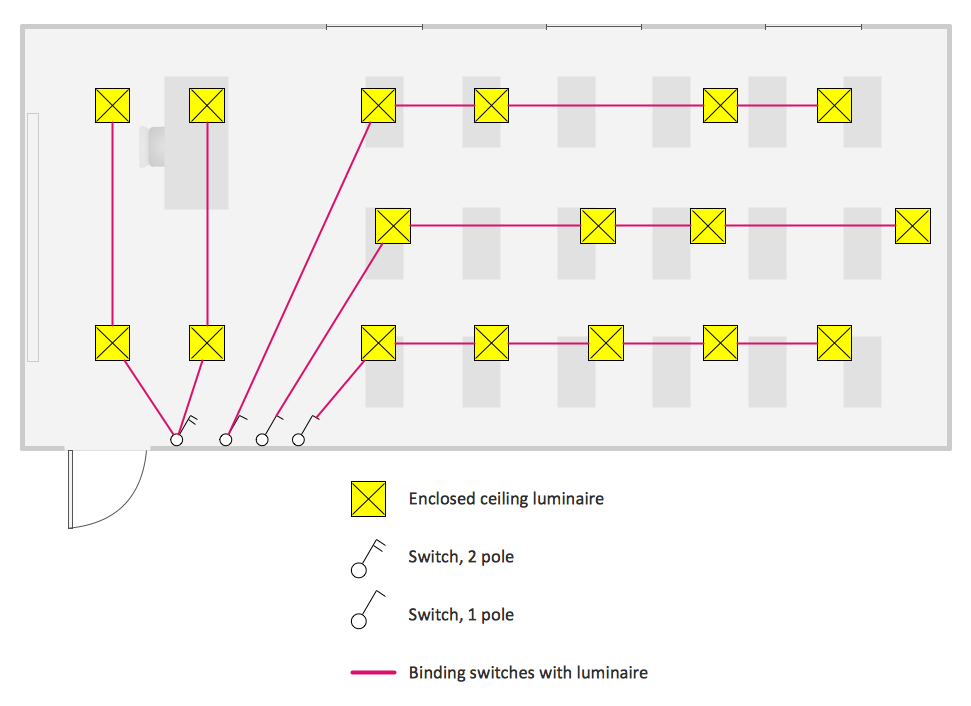
Electrical diagram software will assist you in drawing your electrical diagrams with minimal effort and makes it very easy for beginners.
Electrical symbols and smart connectors help present your electrical drawings, electrical schematic, wiring diagrams and blue prints.
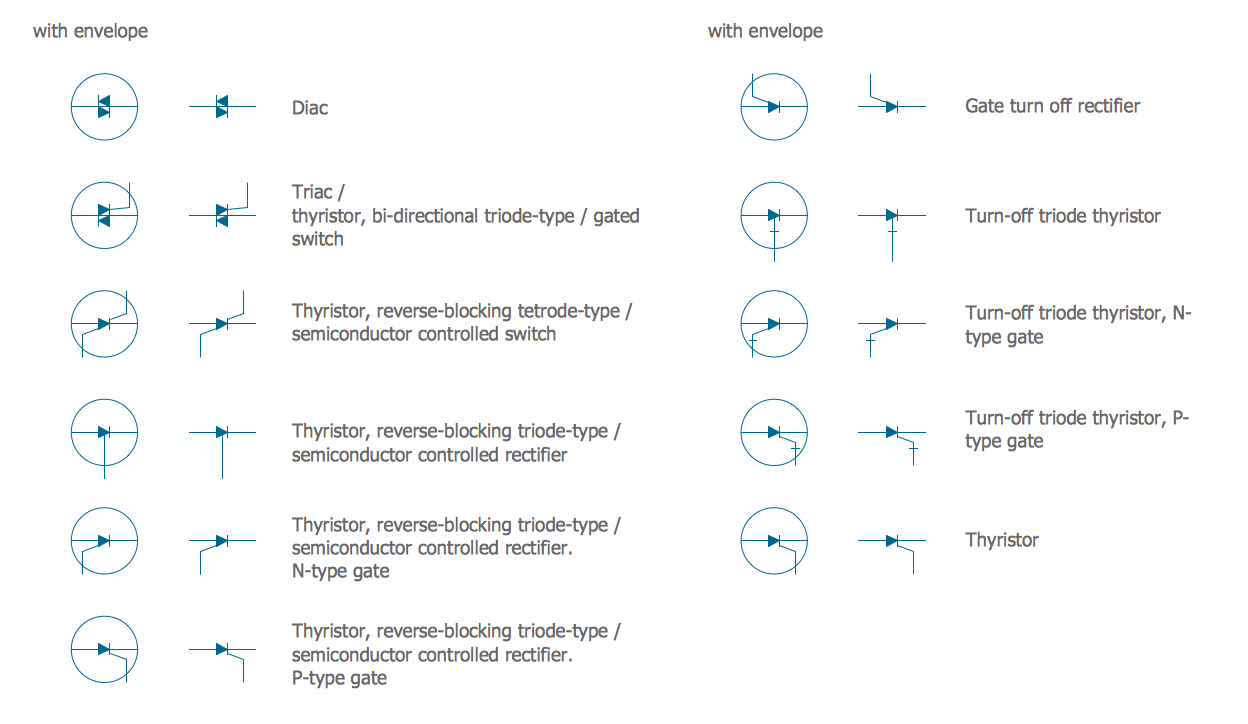
Pic. 3. Electrical Symbols — Semiconductor
Most of the electrical symbols can be changed in their appearance, styles and colors according to users' requirements. Electrical symbols are used to represent various electrical and electronic devices in a schematic diagram of an electrical or electronic circuit.
The following table lists some semiconductor electrical symbols in our electrical diagram software.
| Symbol |
Meaning |
| Electrical Symbols — Semiconductor |
 | Diac, env |
 | Diac |
 | Triac, env |
 | Triac |
 | Controlled switch, env |
 | Controlled switch |
 | Controlled rectifier, env |
 | Controlled rectifier |
 | Controlled rectifier, N, env |
 | Controlled rectifier, N |
 | Controlled rectifier, P, env |
 | Controlled rectifier, P |
 | Turn off rectifier, env |
 | Turn off rectifier |
 | Turn-off triode, env |
 | Turn-off triode |
 | Turn-off triode, N, env |
 | Turn-off triode, N |
 | Turn-off triode, P, env |
 | Turn-off triode, P |
 | Thyristor, env |
 | Thyristor |
Semiconductor devices can display a range of useful properties such as passing current more easily in one direction than the other, showing variable resistance, and sensitivity to light or heat. Because the electrical properties of a semiconductor material can be modified by doping, or by the application of electrical fields or light, devices made from semiconductors can be used for amplification, switching, and energy conversion.
How to Create an Electrical Diagram Using Semiconductor Library
TEN RELATED HOW TO's:
ConceptDraw DIAGRAM diagramming and vector drawing software extended with Security and Access Plans Solution from the Building Plans Area of ConceptDraw Solution Park is a powerful software for fast and easy drawing professional looking Physical Security Plan.
Picture: Physical Security Plan
Related Solution:
Digital electronics or digital (electronic) circuits are electronics that handle digital signals – discrete bands of analog levels – rather than by continuous ranges (as used in analogue electronics). All levels within a band of values represent the same numeric value. Because of this discretization, relatively small changes to the analog signal levels due to manufacturing tolerance, signal attenuation or parasitic noise do not leave the discrete envelope, and as a result are ignored by signal state sensing circuitry.
26 libraries of the Electrical Engineering Solution of ConceptDraw DIAGRAM make your electrical diagramming simple, efficient, and effective. You can simply and quickly drop the ready-to-use objects from libraries into your document to create the electrical diagram.
Picture: Electrical Symbols — Analog and Digital Logic
Related Solution:
When talking about engineering, one should define all the terms used, so anybody could understand the topic. Typical network glossary contains definitions of numerous network appliances, types of networks and cable systems. The understanding of basic is crucial for server management, network administration and investigating problems.
The network glossary defines terms related to networking and communications. The most of glossary items has their visual representation in ConceptDraw DIAGRAM libraries of the Computer Network Diagrams solution. This illustration presents a local area network (LAN) diagram. It designed to show the way the interaction of network devices in a local network. The diagram uses a library containing symbols of network equipment, connections and the end-point devices such as network printer, hubs, server, modem and finally computers (PC, mac, laptop). This diagram depicts a physical LAN topology.
Picture: Network Glossary Definition
Related Solution:
Energy Pyramid Diagram is a visual graphical representation of the biomass productivity on the each trophic level in a given ecosystem. Its designing in ConceptDraw DIAGRAM will not take much time thanks to the unique Pyramid Diagrams solution from the Marketing area of ConceptDraw Solution Park.
Energy Pyramid Diagram begins from the producers (plants) and proceeds through a few trophic levels of consumers (herbivores which eat these plants, the carnivores which eat these herbivores, then carnivores which eat those carnivores, and so on) to the top of the food chain.
Picture: Energy Pyramid Diagram
Related Solution:
Building plans are usually very complicated and a hard work to do. It would be nice to use a proper drawing software to facilitate the task. Design a site plan quick and easily with all the stencils and samples from ConceptDraw libraries.
This drawing shows content of the ConceptDraw vector libraries related to the site planning and arrangement of the living environment. ConceptDraw delivers about 50 libraries containing near one and a half thousands vector objects that will help you to design territory arrangement plans and make the Site plan sketches. You can use the Parking and Roads library for designing a parking space, or drawing transport management schemes. The Site Accessories library provides a number of objects, that allow you to depict various equipment of vehicle access control, street lamps, benches, trash cans and other items of the street environment.
Picture: Building Drawing Software for Design Site Plan
Related Solution:
26 libraries of the Electrical Engineering Solution of ConceptDraw DIAGRAM make your electrical diagramming simple, efficient, and effective.
Picture: Electrical Symbols — Thermo
Related Solution:
Chemical and Process Engineering solution contains variety predesigned process flow diagram elements relating to instrumentation, containers, piping and distribution necessary for chemical engineering, and can be used to map out chemical processes or easy creating various Chemical and Process Flow Diagrams in ConceptDraw DIAGRAM.
Picture: Process Flow Diagram Symbols
Related Solution:
Engineering students usually have huge amount of homework. Learning how to develop a technical drawing is one of the necessary skills. Luckily, at the present time, there’s no need to draw it on paper, because there a lot of software tools for it.
This drawing represents the Bearing symbols library, that is the part of the ConceptDraw Mechanical Engineering solution. Bearings are the important components of any movable mechanism. The function of bearing is to align, guide, and support the moving parts in any mechanical construction. Usually they are located between moving and stationary parts, it works as a connection point between them. Using Mechanical Engineering solution and ConceptDraw DIAGRAM one can effortlessly draw engineering diagrams of any complexity.
Picture: Technical Drawing Software
Related Solution:
The Internet Connectivity of the computers, mobile devices, computer networks to the Internet enables the users to access the various Internet services. There are many ways and technologies of the connection to the Internet with different data signaling rates: Wireless, Ethernet cable, Optical fiber, Dial-up, DSL, broadband Internet access, etc.
This example was created in ConceptDraw DIAGRAM using the Computer and Networks solution from the Computer and Networks area of ConceptDraw Solution Park and shows how the customers connect to ISPs and ISPs connect between the tiers (peering and transit).
Picture: Internet Connectivity. Computer and Network Examples
Related Solution:
When trying to figure out the nature of the problems occurring within a project, there are many ways to develop such understanding. One of the most common ways to document processes for further improvement is to draw a process flowchart, which depicts the activities of the process arranged in sequential order — this is business process management. ConceptDraw DIAGRAM is business process mapping software with impressive range of productivity features for business process management and classic project management. This business process management software is helpful for many purposes from different payment processes, or manufacturing processes to chemical processes. Business process mapping flowcharts helps clarify the actual workflow of different people engaged in the same process. This samples were made with ConceptDraw DIAGRAM — business process mapping software for flowcharting and used as classic visio alternative because its briefly named "visio for mac" and for windows, this sort of software named the business process management tools.
This flowchart diagram shows a process flow of project management. The diagram that is presented here depicts the project life cycle that is basic for the most of project management methods. Breaking a project into phases allows to track it in the proper manner. Through separation on phases, the total workflow of a project is divided into some foreseeable components, thus making it easier to follow the project status. A project life cycle commonly includes: initiation, definition, design, development and implementation phases. Distinguished method to show parallel and interdependent processes, as well as project life cycle relationships. A flowchart diagram is often used as visual guide to project. For instance, it used by marketing project management software for visualizing stages of marketing activities or as project management workflow tools. Created with ConceptDraw DIAGRAM — business process mapping software which is flowcharting visio alternative or shortly its visio for mac, this sort of software platform often named the business process management tools.
Picture: Process Flowchart: A Step-by-Step Comprehensive Guide
Related Solution: