Made with
ConceptDraw
DIAGRAM 18

How To Create CCTV Network Diagram

Closed-circuit television (CCTV) uses cameras and monitors to carry out video surveillance. Unlike broadcast television this system has only local signal. It is a feature of almost every video camera, yet CCTV is mainly a system for visual control of certain areas such as banks, airports, supermarkets, and other places for security reasons.

CCTV is often used to control production process, especially when people are recommended to stay away from the area (due to dangerous or unhealthy conditions). CCTV may work non-stop or during set periods of time, or watching a definite area and event. Another type of CCTV is digital video recorder (DVR). These devices vary in quality and features: motion detection, email or cell phone messaging etc. CCTV is widely used to observe public areas worldwide.

However, developing and installing CCTV system is a time-consuming process. It also requires certain knowledge and skills. ConceptDraw is a solution of setting video cameras rationally. You can achieve two aims at once: CCTV Design Tool saves your time and your money and helps you make professional video surveillance system.

  • Launch ConceptDraw DIAGRAM
  • Set a page orientation: File – Page Setup – Horizontal Orientation – Ok.

    How To Create CCTV Network Diagram

  • Floor Plan Layer.
    • Open Inspectors – Double click on the layer – Change name.

    How To Create CCTV Network Diagram

  • In the Floor Plans Solution open the libraries containing the necessary shapes:
    • Doors
    • Walls, shell and structure
    • Windows

    How To Create CCTV Network Diagram

  • Using the necessary objects, create a floor plan.

    How To Create CCTV Network Diagram

  • File – Document Properties – Page Size – Adjust to Drawing Contents – Ok.

    How To Create CCTV Network Diagram

  • Select the floor plan (Cmd +A).
  • Open Inspectors – Line tab – Change color.

    How To Create CCTV Network Diagram

  • Windows Layer.
    • Inspectors – Layers tab – Select another layer for the next part of the drawing.
    • Lock the previous layer.

    How To Create CCTV Network Diagram

  • Open the Windows library. Place the Window objects on your floor plan.

    How To Create CCTV Network Diagram

  • Select all windows (Cmd+A). Open Inspectors – Line tab – Change color.

    How To Create CCTV Network Diagram

  • Doors Layer.
    • Inspectors – Layers tab – Select another layer for the next part of the drawing.
    • Lock the previous layer.

    How To Create CCTV Network Diagram

  • Open the Doors library. Place the Door objects on your floor plan.

    How To Create CCTV Network Diagram

  • Use Action Menu of the object for easier work.

    How To Create CCTV Network Diagram

  • Select all the Door objects – Change color using Inspectors – Line tab.

    How To Create CCTV Network Diagram

  • Rooms Layer.
    • Inspectors – Layers tab – Add a New Layer using plus icon (+).
    • Lock the previous layer.

    How To Create CCTV Network Diagram

  • Double click on the white space of the page – enter room name – move the Text box to the needed part of the floor plan.

    How To Create CCTV Network Diagram

  • To edit text, select it and open the Text tab in Inspectors.

    How To Create CCTV Network Diagram

  • Cameras Layer.
    • Inspectors – Layers tab –Add a New Layer using plus icon (+).
    • Lock the previous layer.

    How To Create CCTV Network Diagram

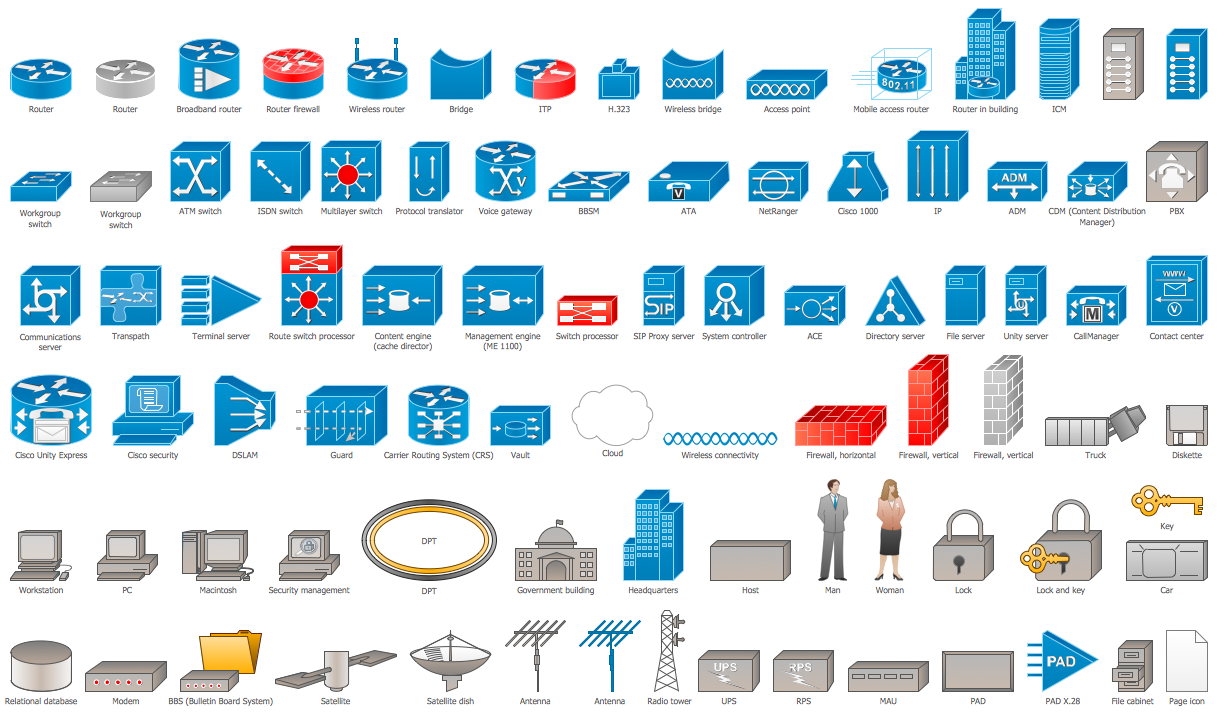
  • In the Security and Access Plans Solution open the Video Surveillance library.

    How To Create CCTV Network Diagram

  • Take the Camera object – Place it on the floor plan.
  • Use Rotation dot to rotate the object. Use Control dots to resize it.

    How To Create CCTV Network Diagram

  • Open Color menu from the Toolbar – Shape Color – Change color.

    How To Create CCTV Network Diagram

  • Holding down the Option key (ALT), copy the object. Place it on the diagram.

    How To Create CCTV Network Diagram

  • Take Camera P/T/Z object from the library. Place it on the floor plan.
  • Use Rotation dot to rotate the object. Use Control dots to resize it.

    How To Create CCTV Network Diagram

  • Open Color menu from the Toolbar – Shape Color – Change the color.
  • Holding down the Option key (ALT), copy the object. Place it on the diagram.

    How To Create CCTV Network Diagram

  • File – Document Properties – Page Size – Adjust to Drawing Contents – Ok.

    How To Create CCTV Network Diagram

  • Use needed objects from the library, place them on the floor plan.

    How To Create CCTV Network Diagram

  • Select the objects, holding down the Shift key, click successively on the needed objects.
  • Open Inspectors – Line tab – Change color

    How To Create CCTV Network Diagram

  • Using Direct and Smart Connectors from the Toolbar connect Camera objects.
  • Open the Line tab in Inspectors. Set End points, select color.
How To Create CCTV Network Diagram *
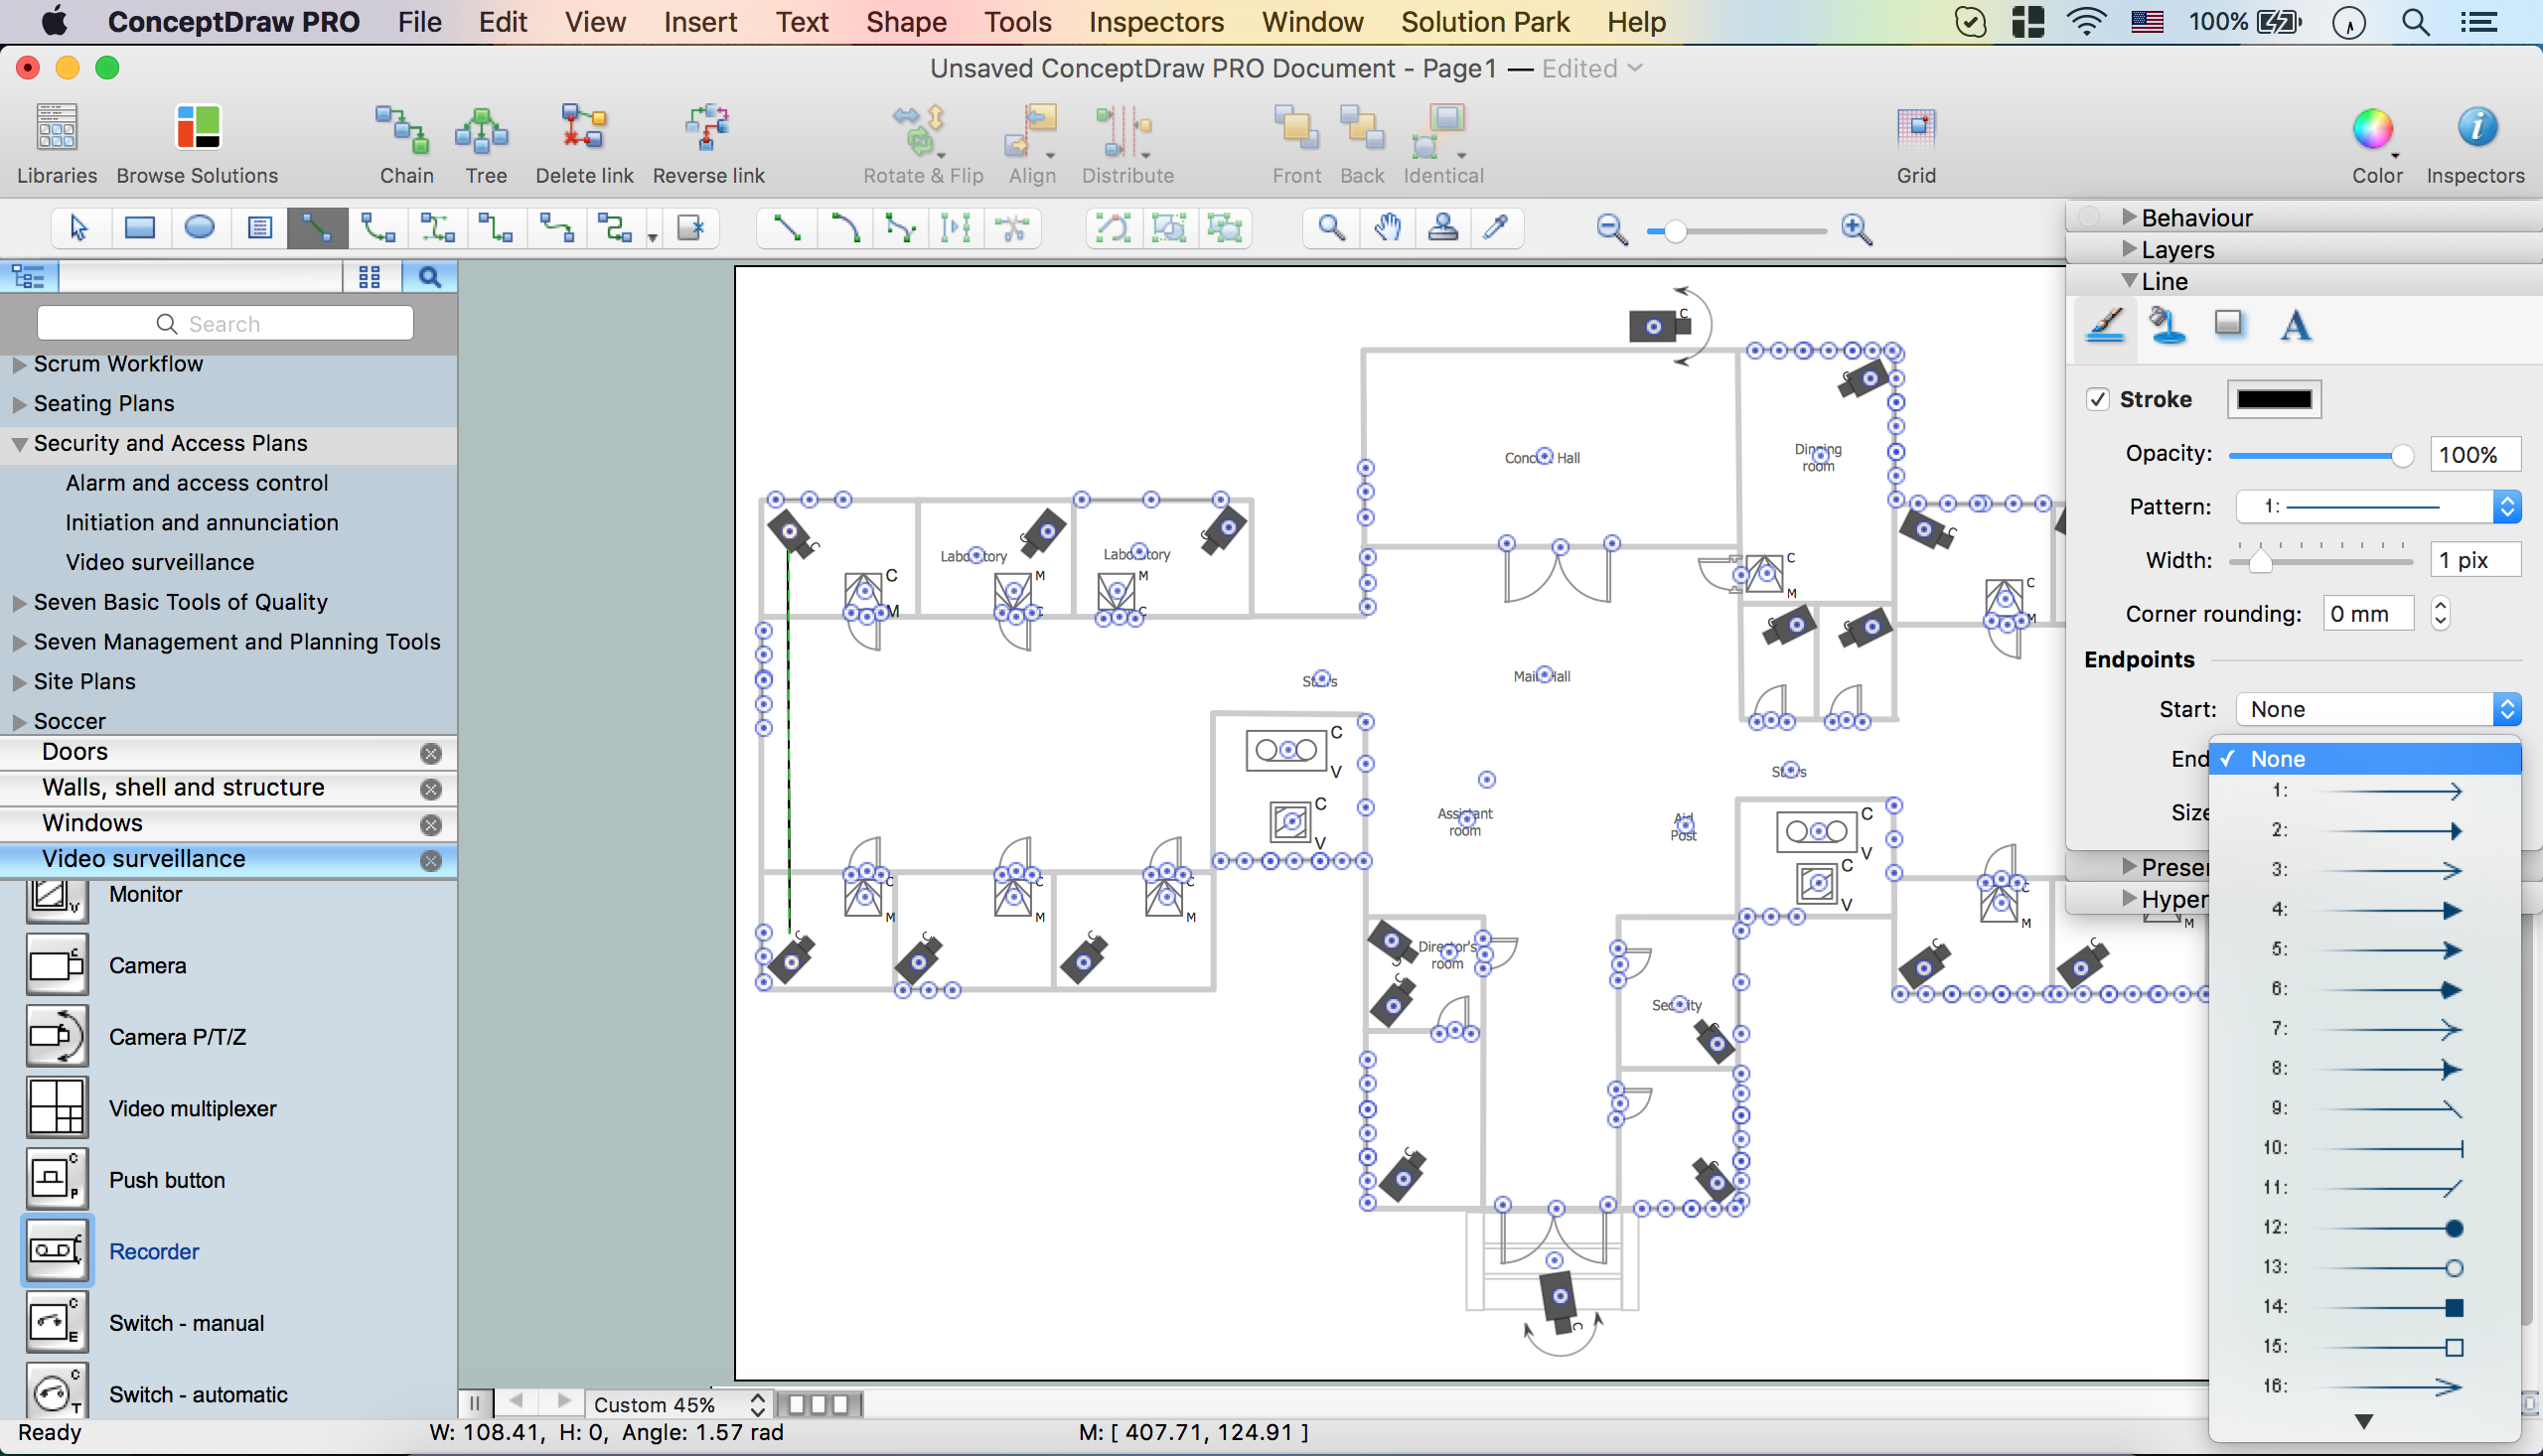
  • Using yellow dots on Smart Connector you can move it.

    How To Create CCTV Network Diagram

  • Now your Drawing is ready.
  • You may save it or export to different formats via the File menu.

    How To Create CCTV Network Diagram

The possibility of exporting to variety of popular graphical formats (PNG, JPEG, JPG, GIF, TIF, TIFF, BMP, DIB, EMF, SVG) and file formats, such as Microsoft PowerPoint (PPT), Adobe Acrobat (PDF), Microsoft Visio (VDX, VSDX), Adobe Flash (SWF), Encapsulated PostScript (EPS), HTML, opens wide opportunities for you.


Video. How To Create CCTV Network Diagram (02 min 42 sec)


TEN RELATED HOW TO's:
Meeting ice hockey rules one should learn ice hockey rink terms, lines, zones etc. ConceptDraw DIAGRAM is an advanced drawing software that allows you produce ice hockey rink depiction of any complexity, from simple sketch drawing to detailed one as on example below.Ice Hockey Rink Dimensions *
Picture: Ice Hockey Rink Dimensions
Related Solution:
ConceptDraw will help you to create the room planning of any configuration quickly and skillfully. ConceptDraw contains a number of ready templates for creation of premises plans, and due to libraries with interior objects existing in the program you will be able to place furniture, denote the location of doors and windows and indicate dimensions.Room planning
Picture: Room planning with ConceptDraw DIAGRAM
Related Solution:
Unfortunately, a man can’t predict the future and no one is safe from natural disasters, such as floods, earthquakes, hurricanes or fires. Nonetheless, what you can do to ensure safety for you and your relatives is to create an emergency plan, so everyone will know what to do if emergency happens. Keep that plan simple and train it several times a year so that no one could forget any details of it. Fire and emergency plans are important to supply people with a visual safety solution. This diagram presents a set of standard symbols used to depict fire safety, emergency, and associated information. Using clear and standard symbols on fire emergency plans provides the coherence of collective actions , helps to avoid embarrassment, and improves communications in an emergent situation. The fire emergency symbols are intended for the general emergency and fire service, as well as for building plans ,engineering drawings and insurance diagrams. They can be used during fire extinguishing and evacuation operations, as well as trainings. It includes vector symbols for emergency management mapping, emergency evacuation diagrams and plans.Emergency Plan
Picture: Emergency Plan
Related Solution:
Easy charting software comes with beautiful chart templates and examples. This makes it easy to create professional charts without prior experience.Chart Maker for Presentations
Picture: Chart Maker for Presentations
Related Solution:
Nova Scotia is one of Canada's three Maritime provinces and constitutes one of the four Atlantic Canada provinces. The vector stencils library Nova Scotia contains contours for ConceptDraw DIAGRAM diagramming and vector drawing software. This library is contained in the Continent Maps solution from Maps area of ConceptDraw Solution Park.Geo Map - Canada - Nova Scotia *
Picture: Geo Map - Canada - Nova Scotia
Related Solution:
ConceptDraw DIAGRAM is a powerful diagramming and vector drawing software. Extended with Chemical and Process Engineering Solution from the Industrial Engineering Area of ConceptDraw Solution Park, it became the best Chemical Engineering software.Chemical Engineering *
Picture: Chemical Engineering
Related Solution:
The ConceptDraw DIAGRAM is a good flow chart app for Mac. Numerous vector stencils, samples and templates created by designers allows you to draw any type of flowchart.Good Flow Chart app for Mac *
Picture: Good Flow Chart app for Mac
Related Solution:
ConceptDraw DIAGRAM software extended with Fishbone Diagrams solution from the Management area of ConceptDraw Solution Park is perfect for Cause and Effect Diagram creating. It gives the ability to draw fishbone diagram that identifies many possible causes for an effect or a problem. Causes and Effects are usually grouped into major categories to identify these sources of variation. Causes and Effects in the diagram show relationships among various factor. Fishbone diagram shows factors of Equipment, Process, People, Materials, Environment and Management, all affecting the overall problem.Cause and Effect Diagram *
Picture: Cause and Effect Diagram
Related Solution:
In the course of recent decades data visualization went through significant development and has become an indispensable tool of journalism, business intelligence and science. The way visual information may be conveyed is not limited simply to static or dynamic representation, it can also be interactive. Infographics can be conditionally divided into several general levels. Primarily, this is level of visualization of information, its interpretation and association on any ground. Second level can be defined as a visualization of knowledge, depiction of thoughts and ideas in the form of images or diagrams. Finally, the level of data visualization, which processes data arrays in charts, enabling the information to be more clearly perceived. You can also identify the main approaches to the creation of infographics: exploratory and narrative. Exploratory method insists on minimalist design in favor of data precision without unnecessary details and is common for scientific researches and anaDesign Pictorial Infographics. <br> Design Infographics *
Picture: Design Pictorial Infographics. Design Infographics
Related Solution:
Computer networks nowadays are spread all across the world. The large number of parameters, such as geographic scale or communication protocols, can divide networks. One of the most common types of networks is called local area network (LAN). It convenient to represent network examples by means of diagrams. This local area network (LAN) diagram provides an easy way to see the way the devices in a local network are interacted. The diagram uses a library containing specific symbols to represent network equipment , media and the end-user devices such as computers (PC, mac, laptop) , network printer, hubs, server and finally a modem. There are two types of network topologies: physical and logical. The current diagram represents precisely a physical type of LAN topology because it refers to the physical layout of a local network equipment.Local area network (LAN) diagram
Picture:
What is a Local Area Network?
Examples of LAN Diagrams
Related Solution:
ConceptDraw
DIAGRAM 18