Made with
ConceptDraw
DIAGRAM 18

Electrical Diagram Software

ConceptDraw DIAGRAM is a powerful software for creating professional looking electrical diagram quick and easy. For this purpose you can use the Electrical Engineering solution from the "Engineering" area of ConceptDraw Solution Park.

Electrical Engineering Solution for ConceptDraw DIAGRAM provides the stencils libraries of ready-to-use predesigned 926 vector symbols, templates and samples that make your electrical drawing quick, easy and effective.

26 libraries of the Electrical Engineering Solution of ConceptDraw DIAGRAM make your electrical diagramming simple, efficient, and effective. You can simply and quickly drop the ready-to-use objects from libraries into your document to create the electrical diagram.

Electrical Engineering libraries

Pic. 1. Electrical Engineering libraries

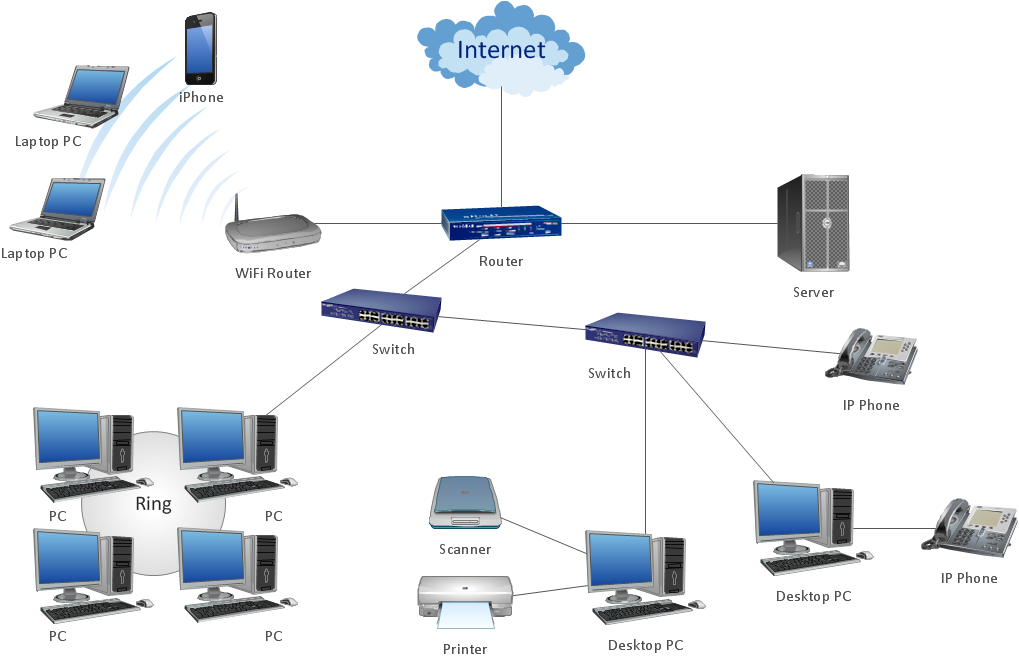
Electrical Diagram Software will assist you in drawing your electrical diagrams with minimal effort and makes it very easy for beginners. Electrical symbols and smart connectors help present your electrical drawings, electrical schematic, wiring diagrams and blue prints.

Create an Electrical Diagram
  • Launch ConceptDraw DIAGRAM
  • Set a page orientation: File menu – Page Setup – Horizontal Orientation – Ok.
  • From the Electrical Engineering Solution open the libraries containing the necessary shapes:
    • Electrical circuits
    • Lamps, acoustics, readouts
    • Resistors
    • Transistors

    Create an Electrical Diagram

  • From Lamps, acoustics, readouts library take out Galvanometer object. Place it on the page.
  • Zoom in the page to resize object using control dots.

    Create an Electrical Diagram

  • Holding down Option button (ALT) copy the object. Place it on the page.

    Create an Electrical Diagram

  • From Transistors library take out BJT, NPN, env object. Place it on the page.

    Create an Electrical Diagram

  • Select all objects. Shape menu – Make Same – Size.

    Create an Electrical Diagram

  • Holding down Option button (ALT) copy BJT, NPN, env object. Place it on the page.

    Create an Electrical Diagram

  • Select the BJT, NPN, env object – Shape menu – Rotate & Flip – Flip Horizontal.

    Create an Electrical Diagram

  • Select all objects. Use Align option from the Toolbar – Align Middle.

    Create an Electrical Diagram

  • Select all objects. Use Align option from the Toolbar – Align Middle.

    Create an Electrical Diagram

  • Open Inspectors – Fill tab – Change color.

    Create an Electrical Diagram

  • From Resistors library take out Resistor object. Place it on the page.
  • Using Control dots adjust size. Rotate & Flip option from the Toolbar – Rotate left.

    Create an Electrical Diagram

  • Holding down Option button (ALT) copy the object. Place it on the page.
  • From Electrical circuits library take out Ground object. Place it on the page.
  • Make needed size using Control dots.
  • Holding down Option button (ALT) copy the object. Place them on the page.
  • Align Center Galvanometer and Resistors objects using Align option from the Toolbar.

    Create an Electrical Diagram

  • Select Direct Connector on the Toolbar. Use it to connect BJT, NPN, env objects.
  • Open Inspectors – Line tab – Set Endpoints.

    Create an Electrical Diagram

  • Use Direct and Smart connectors from the Toolbar to connect all objects on the page.
  • Using Yellow diamonds you may arrange Smart Connectors.

    Create an Electrical Diagram

  • From Electrical circuits library take out Junction object. Place it on the scheme.
  • Adjust size using Control dots.
  • Holding down Option button (ALT) copy the object. Place them on the scheme.

    Create an Electrical Diagram

  • Change color via Inspectors – Fill tab.

    Create an Electrical Diagram

  • Double click on the page – Add text - select it – open Inspectors – Text tab.
  • Set Font and Font size. Make color same as Galvanometer objectusing Eyedropper.

    Create an Electrical Diagram

  • Select needed part of the text and make it Subscript.

    Create an Electrical Diagram

  • Add text to all needed objects. Select all Text boxes - Shape Menu – Fit to text.

    Create an Electrical Diagram

  • File Menu – Document Properties – Page Size – Adjust to Drawing Contents – Ok.

    Create an Electrical Diagram

  • Inspectors – Layers tab - Select another layer for Background. Lock previous layer.

    Create an Electrical Diagram

  • Open Drawing Shapes library from Libraries panel. Take Rectangle object. Place it on the page.
  • Using Control dots make size same as Page size.

    Create an Electrical Diagram

  • Send it to Back using the option from the Toolbar.
  • Open Inspectors –Line tab – Deselect Stroke.
  • Fill tab – Change color of the object.

    Create an Electrical Diagram

  • Inspectors - Layers tab – Go back to Layer 1 - Lock Background layer.

    Create an Electrical Diagram

  • Select all excluded text boxes. Inspectors – Line tab – Change color.

    Create an Electrical Diagram

  • Now your Drawing is ready.

    Create an Electrical Diagram

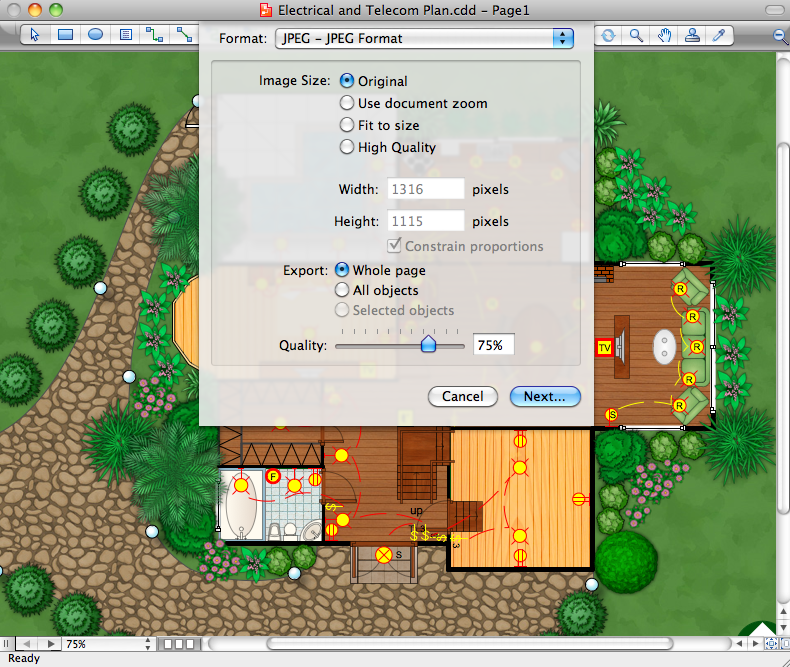
  • You may save it or export to different formats via File Menu.
Electrical Diagram Software *

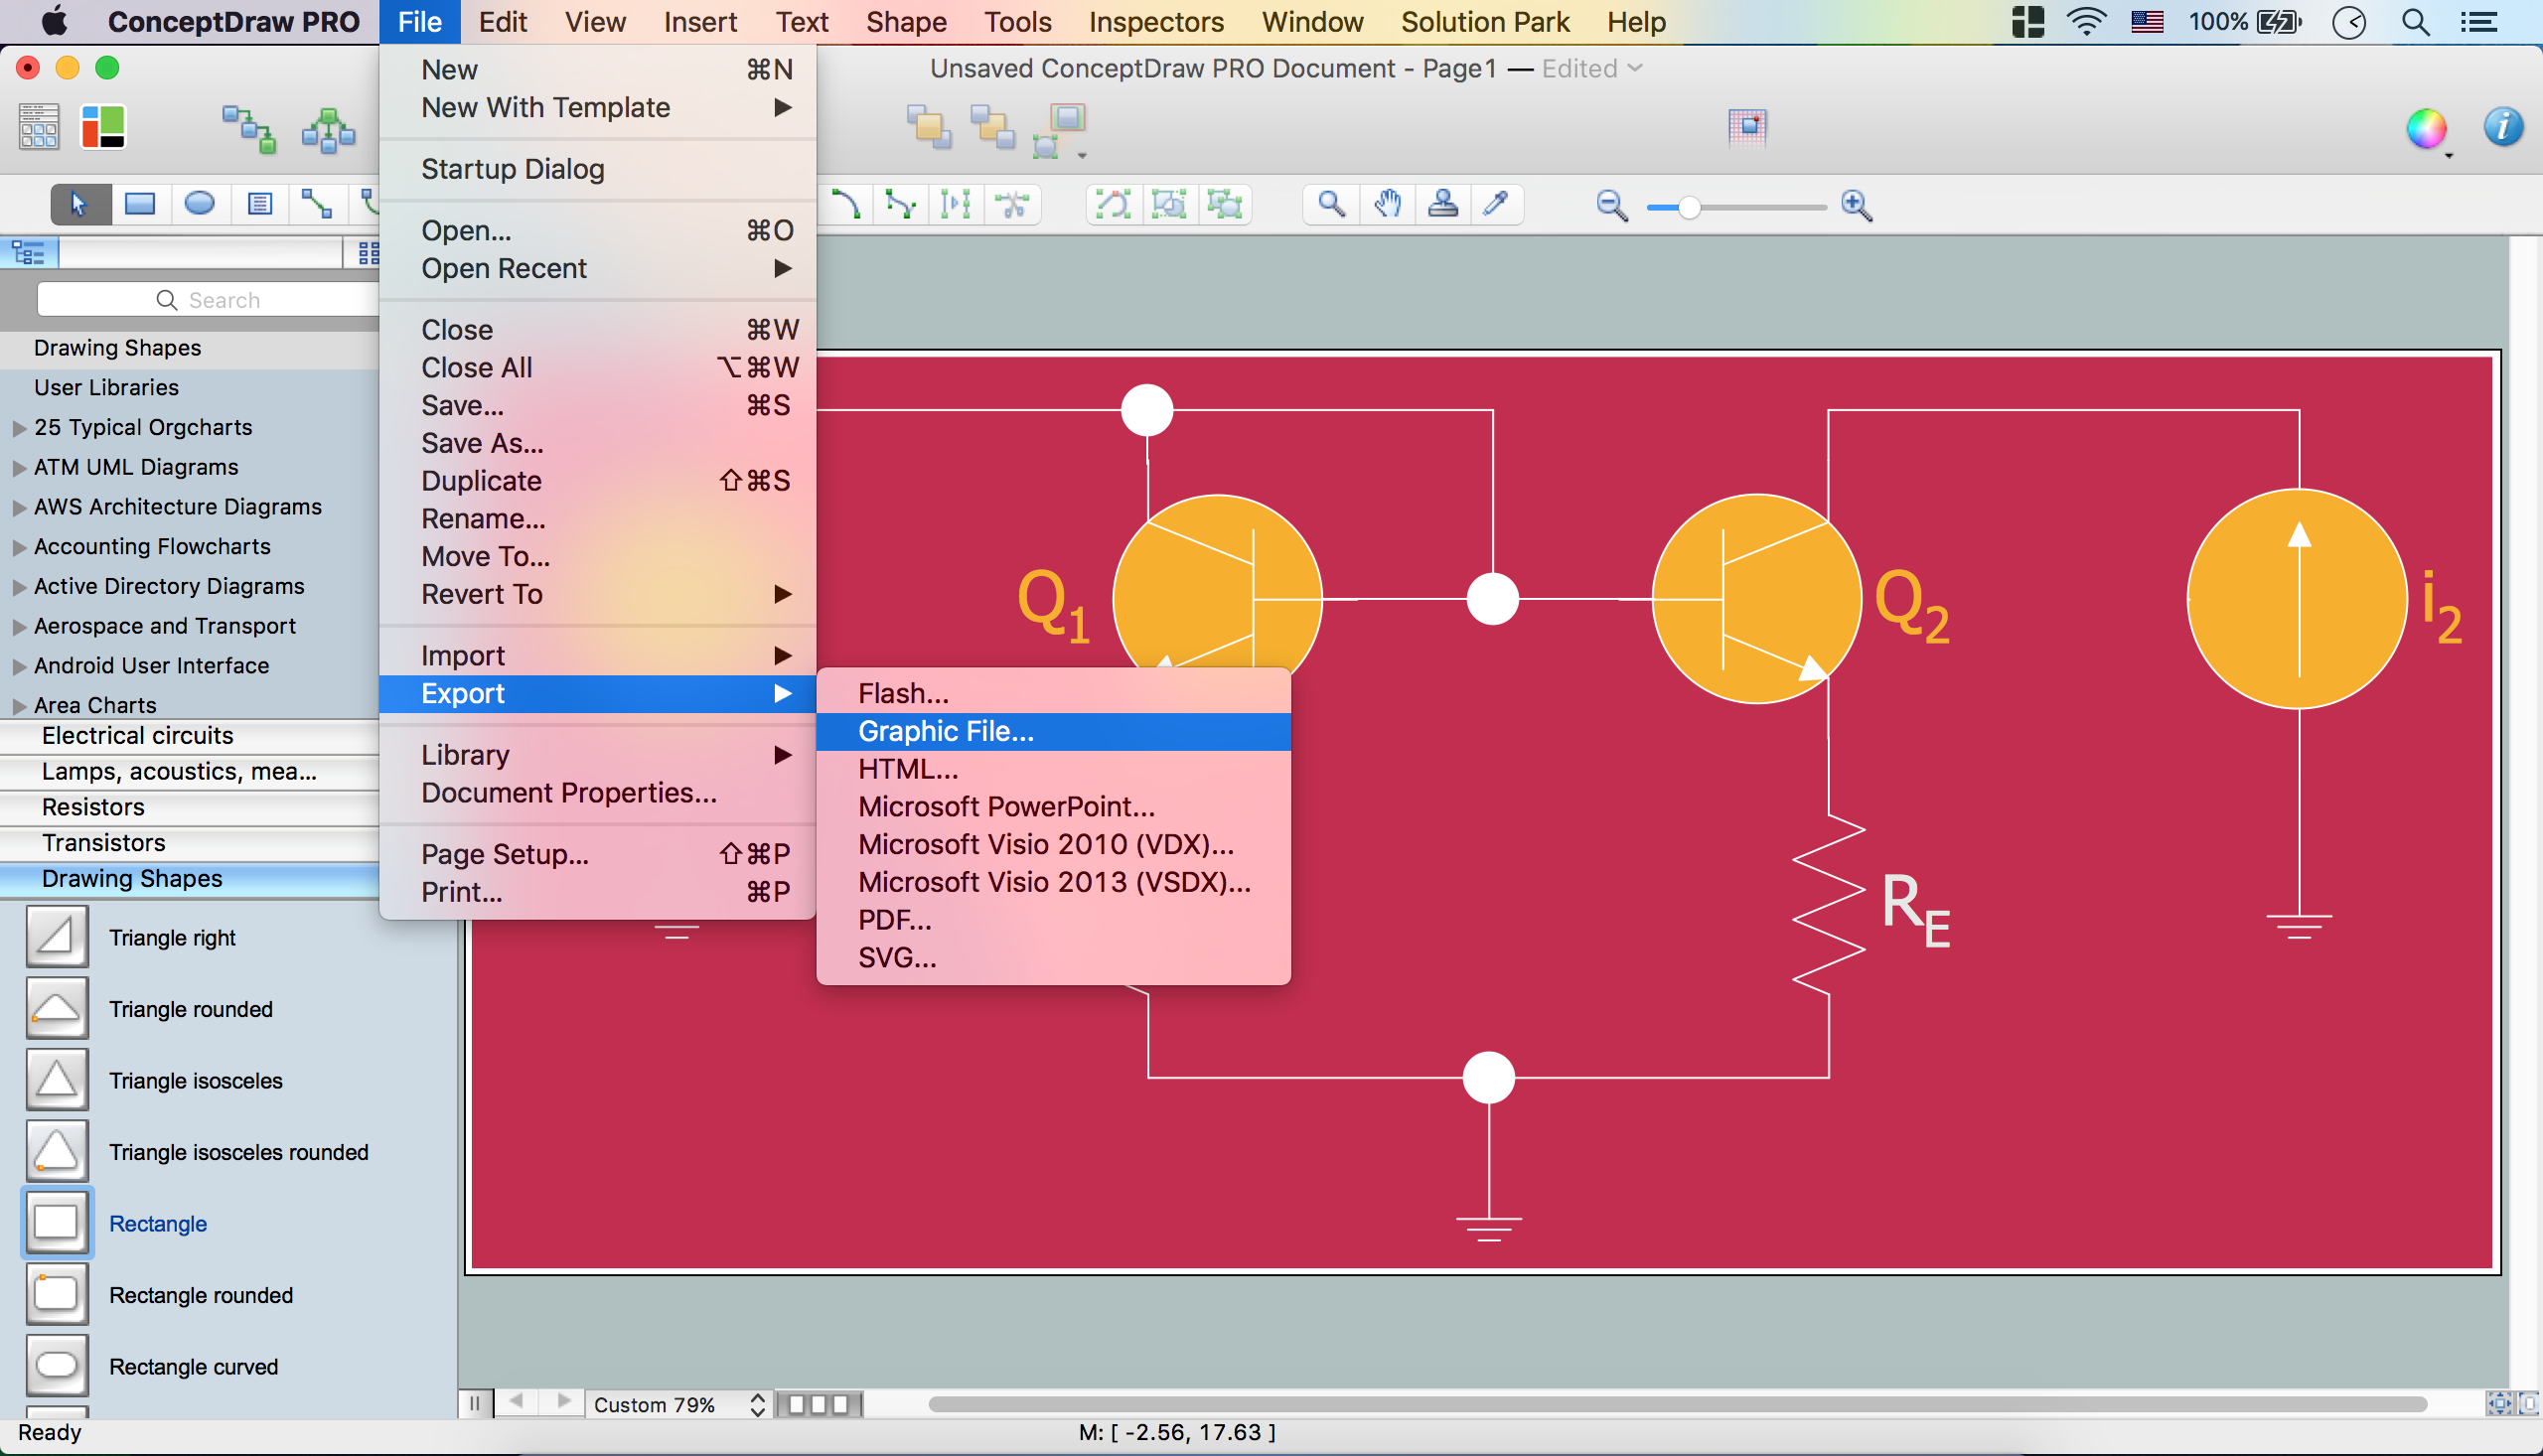
This example is a vector graphic document. It is available for reviewing, modifying, or converting to a variety of formats (PDF file, MS PowerPoint, MS Visio, and many other graphic formats) from the ConceptDraw Solution Park. The Electrical Engineering Solution is available for all ConceptDraw DIAGRAM users.


TEN RELATED HOW TO's:
A model of a system is defined as a set of hierarchical diagrams representing the asynchronous process of data transformation from the moment it is input to the system to the moment it is output to the user. To demonstrate how a process transforms the initial data, you should design a data flow diagram using a DFD Library included in ConceptDraw DIAGRAM Solution Park. Start your diagramming experience now! You can use this library of symbols related to data flow diagrams (DFD) to design data-oriented or process-oriented models along with data process diagrams. This vector objects library It is a part of ConceptDraw solution designed for data flow diagramming, along with corresponding samples and templates. A data flow diagram is a 2D flowchart that depicts the sequence of particular activities and operations operations and activities which is accompanied by the dynamic flow of some data.Design Data Flow. DFD Library *
Picture: Design Data Flow. DFD Library
Related Solution:
ConceptDraw DIAGRAM is a flowchart creating software. This software includes over 20 vector stencils in libraries. These objects allow you to create well-designed flowcharts. Put an initial object from library to a page and use RapidDraw technology clicking on direction arrows to add new objects to the flowchart. This way you can make flowchart quickly.How To Create a Flow Chart in ConceptDraw *
Picture: How To Create a Flow Chart in ConceptDraw
Related Solution:
Data storage is a fundamental aspect of the cloud platform. Microsoft offers scalable, durable and elastic cloud Azure Storage which can be available from any type of application whether it’s running in the cloud and anywhere in the world. ConceptDraw DIAGRAM diagramming and vector drawing software extended with Azure Architecture Solution from the Computer and Networks area of ConceptDraw Solution Park provides a lot of useful tools which give you the possibility effectively illustrate Microsoft Azure cloud system, Azure services, Azure storage and its components.Azure Storage *
Picture: Azure Storage
Related Solution:
No science can't exist without illustrations, and especially astronomy! Illustrations help to visualize knowledge, natural phenomenons which are studied by astronomy, they equally effective help in work, during the learning process and on the conferences. Now we have professional astronomy illustration software - ConceptDraw DIAGRAM illustration and sketching software with templates, samples and libraries of a variety of astronomy symbols, including constellations, galaxies, stars, and planet vector shapes; a whole host of celestial bodies. When drawing scientific and educational astronomy illustrations, astronomy pictures and diagrams, can help you reach for the stars!Illustration Software *
Picture: Illustration Software
Related Solution:
Sometimes it's difficult to find a path in work processes or to understand the requirements, especially when you are a newcomer. To get your thoughts straight, create a workflow diagram, and put everything on it. This will not only help you to get into the workflow, but also show it’s weaknesses. This illustration captures the workflow process of payment an invoice for the electricity consumed by certain enterprise. It was drawn in ConceptDraw DIAGRAM using its solution for Workflow Diagrams. Making a workflow charts means that you need to depict consistently all processes engaged to the workflow process. Then, you should connect them with symbols meaning study and analysis. Next, add symbols of decisions. A work flow diagram made precisely and correctly can help to clarify your work flow to any person.Workflow Diagram *
Picture: Workflow Diagram
Related Solution:
The excellent possibility to create attractive Cross Functional Flowcharts for step-by-step visualization the operations of a business process flow of any degree of detailing is offered by ConceptDraw’s Cross-Functional Flowcharts solution. The extensive selection of commonly used vector cross functional flowchart symbols allow you to demonstrate the document flow in organization, to represent each team member’s responsibilities and how processes get shared or transferred between different teams and departments.Cross Functional Flowchart Symbols *
Picture: Cross Functional Flowchart Symbols
Related Solution:
Drawing the network diagrams is a complex process which requires a lot of efforts, time and artistic abilities. ConceptDraw DIAGRAM offers the Network Layout Floor Plans Solution from the Computer and Networks Area with variety of predesigned network components for drawing network layout floor plans in minutes.Network Components *
Picture: Network Components
Related Solution:
Video tutorials on ConceptDraw products. Try it today!How to Draw a Bubble Chart *
Picture: How to Draw a Bubble Chart
Related Solution:
A Home Area Networks (HAN) is a type of local area network that is used in an individual home. The home computers can be connected together by twisted pair or by a wireless network. HAN facilitates the communication and interoperability among digital devices at the home, allows to easier access to the entertainments and increase the productivity, organize the home security. This example was created in ConceptDraw DIAGRAM using the Computer and Networks Area of ConceptDraw Solution Park and shows the home network diagram.Home area networks (HAN). <br>Computer and Network Examples *
Picture: Home area networks (HAN). Computer and Network Examples
Related Solution:
A qualifying symbol is graphics or text added to the basic outline of a device’s logic symbol to describe the physical or logical characteristics of the device. 26 libraries of the Electrical Engineering Solution of ConceptDraw DIAGRAM make your electrical diagramming simple, efficient, and effective. You can simply and quickly drop the ready-to-use objects from libraries into your document to create the electrical diagram.Electrical Symbols — Qualifying *
Picture: Electrical Symbols — Qualifying
Related Solution:
ConceptDraw
DIAGRAM 18