Comparing ConceptDraw DIAGRAM to Omnigraffle
Benefits of ConceptDraw DIAGRAM versus Omnigraffle:
- Cross platform product. While most drawing tools are designed for use on one operating system, ConceptDraw DIAGRAM is available as two independent and concurrent versions on both Macintosh (macOS) and PC (Windows).
- License is per named user. That means you can use a single license for Macintosh and PC. Users can install at work and at home with a single license.
- Free access to the ConceptDraw Solution Park. With hundreds of templates, and many more on the way, the ConceptDraw Solution Park has the solution for you. Read more
- Integration with ConceptDraw Office and Microsoft Office applications. ConceptDraw products feature Ingyre Technology, allowing limitless exchange within the ConceptDraw suite. ConceptDraw also imports and exports Microsoft Office files effortlessly.
- Presentation capability. ConceptDraw DIAGRAM can create lush, beautiful presentation slideshows from your documents with just the push of a button.
- Live Objects Technology allows for the creation of visual dynamically-updated dashboards. The result is a vector graphic document that can automatically update when your data does.
Live objects are special graphic objects which can read data from a user-defined external source and change appearance accordingly. You can connect any data to your dashboard. Read more
- Rapid Draw Technology allows for the creation of diagrams in minutes. To see how Rapid Draw Technology works, check how to make business process diagrams.
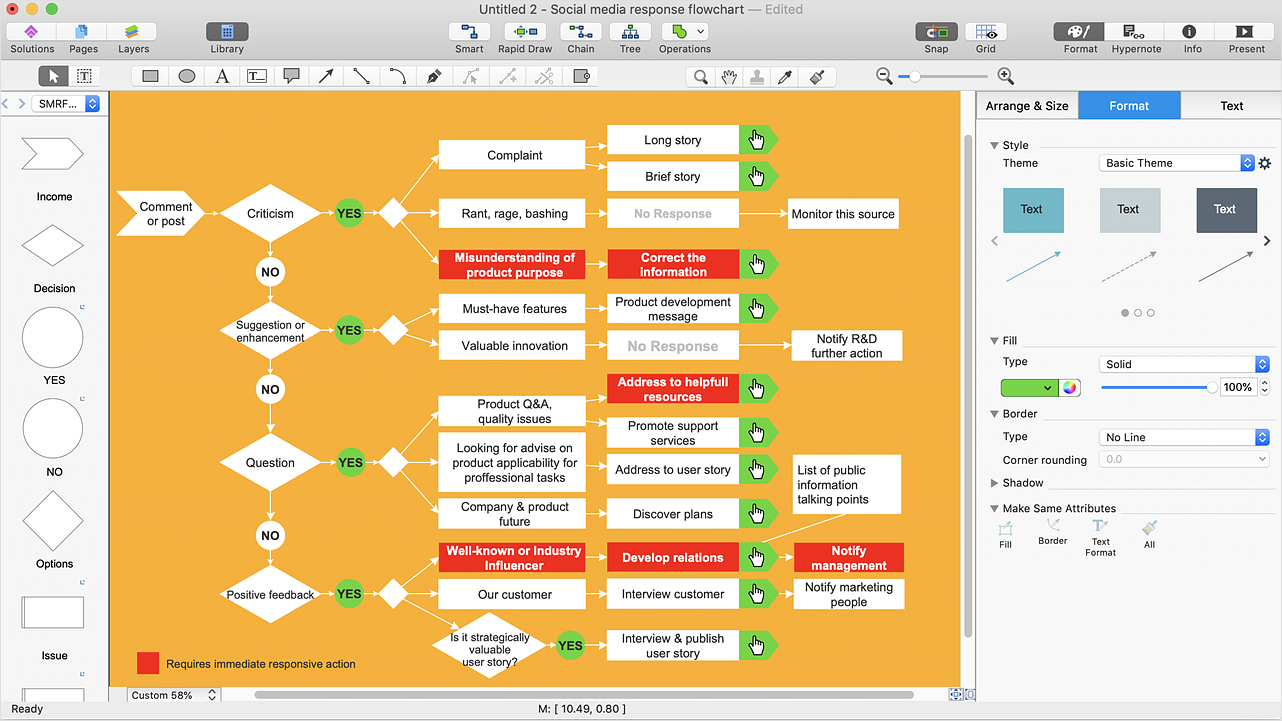
Pic. 1. Comparing ConceptDraw DIAGRAM to Omnigraffle — Online Store Social Media Response Flowchart
See also Samples:
- Orgcharts
- Flowcharts
- Business Process Diagrams
- Flow Charts
- Charts & Diagrams
- Flowcharts & Process Diagrams
- Strategy & Management Diagrams
- Marketing — Social Media
- UML Diagrams
- Floor Plan & Landscape Design
- Computer and networks — AWS architecture
- Dashboards and KPI`s
- Engineering Diagrams
- Finance and Accounting
- Illustration - Manufacturing
- Infographics - Spatial
TEN RELATED HOW TO's:
Architectural drawing allows to show the location of a building or ensemble of buildings on the ground, indicating the cardinal points. For centuries, people had been studying architecture in universities to learn how to draw building plans and now everyone can do it easily just using appropriate software. While developing the building plan, its graphic part, you can display the part of the floor or the entire floor of a building with an indication of the exact location of the drawn premise.
Small-sized apartments does not restrict the advanced interior design opportunities. Here is a detailed and precise floor plan of a pretty small apartment. A furniture objects are added to show possible interior of this home. This plan can be used to help somebody with a floor layout and furniture arrangement. Having this floor plan in a pocket while shopping would be useful to check if there is enough rooms for a new furniture.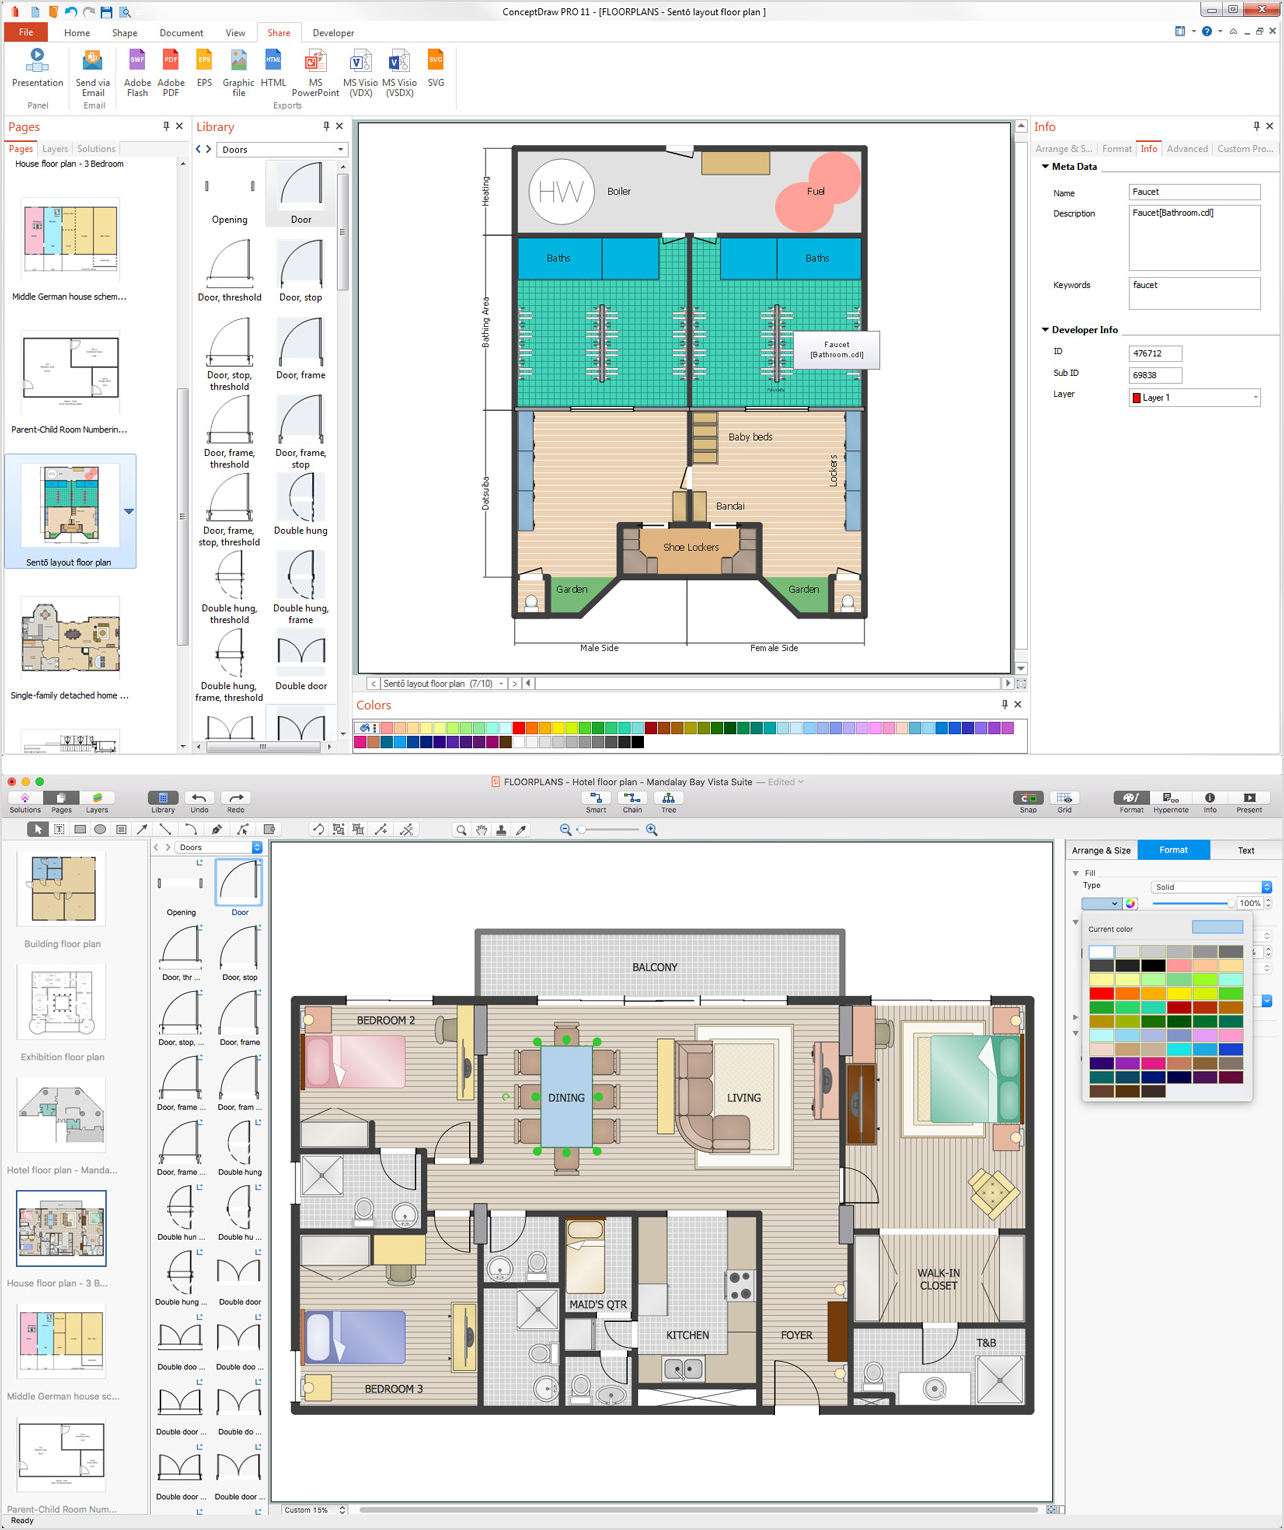
Picture: How To Draw Building Plans
Related Solution:
Describing a workflow or approval process can take hours and be too complicated, especially since there are options to do it quickly and vividly. Diagrams called flowcharts replace long paragraphs of boring text and represent information in a graphic way. You can draw one on paper or you can use flowchart software to do it quickly and scalable. This kind of software is easy to use and you don’t need any special skills to start using it. In addition, there are a lot examples and predesigned templates on the Internet.
Flowcharts are a best tool for staking out a huge and complex process into some small readable parts. Surely, flowcharts can be drawn manually but the use of standard symbols that make it clear for a wide audience makes a software tool preferred for this task. The core for a successful flowchart is its simplicity. That is why often before beginning making flowchart through software, people draw the sketch on a piece of paper. Designing an effective flowchart means the combination of the data needed to be shown and the simplicity with which you depict it.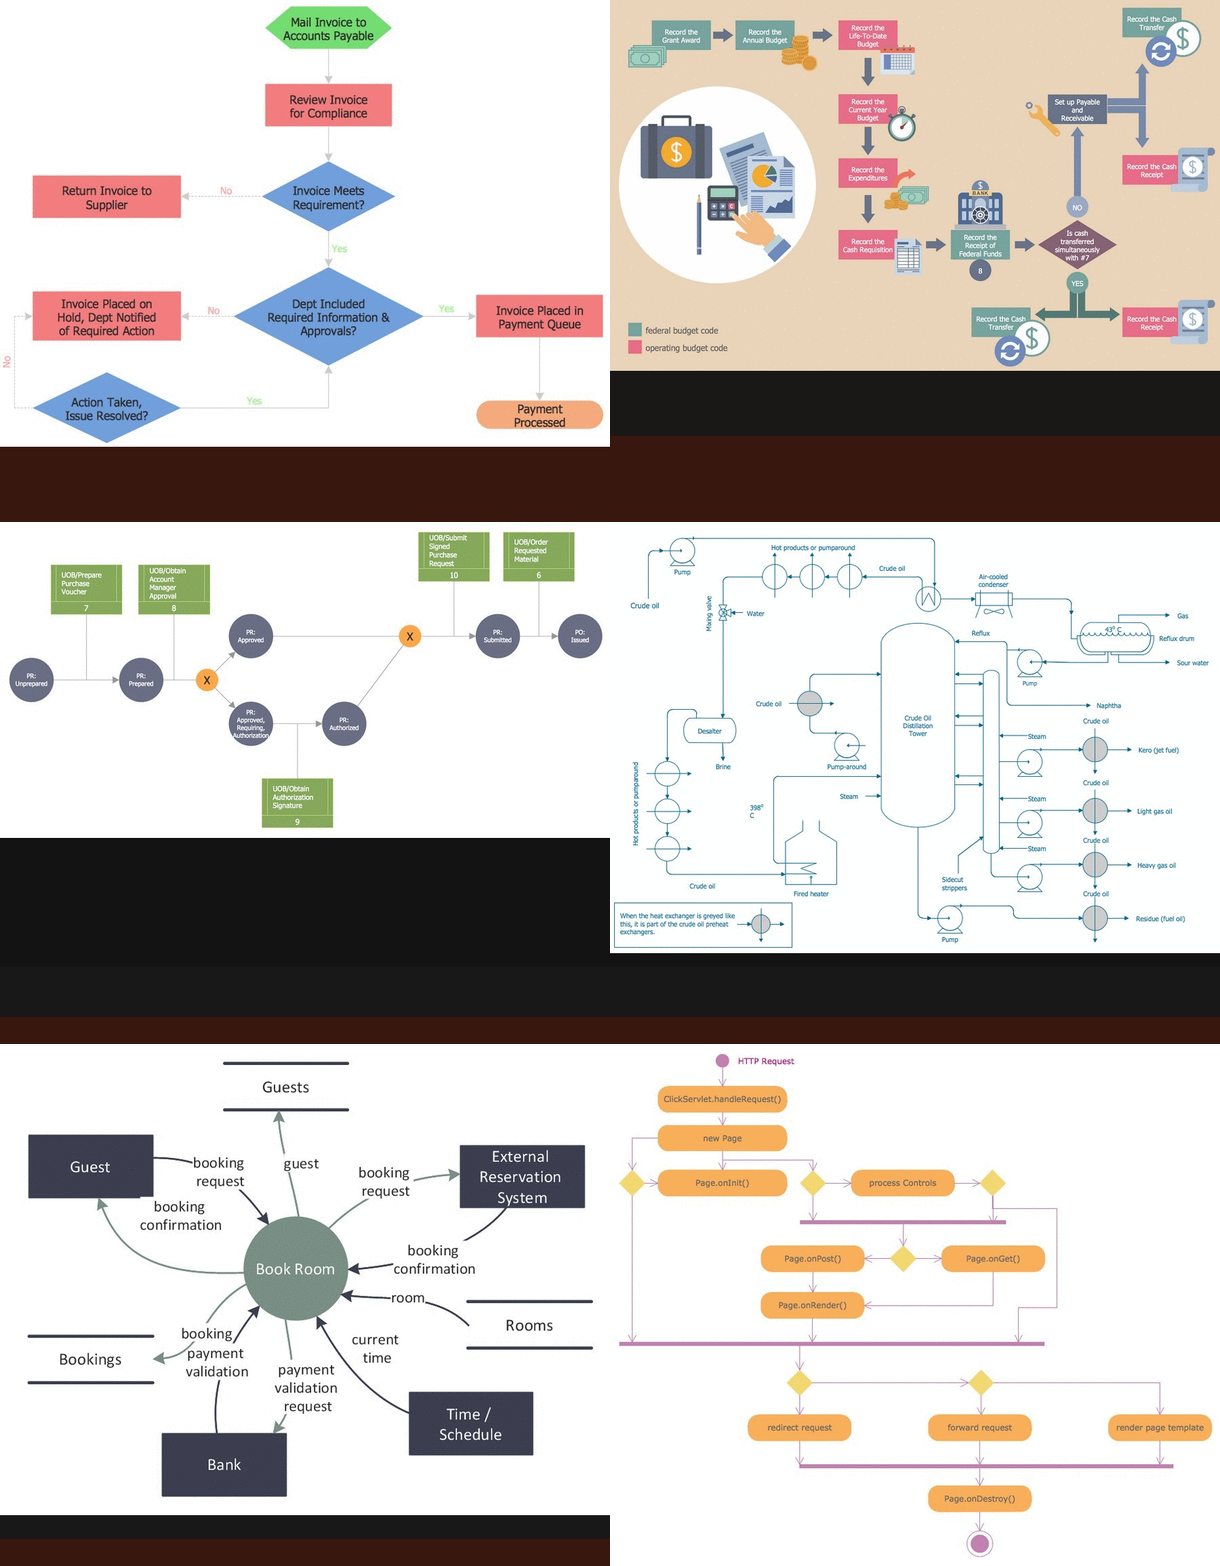
Picture: Flowchart Software: A Comprehensive Guide
Related Solution:
Nowadays, any architect or landscape designer can't do without a pack of digital tools for designing and projecting. Thus, there will be no problem to develop any landscape architecture plan with ConceptDraw DIAGRAM , especially since there are so many ready-to use templates and examples included. It's just as easy as drawing sketches on paper.
If you using ConceptDarw DIAGRAM there is no needs to have a professional skills on landscape and garden design. As well as you don't need to be an expert in architectural charts and plans drawing. The all you need is the Landscape and Garden solution. This solution contains a unique collection of the professional designed vector objects depicting flower and grass, bushes and trees, garden furniture, pools and accessories. In one word - the full set of graphical elements enabling to focus on the creativeness while creating your landscape and garden plan.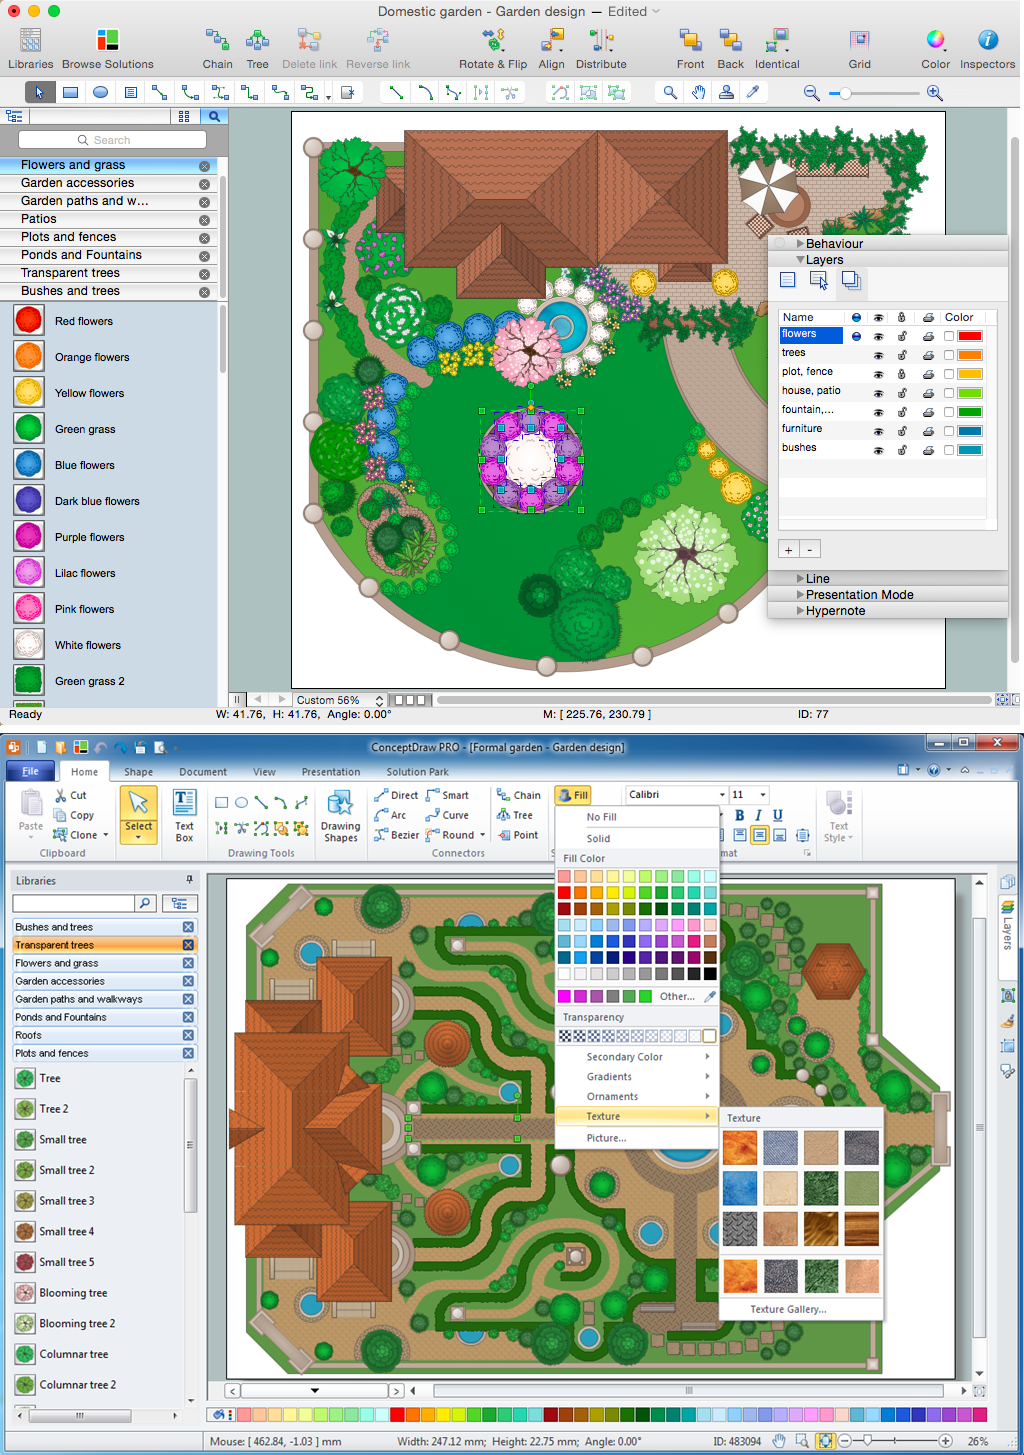
Picture: Landscape Architecture with ConceptDraw DIAGRAM
Related Solution:
You need to draw Authority Matrix Diagram quick and easy? Design it with ConceptDraw DIAGRAM!
ConceptDraw DIAGRAM extended with Seven Management and Planning Tools solution from the Management Area is the best Authority Matrix Diagram Software.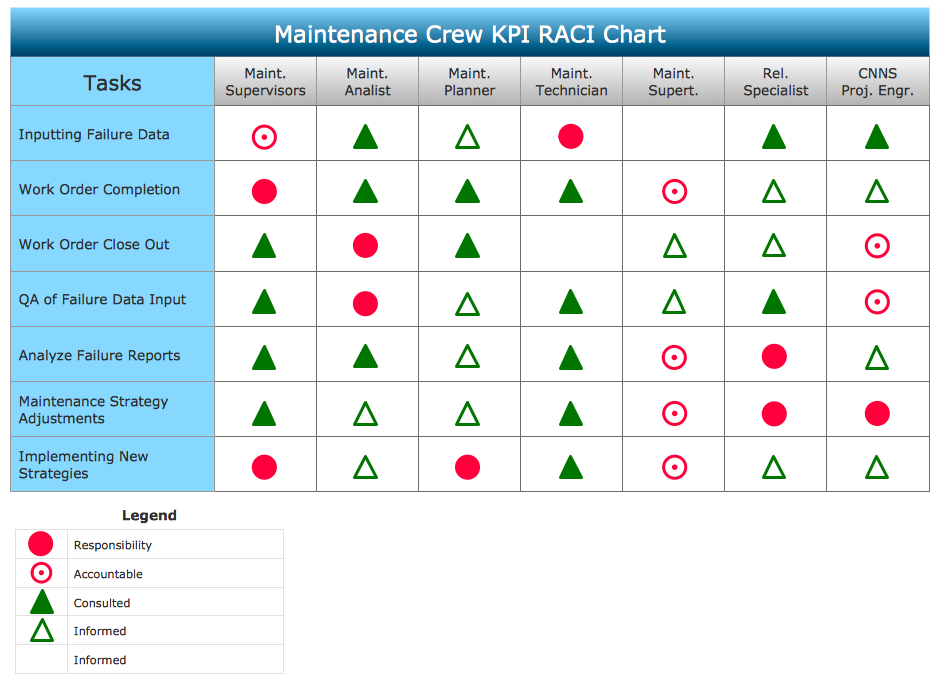
Picture: Authority Matrix Diagram Software
Related Solution:
Tools to do presentation of mindmaps via Skype.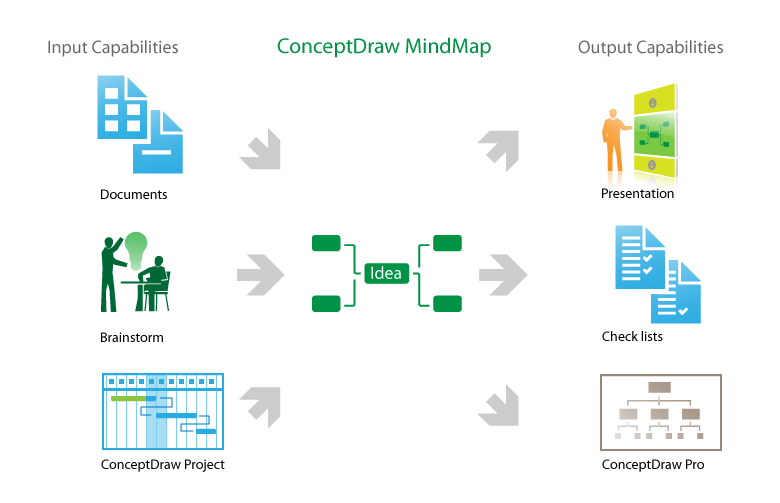
Picture: How to do presentation of Mind Maps via Skype conference call?
Related Solution:
ConceptDraw DIAGRAM is the world’s premier cross-platform business-diagramming tool. Many, who are looking for an alternative to Visio, are pleasantly surprised with how well they can integrate ConceptDraw DIAGRAM into their existing processes. With tens of thousands of template objects, and an easy method for importing vital custom objects from existing Visio documents, ConceptDraw DIAGRAM is a powerful tool for making extremely detailed diagrams, quickly and easily.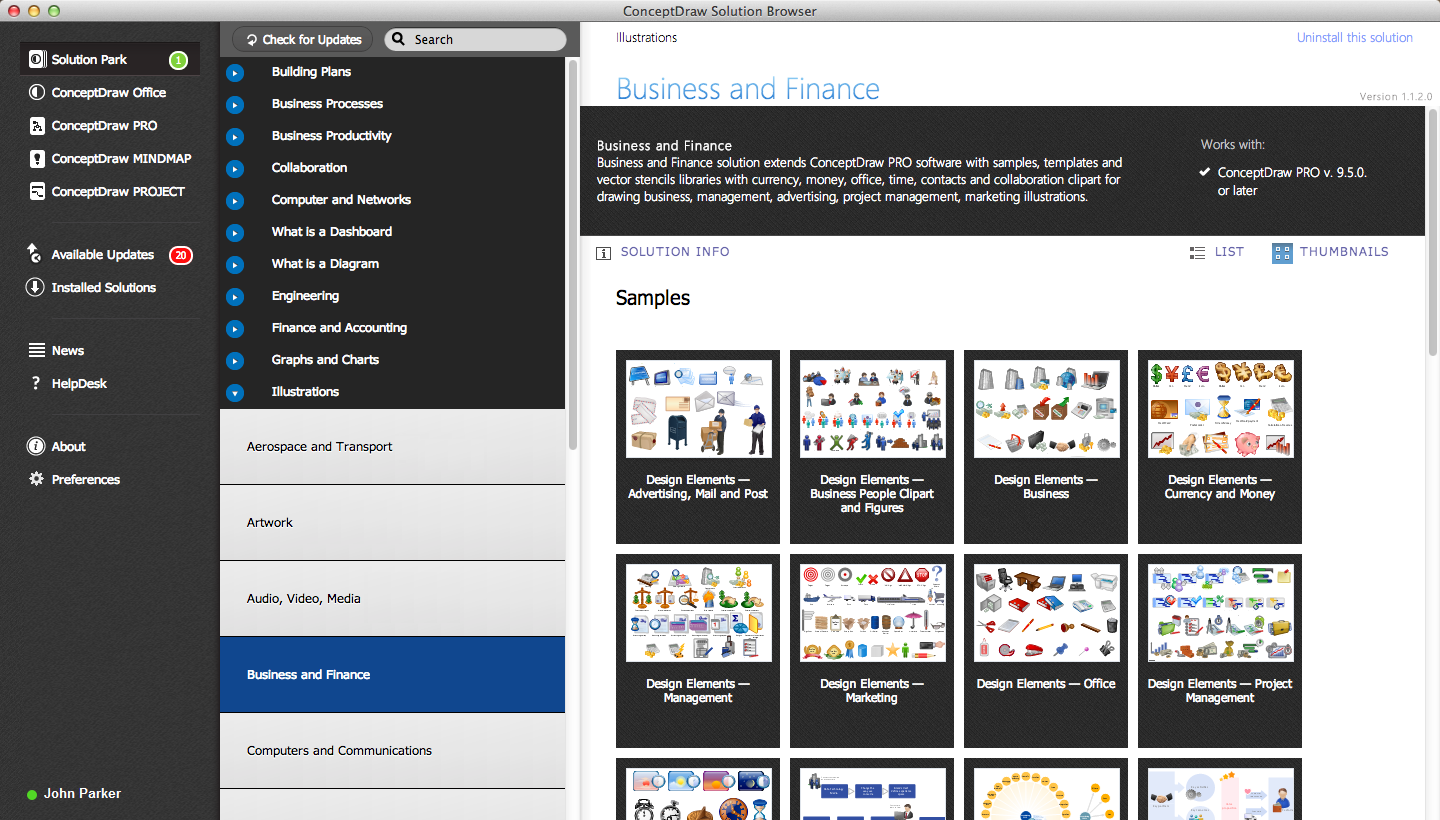
Picture: ConceptDraw DIAGRAM : Able to Leap Tall Buildings in a Single Bound
Related Solution:
One of the most popular option helps to draw diagrams faster is pre-designed set of examples related to each kind of diagram. ConceptDraw DIAGRAM software extended with the Workflow Diagrams solution delivers a complete set of workflow process examples helps you to start making your own workflow faster.
Picture: Workflow Process Example
Related Solution:
SWOT analysis is an effective method of business planning, the question is how to do it. The most obvious way is to make a SWOT analysis in a Word document, which is not very convenient. Luckily, you can use software like ConceptDraw DIAGRAM that has features and templates made especially for SWOT analyzing.
A SWOT Analysis is a manager's means of the strategic planning. It is used to define and classify considerable internal moments (strengths and weaknesses) and external forces (opportunities and threats) a business faces. You can use ConceptDraw MINDMAP to determine and organize factors utilized for SWOT analysis, and represent them in the SWOT matrix using ConceptDraw DIAGRAM. Using mind maps empowers you to explore and rank a lot of data engaged for SWOT analysis as well as recognize the relations between various pieces of information.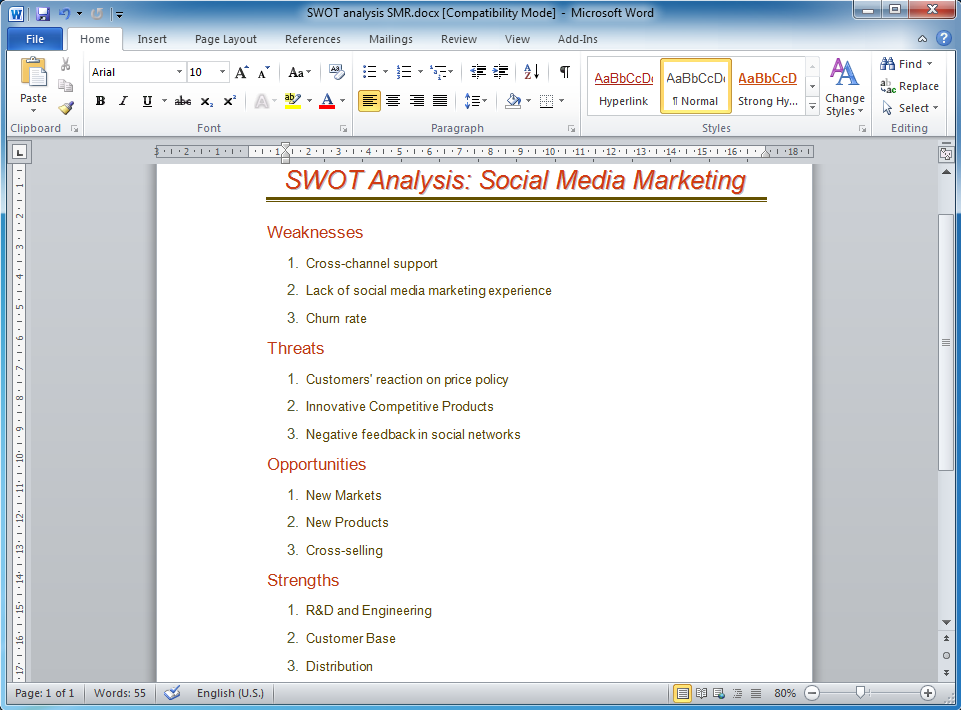
Picture: How to Make SWOT Analysis in a Word Document
Related Solution:
Comparing ConceptDraw DIAGRAM to Omnigraffle - Cross-platform product. While most drawing tools are designed for use on one operating system, ConceptDraw DIAGRAM is available as two independent and concurrent versions on both Macintosh (macOS) and PC (Windows).
License is per named user. That means you can use a single license for Macintosh and PC. Users can install at work and at home with a single license.
Picture: Comparing ConceptDraw DIAGRAM to Omnigraffle
Related Solution:
ConceptDraw DIAGRAM is a professional software for building flowcharts quickly with auto-connect technology.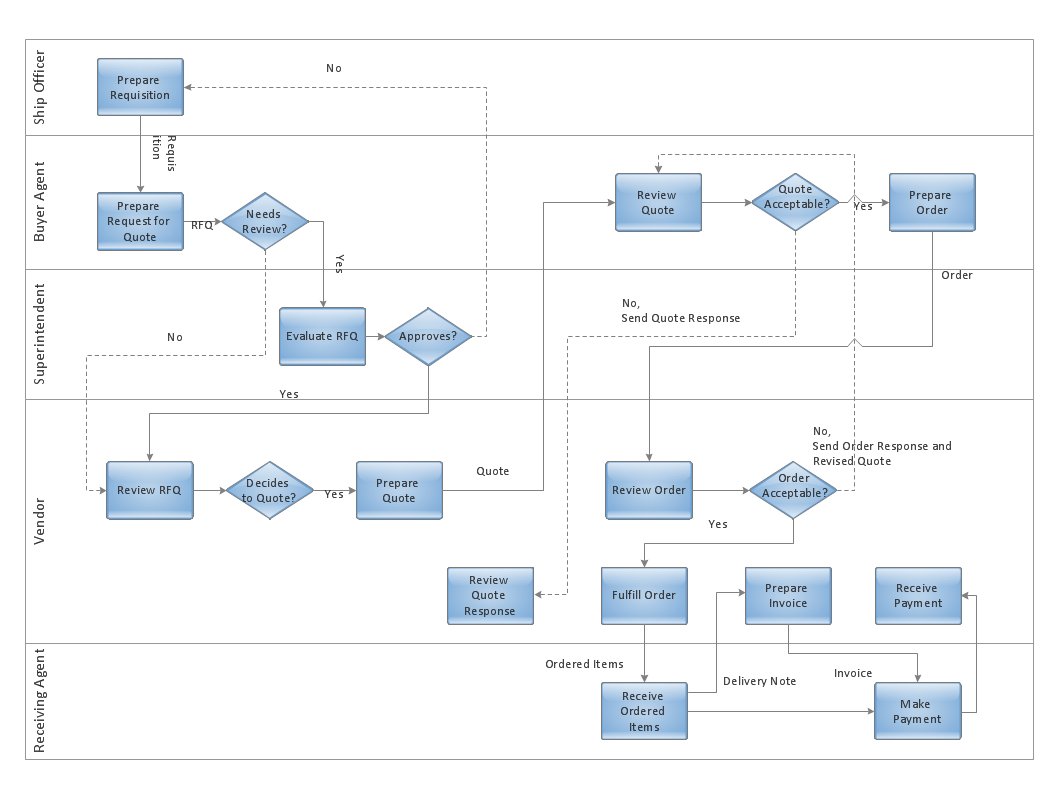
Picture: Build a Flowchart Quickly With AutoConnect
Related Solution:
ConceptDraw
MINDMAP 16