Authority Matrix Diagram Software
You need to draw Authority Matrix Diagram quick and easy? Design it with ConceptDraw DIAGRAM.
ConceptDraw DIAGRAM extended with Seven Management and Planning Tools solution from the Management Area is the best Authority Matrix Diagram Software.

Sample 1. ConceptDraw DIAGRAM - Authority Matrix Diagram Software
Seven Management and Planning Tools Solution offers you a wide set of various templates and samples that you can use as the base for drawing your own Authority Matrix Diagrams in minutes. All templates and samples are available from ConceptDraw STORE.

Sample 2. Seven Management and Planning Tools Solution in ConceptDraw STORE
ConceptDraw STORE is useful and convenient tool that allows you to navigate the ConceptDraw Solution Park, manage downloads and updates, take the access to libraries, templates and samples directly from it.
After choosing the desired template or sample, change it for your needs. Type the text, add clipart and shapes from the extensive libraries of Seven Management and Planning Tools Solution, change the style and colors of your Authority Matrix Diagram in minutes.
You can also create the own professional looking Authority Matrix Diagram de novo using the tools of Seven Management and Planning Tools solution from the Management Area. If you use some designations on your diagram, it is convenient to create the legend to explain the applied designations.

Sample 2. Authority Matrix Diagram
This sample was created in ConceptDraw DIAGRAM using the Seven Management and Planning Tools Solution and shows the Authority Matrix Diagram. An experienced user spent 10 minutes creating this sample.
Use the Seven Management and Planning Tools Solution for ConceptDraw DIAGRAM to create your own Authority Matrix Diagram of any complexity quick, easy and effective.
The Authority Matrix Diagrams designed with ConceptDraw DIAGRAM are vector graphic documents and are available for reviewing, modifying, converting to a variety of formats (image, HTML, PDF file, MS PowerPoint Presentation, Adobe Flash or MS Visio), printing and send via e-mail in one moment.
TEN RELATED HOW TO's:
ConceptDraw DIAGRAM is a powerful drawing and vector diagram maker software that allows to design the professional looking Influence Diagrams quick and easy.
Picture: Influence Diagram Software
Related Solution:
This sample was created in ConceptDraw DIAGRAM diagramming and vector drawing software using the UML Class Diagram library of the Rapid UML Solution from the Software Development area of ConceptDraw Solution Park.
This sample shows the structure of the building and can be used by building companies, real estate agencies, at the buying / selling of the realty.
Picture: UML Class Diagram Example - Buildings and Rooms
Related Solution:
If you need to pull together a quick marketing drawing, you'll find elements, samples, templates and libraries with vector clip art for drawing the Marketing Illustrations.
These symbols and signs you can use in your design for Strategic Marketing, Graphic Design, Inbound and Content Marketing, Social Media, Lead Generation, Email Marketing and Automation, CRM implementation and Integration and more.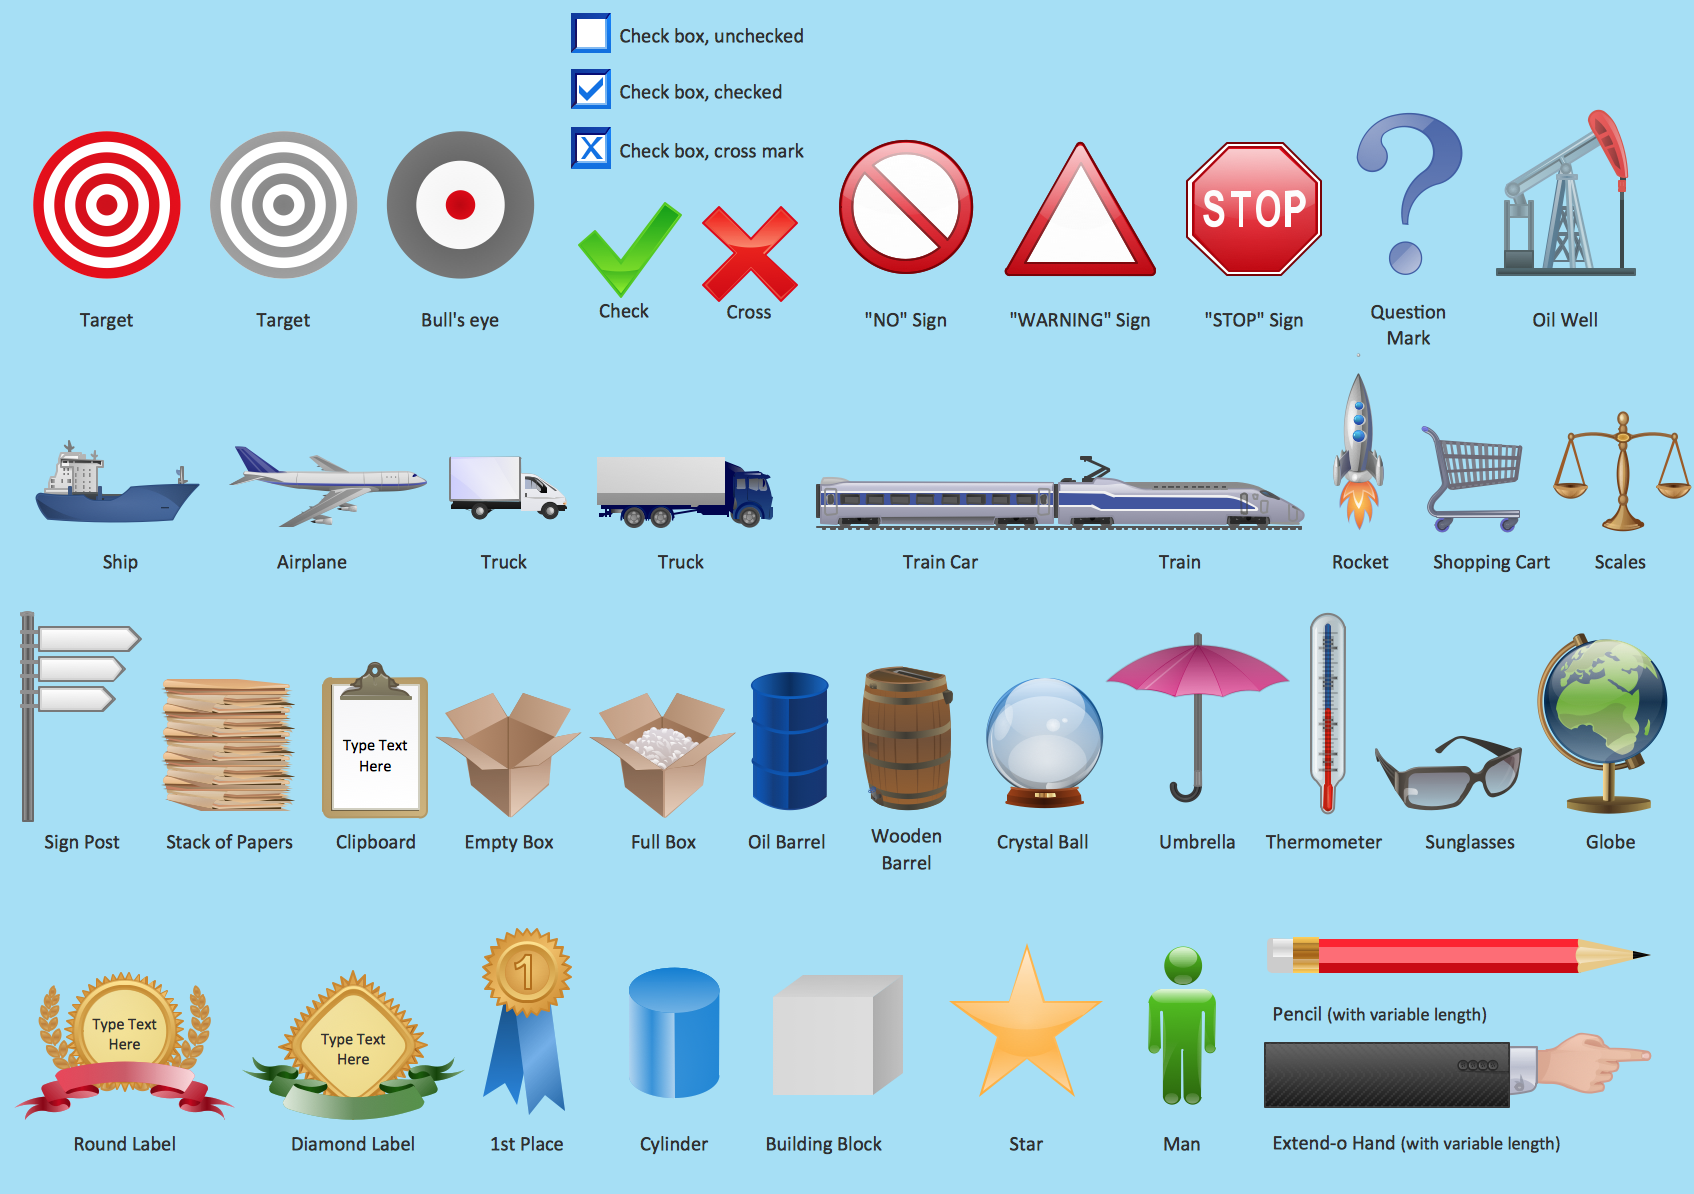
Picture: Marketing - Design Elements
Related Solution:
ConceptDraw DIAGRAM extended with Seven Management and Planning Tools Solution from the Management Area of ConceptDraw Solution Park is the best software for drawing all types of diagrams from the Seven Management and Planning Tools: Affinity Diagram, Relations Diagram, Prioritization Matrix, Root Cause Analysis Tree Diagram, Involvement Matrix, PERT Chart, and Risk Diagram (PDPC).
Picture: PDPC
Related Solution:
If you have your own business, you shouldn’t be afraid to use different management techniques. It also should be mentioned that SWOT analysis tool for small business is just as useful as for an transatlantic corporation. If you want to see whether you company is able to compete on the market, SWOT analysis is a great solution.
The following drawing illustrates the simple template, created for providing SWOT analysis. You can use it for your management courses as a tutorial for SWOT analysis. The tips, added to each section of a matrix are intended to help you to fill them with the information of the strengths and weaknesses of your training case, and do not forget, at the same time, about opportunities and threats. This template is one of a set of templates of SWOT matrices that can be found in the the ConceptDraw SWOT and TOWS diagrams solution. This solution used as part of simple project management software in ConceptDraw Office as advertising agency software or marketing management software.
Picture: SWOT Analysis Tool for Small Business
There are three main types of organizational structures which can be adopted by organizations depending on their objectives: functional structure, divisional structure, matrix structure.
ConceptDraw DIAGRAM diagramming and vector drawing software enhanced with 25 Typical Orgcharts solution from the Management area of ConceptDraw Solution Park is ideal for designing diagrams and charts of any organizational structure types.
Picture: Organizational Structure Types
Related Solution:
Every company meets some risks during project life cycle. It’s easy to face them using such tools as SWOT analysis matrix diagram that depicts Strengths, Weaknesses, Opportunities and Threats of any proposed subject. ConceptDraw Solution Park contains excellent templates of of SWOT and TOWS matrices.
Making SWOT matrix is frequently used in practical marketing. It is the valuable tool of marketing strategy development. SWOT matrix allows to define the strengths and weaknesses of the organization, possible outside threats and opportunities and evaluate the current strategic competitors. Using ConceptDraw SWOT and TOWS Matrix Diagrams solution you can perform SWOT analysis. You can create a SWOT matrix in and then compare the strengths and weaknesses of your organization and the opportunities and threats of market. The well-performed SWOT-analysis allows you define the steps that can be taken for the improvement of your company market position and determine and problems that need to be solve urgently.
Picture: SWOT analysis matrix diagram templates
Have you ever needed a flowchart, but did not have the time or tools to build one? Rapid Draw allows you to build a professional flowchart quickly and easily. You have the ability to add your own shapes to Rapid Draw’s built in shape library.
Picture: How To Create a FlowChart using ConceptDraw
Related Solution:
Customer relationship management is an important component of sales success. Visualizing sales data you may put some KPI related to customers relationship management to your Sales dashboard and track this important aspect in real time.
Picture: Customer Relationship Management
Use the Relations Diagram to create a relations factors map and to identify which factors are “drivers” and “indicators”. This diagram identifies causal relationships and determine what factors are causes or effects.
ConceptDraw OFFICE suite is a software for relation diagram making.
Picture: PROBLEM ANALYSIS.Relations Diagram