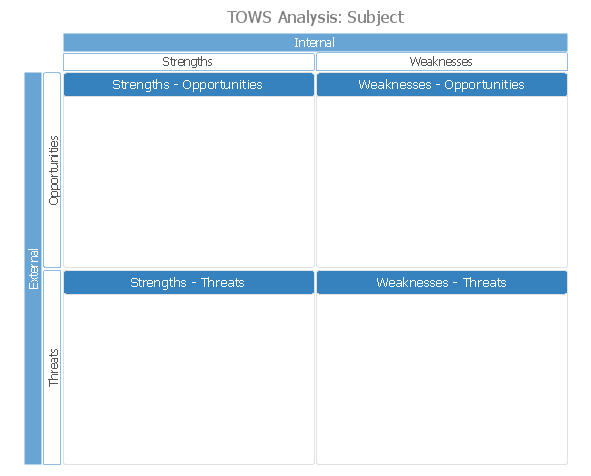
SWOT Matrix
Any SWOT analysis ends up as a SWOT matrix after a process of a structured planning method, which is widely used nowadays for evaluating the strengths, the opportunities, the threats and the weaknesses that are all involved in a project or in some business venture. Your own SWOT analysis can be carried out for your own product, the place of work or distribution, industry or some person you want to “evaluate”. The process of conducting such analysis usually involves the process of specifying the goal of some business venture or some project as well as identifying both the external and the internal factors that are either favorable or unfavorable to achieve the mentioned goal, but usually both — unfavourable and favourable — are mentioned there.

Example 1. SWOT Matrix
In other words, it is always important to know all the internal, external, helpful and harmful features connected to what you do, so you know how to improve the situation. Thinking about the helpful issues, such as Strengths and Opportunities, you can try to identify what exactly is so unique about your business and how you can improve the situation making more customers get interested in what you do and so to support your business. Making a list of the Strengths you might remember such things as the strategy you stick to and the special techniques you use in order to achieve the needed result. An example can be the way you control all the work building standards, the fact that you have a long-term improvement plan, targets, etc.
Thinking about the Opportunities of your business you might remember or get to know about your competitors’ strategies which you can always use as well or simply take into consideration what people in the modern world like and want to happen. For example, becoming more eco-friendly is always a good way of changing your attitude to doing business. An example of a list of opportunities can be the following: using better software, such as ConceptDraw DIAGRAM diagramming and drawing one; investing more money in Internet Technology as a fast-growing field of study; opening more offices abroad; taking a chance by replacing the previous ineffective competitor in a way of occupying its place; etc.

Example 2. SWOT Analysis Library Design Elements
Next, it is always important to realise how the weaknesses are important so they do not do any more harm to your business, but to analyse them and so to replace is what the task is as the result of conducting the SWOT analysis ending up having a great looking as well as useful SWOT matrix. The weaknesses may be the business owner or other management’s lack of experience in some particular field of business, which can be precluded by simply going through the necessary training. Another example of the weaknesses of your organization may be the already damaged reputation, so once you failed in the past it may stay in people’s mind for a long time, so you might find it too hard to vanish the happened problem away. Sometimes analysing such situation the business owners may realize it is better to shut some of the stores down where the incident took place rather than trying to make it up for those who were the witnesses of what happened in the past in those stores (if, for example, the rude personnel used to work there serving in a bad way or some other issues).
And, finally the Threats. This last section of the SWOT matrix can be filled with the really good innovations in the competitor’s business which you cannot cope achieving yet; the new (e.g., much higher) rates you can hardly pay for; some new legal restrictions; some new, very rich competitor in your field of business which prevent you to achieve your own goals on the same market; the price wars with your competitors, who, for example, have a better service or product or/and some superior access to some particular channels of distribution which reduces the cost of purchase.
All of the mentioned sections of the SWOT matrix have to be carefully analysed and so the decision of either staying on the market trying to succeed or changing the occupation or changing only your employees or strategies, should be made. Making the decision, you should always think about how well you previously described each of the blocks — Opportunities, Threats, as well as Strengths and Weaknesses — as it is very important to be realistic about such evaluation and, if needed, to ask some finance consultant to advise you certain things before the important decision is made.
Conducting any SWOT analysis, you should answer lots of questions about your business to yourself, such as “What is so special about my product people like?”, “How can I improve my product/products/services/etc.?”, “What should be done in order to get more profit?”, “What can I do to make my competitors give up with their business seeing me prospering and so being scared of failing?”, etc. There are also very many other questions to ask not only yourself, but those who really care for this business, mainly — the top managers.
An example of the filled SWOT matrix may look this way, having Opportunities as “A particular government contract allows me to bring a great revenue increase; Having a particular project will make a positive reflection to my portfolio”, etc.; Threats as “We can lose some of our customers/providers/partners in we do such changes; The travel costs will lead to losing too much money and there is no guarantee we will achieve the needed result”, etc.; Strengths as “We have a very skilful staff who can deal with the new challenge; We have more finance now from the new investors to boost the sales”, etc.; and the Weaknesses as “Geographically our office is removed from the target audience, We do not have the needed connections”, etc.

Example 3. SWOT Matrix in ConceptDraw STORE
No matter what your business is, you can always add to your Opportunities in SWOT matrix another one which is getting the ConceptDraw DIAGRAM diagramming and drawing software being downloaded from this site in order to make any needed drawings, such as SWOT matrices with the help of SWOT and TOWS Matrix Diagrams Solution from ConceptDraw STORE.