Pyramid Diagram
Priority Pyramid Diagram
A very well-known and popular for students to learn in the university, especially if they want to become the successful economist, is a “Maslow's hierarchy of needs” which is expected to be known by heart, as it is a theory proposed by Abraham Maslow in 1943, which idea was to include his observations of the humans' innate curiosity by using such terms as "safety", "physiological", "self-transcendence", "belonging", "esteem" and "self-actualization", for describing the human motivations moving through. The goal of the mentioned Theory was to attain the sixth level of the stage, which is known to be the one describing the so called “self transcendent needs”.
Maslow studied what was called by the term of the “exemplary people”. Such people were Jane Addams, Albert Einstein, Frederick Douglass and Eleanor Roosevelt, as well as the healthiest one percent of the students from the colleges. For the very first time, Maslow's theory was expressed at a full in his book in 1954. The name of the book was “Motivation and Personality” and it described the hierarchy remaining a very popular framework in the sociology research, secondary and higher than secondary psychology, as well as the management training instruction.
The described Maslow's hierarchy of needs is often known to be represented in the shape of a pyramid where the largest, most fundamental levels of needs are at the very bottom of it and the need for self-transcendence and self-actualization are at the very top. All ConceptDraw DIAGRAM users can always create such pyramid within only a couple of minutes, especially if they have a needed and very useful solution, known to be the one called the “Pyramid Diagrams” one. Having ConceptDraw DIAGRAM as well as ConceptDraw STORE application can enable you to create the most basic and fundamental layers of the pyramid of needs, including what Maslow called as the "deficiency needs". There are known to be four layers within such pyramid, describing the esteem, love and friendship and security, as well as the physical needs. In case the mentioned "deficiency needs" are not met, then people feel tense as well as anxious searching for what may please them.
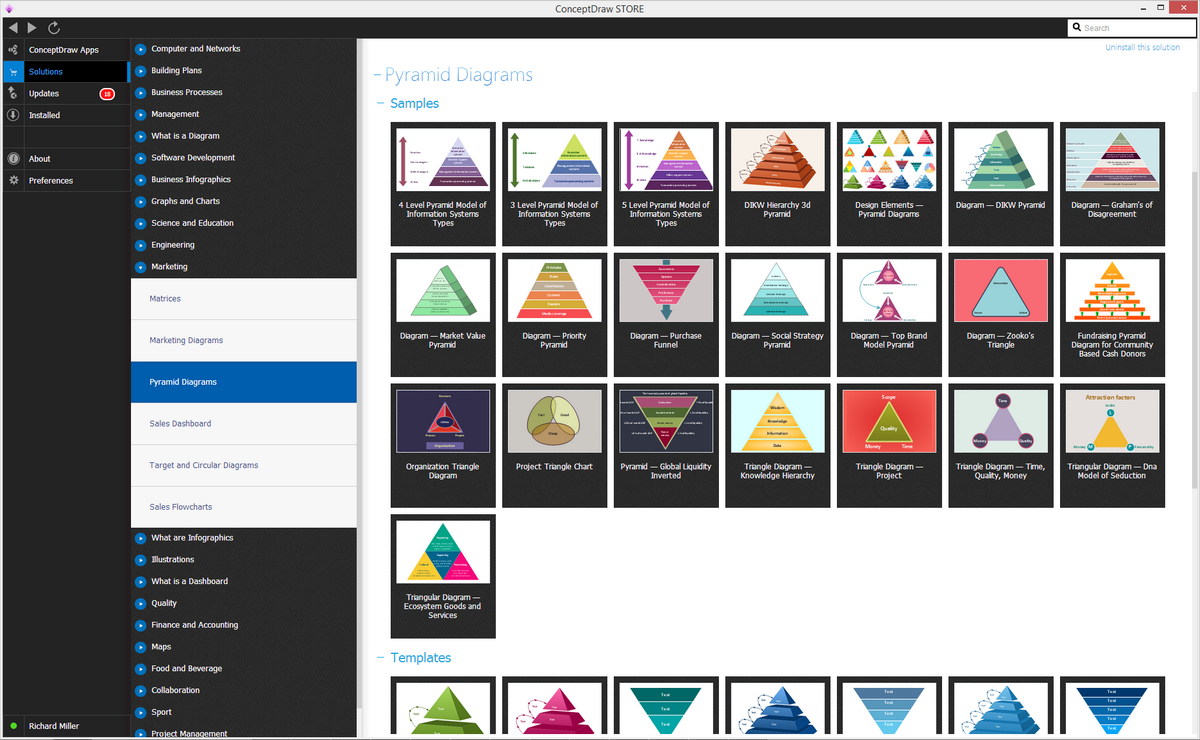
Example 1. Pyramid Diagrams Solution
According to Maslow, the most basic level of needs must be met just before a person starts to strongly desire the higher levels of needs. Again, according to the “inventor” of the describe theory, it is known to be needing, instead of stating that you focus on a certain need at any given time, a certain need may "dominate" your organism completely. It is known to be likely, that the different levels of motivation can occur any time, but it is important to focus on identifying the very basic types of motivation as well as the order in which they are expected to be met.
The physiological needs are the most important physical requirements for human survival which have to be met first of all, otherwise the human body cannot function in a proper way any longer, failing. Such physiological needs are: air, water, food, which are known to be the so called “metabolic requirements”, needed for a simple survival in all animals, not only humans. Once they are satisfied, then “safety needs” need to be satisfied after. Such security and safety needs include both personal and financial security, well-being and health. The third level of the mentioned pyramid of needs should include all the interpersonal human needs, such as feeling of belongingness, being especially strong in children, overriding the need for safety. Such needs include the need in friends, intimacy and family, such as parents.
Also, all human beings need to feel respected, including their need to have a self-esteem, which is known to be a desire to be valued and accepted by others, as well as a self-respect. People are known to be engaged in some profession or some particular hobby simply in order to gain some recognition as well as appreciation. Such activities may give the person a sense of value as well as a sense of contribution. There are known to be the so-called "lower" as well as "higher" versions of esteem, where "lower" is the need for respect from other people, including a need for recognition (as it was already mentioned before), status, prestige, attention and fame, when the "higher" one is simply the need for self-respect.
Another level within the Maslow’s pyramid of needs is called as “self-actualization”, being the one referred to what people’s full potential is as well as its realization. Maslow himself describes such level as a desire for accomplishing everything that people can in order to become the best version of himself, basically. The best version of the drawing software, known to be very popular nowadays for a reason of it to be very progressive, including providing the numerous opportunities for its users for creating the best-looking as well as smart and very professional drawings, such as the one of the pyramids, including the Maslow's hierarchy of needs, that can be simply drawn with help of ConceptDraw DIAGRAM software (as well as ConceptDraw STORE), which is known to be one of the best applications, providing the so called “solutions” with all the necessary tools for making great looking diagrams, plans, maps, charts, flowcharts and, of course, sophisticated pyramids.

Example 2. Pyramid Diagram. Priority pyramid
Thus, having ConceptDraw DIAGRAM drawing software will allow you to make the needed pyramid or any other drawing within a very short period of time, from a couple of minutes up to an hour, having the previously created examples of the needed drawings available in the described above “solutions”. One of the solutions, which can be used for assisting all the ConceptDraw DIAGRAM users in their drawings of the pyramids, is a Pyramid Diagrams one. Having it means having all the twenty-eight pre-made design elements, including the templates of the pyramids which all can be used as drafts for making different ones, depending on what you want to draw.
See more Pyramid Diagram:
- Zooko Triangle Diagram
- Time, Quality, Money Triangle Diagram
- Project Triangle Diagram
- Purchase Funnel Diagram
- Project Triangle Chart
- Priority Pyramid Diagram
- Organization Triangle Diagram
- Knowledge Triangle Diagram
- Triangular Graphic
- Inverted Pyramid
- Fundraising Pyramid
- 3D Triangle Diagram
- DIKW Pyramid
- Five level pyramid model
- Four level pyramid model
- Three level pyramid model

.png)


