Pyramid Diagram
Inverted Pyramid
This inverted pyramid diagram of global liquidity shows world GDP and liquidity for 4 levels:
- Derivatives,
- Securitised debt,
- Broad money,
- Power money.
This triangular chart example is included in the Pyramid Diagrams solution from Marketing area of ConceptDraw Solution Park.

Example 1. Pyramid Diagram. Global liquidity inverted pyramid
This inverted triangle diagram was redesigned using ConceptDraw DIAGRAM diagramming and vector drawing software from Wikimedia Commons file The inverted pyramid of global liquidity.gif.
[commons.wikimedia.org/wiki/File:The_inverted_pyramid_of_global_liquidity.gif]
This file is licensed under the Creative Commons Attribution-Share Alike 3.0 Unported license. [creativecommons.org/licenses/by-sa/3.0/deed.en]
See more Pyramid Diagram:
- Zooko Triangle Diagram
- Time, Quality, Money Triangle Diagram
- Project Triangle Diagram
- Purchase Funnel Diagram
- Project Triangle Chart
- Priority Pyramid Diagram
- Organization Triangle Diagram
- Knowledge Triangle Diagram
- Triangular Graphic
- Inverted Pyramid
- Fundraising Pyramid
- 3D Triangle Diagram
- DIKW Pyramid
- Five level pyramid model
- Four level pyramid model
- Three level pyramid model
TEN RELATED HOW TO's:
The Line Graphs solution from Graphs and Charts area of ConceptDraw Solution Park contains a set of examples, templates and design elements library of line and scatter charts. Use it to draw line and scatter graphs using ConceptDraw DIAGRAM diagramming and vector drawing software for illustrating your documents, presentations and websites.
Picture: Line Chart Examples
Related Solution:
Network community structure is a network which nodes can be easily grouped into the sets of nodes with dense internally connections.
This example shows a network that displays the community structure with three groups of nodes with dense internal connections and sparser connections between the groups.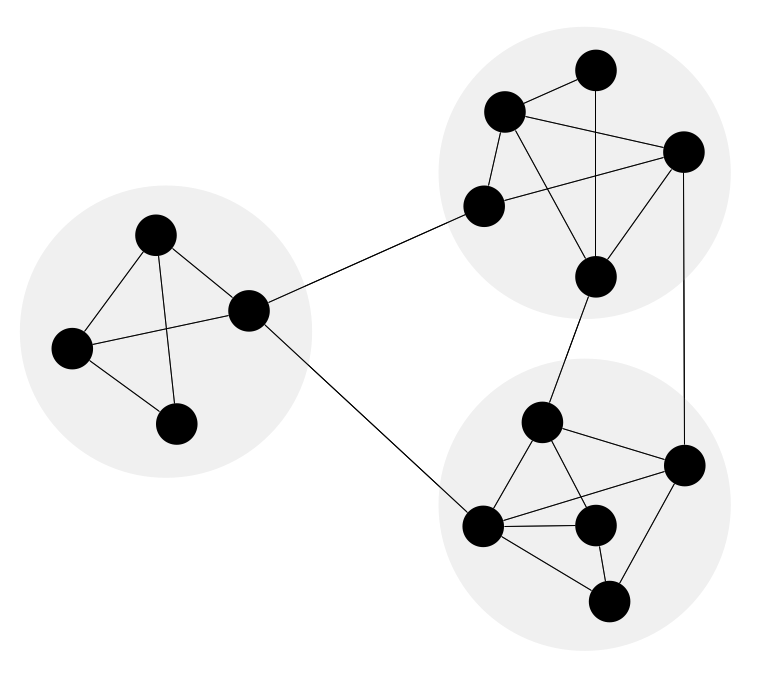
Picture: Network Community Structure. Computer and Network Examples
Related Solution:
ConceptDraw DIAGRAM software is a great assistant in electrical engineering and electrical design. It is efficient in creating ✔️ complex and simple electrical designs, ✔️ power generation, transmission, and distribution electrical schematics, ✔️ transformers diagrams, ✔️ electrical schematics with transformers
Picture: Electrical Symbols — Transformers and Windings
Related Solution:
It can be tough to get straight into business papers and processes.Otherwise, you can learn how to create flowcharts for an accounting information system and visualize these documents. Accounting diagrams are clear and easy to understand for all the participants of the process.
There are symbols used for creating accounting flowcharts using ConceptDraw DIAGRAM and its Accounting Flowcharts solution. Accounting flow charts are a special kind of flow charts. Actually a variety of flowcharts are often used to facilitate many aspects of a workflow of accounting department. Accounting flowcharts are utilized to support creating accounting documentation, to depict positions responsible for fulfillment of each phase of accounting workflow.
Picture:
How to Create Flowcharts for an
Accounting Information System
Related Solution:
Chemistry solution provides the Chemical Drawings Library with large quantity of vector chemistry equation symbols to help you create professional looking chemistry diagrams quick and easy.
Picture: Chemistry Equation Symbols
Related Solution:
Since the most applications keep their data in databases, the database design and database modeling play highly important role during the process of applications development. The ConceptDraw DIAGRAM software enhanced with EXPRESS-G data Modeling Diagram solution perfectly suits for construction the database models and designing the Database model diagram using EXPRESS-G notation, for representing the data structures required to design and create the databases permitting to retrieve and write data quickly.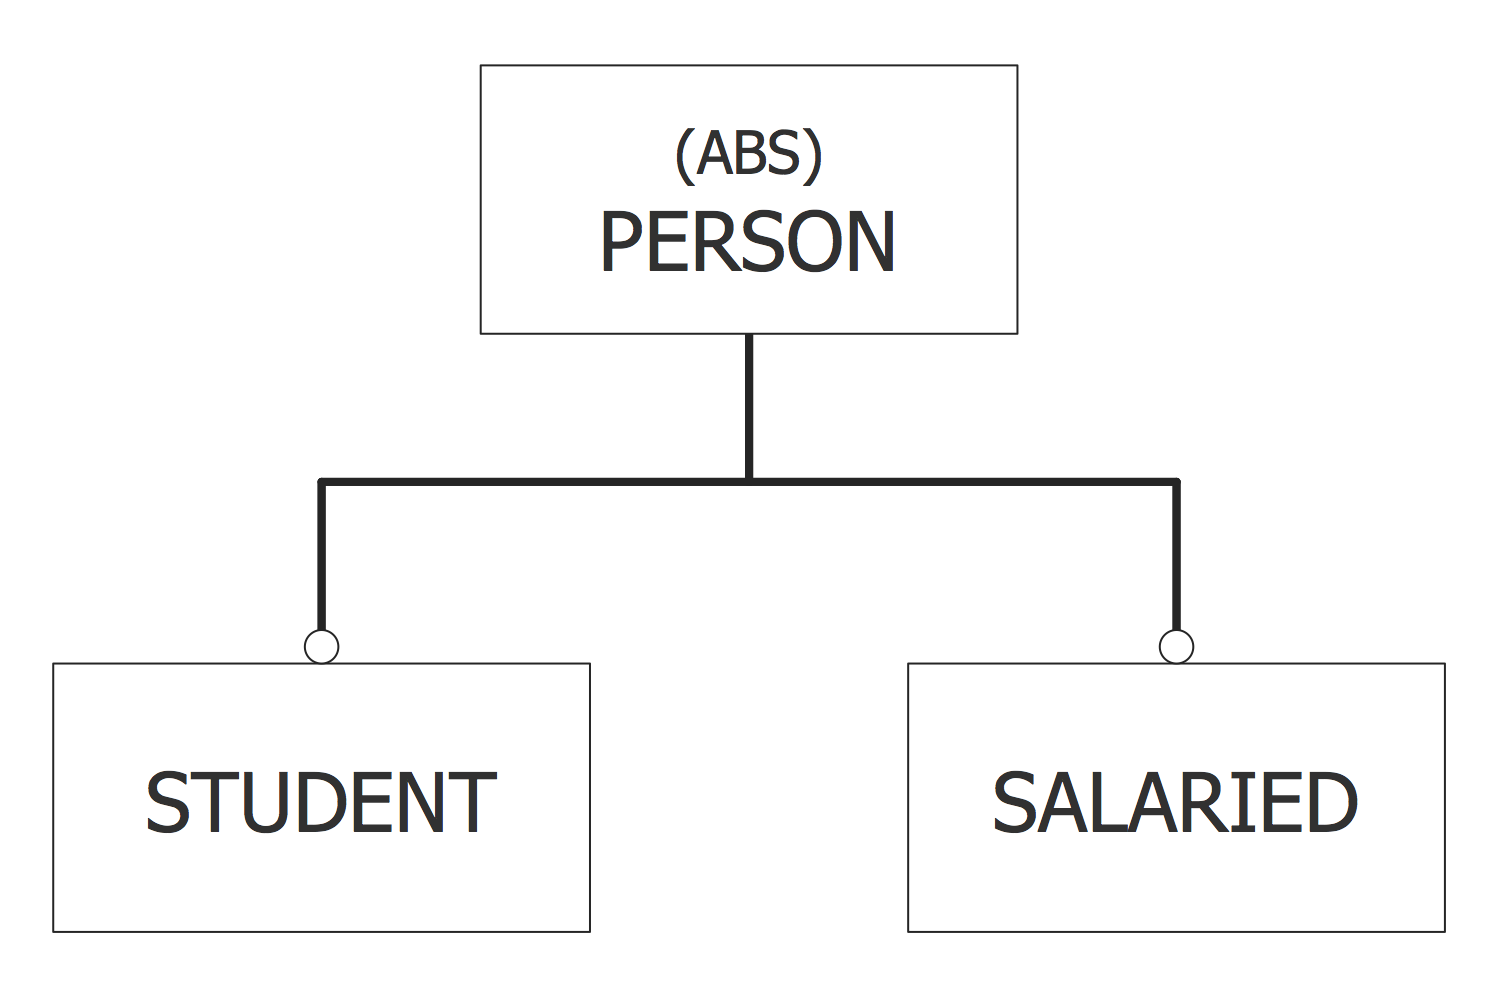
Picture: Database Model Diagram
Related Solution:
All computer networks differ by various params, and their size is one of them. As global area networks are the biggest, personal area (PAN) networks are the smallest. Personal computers, smartphones and other devices that have possibility to connect to Internet form a personal network.
This diagram was created using ConceptDraw Computer Network Diagrams to represent a typical components of Personal area network. A personal area network (PAN) is the connection of IT devices around an individual person. This sample of personal area network involves a notebook, a personal digital assistant (PDA), and a portable printer. Commonly a PAN contains such wireless devices as mouse, keyboard, smartphone and tablet. A wireless connection is typical for a PAN.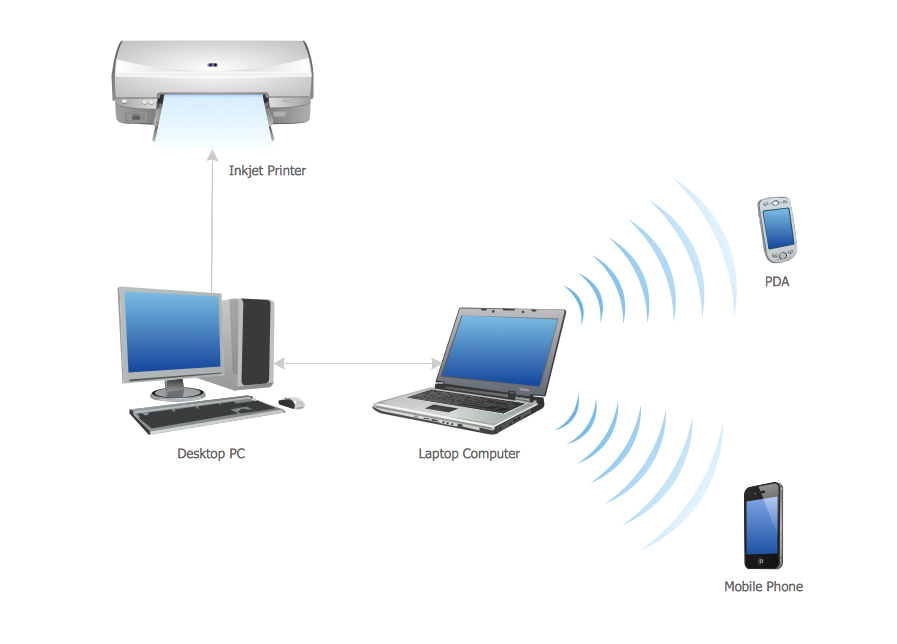
Picture: Personal area (PAN) networks. Computer and Network Examples
Related Solution:
State Diagram UML of Online Store. This sample was created in ConceptDraw DIAGRAM diagramming and vector drawing software using the UML Class Diagram library of the Rapid UML Solution from the Software Development area of ConceptDraw Solution Park.
This sample shows the work of the medical shop and is used at the creation of the medical shop or pharmacy project, for understanding the process of shopping in the medical shop, for keeping purchases, for medical supplies.
Picture: UML Class Diagram Example - Medical Shop
Related Solution:
This template shows the Six Markets Model Chart and was included in Marketing Diagrams Solution. It is available from ConceptDraw STORE and can be used as the base for creating your own marketing diagrams.
Picture: Six Markets Model Chart Template
Related Solution:
ConceptDraw DIAGRAM software supplied with HR Flowcharts Solution can effectively help in labour-intensive process of human resource development.
Picture: Human Resource Development
Related Solution:
ConceptDraw
DIAGRAM 18