
Example 1. Business Calendar
Calendars Solution offers the Calendars library with 44 predesigned vector shapes for drawing any business calendar in minutes. These objects are the good ideas and excellent start for the calendars of different designs.

Example 2. Calendars Library Design Elements
Create new document and simply drag the favorite calendar object from the Calendars library and enter your business data. You are also able to change the color style of your calendar.

Example 3. PBEM Director Calendar
The samples you see on this page were designed in ConceptDraw DIAGRAM software using the tools of the Calendars Solution. Each of them is a professional looking business calendar. An experienced user spent 15 minutes creating every of these samples.
Use the Calendars solution to create your own professional looking and attractive business calendar quick and easy.
All source documents are vector graphic documents. They are available for reviewing, modifying, or converting to a variety of formats (PDF file, MS PowerPoint, MS Visio, and many other graphic formats) from the ConceptDraw STORE. The Calendars Solution is available for ConceptDraw DIAGRAM users.
TEN RELATED HOW TO's:
ConceptDraw Pyramid Diagram software allows drawing column charts using predesigned objects or drawing tools.
Picture: Pyramid Diagram
Related Solutions:
ConceptDraw PROJECT provides a set of construction Gantt chart examples. Project manager requires task tracking, and project examples best approach to start. Make your project applying one of our ready-made examples.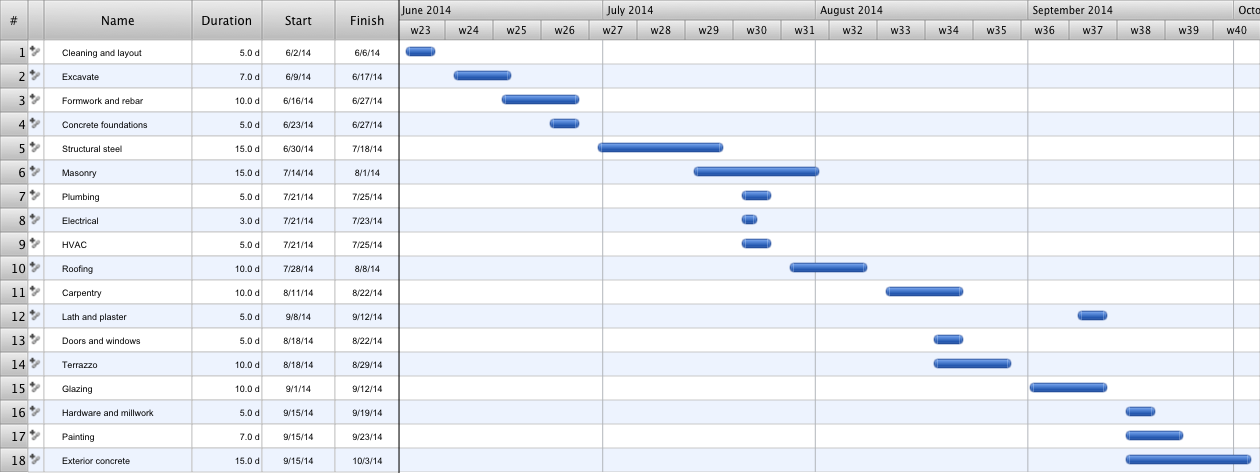
Picture: Construction Project Chart Examples
An advanced tool for creating presentations, if you decide to represent data without spending hours on that.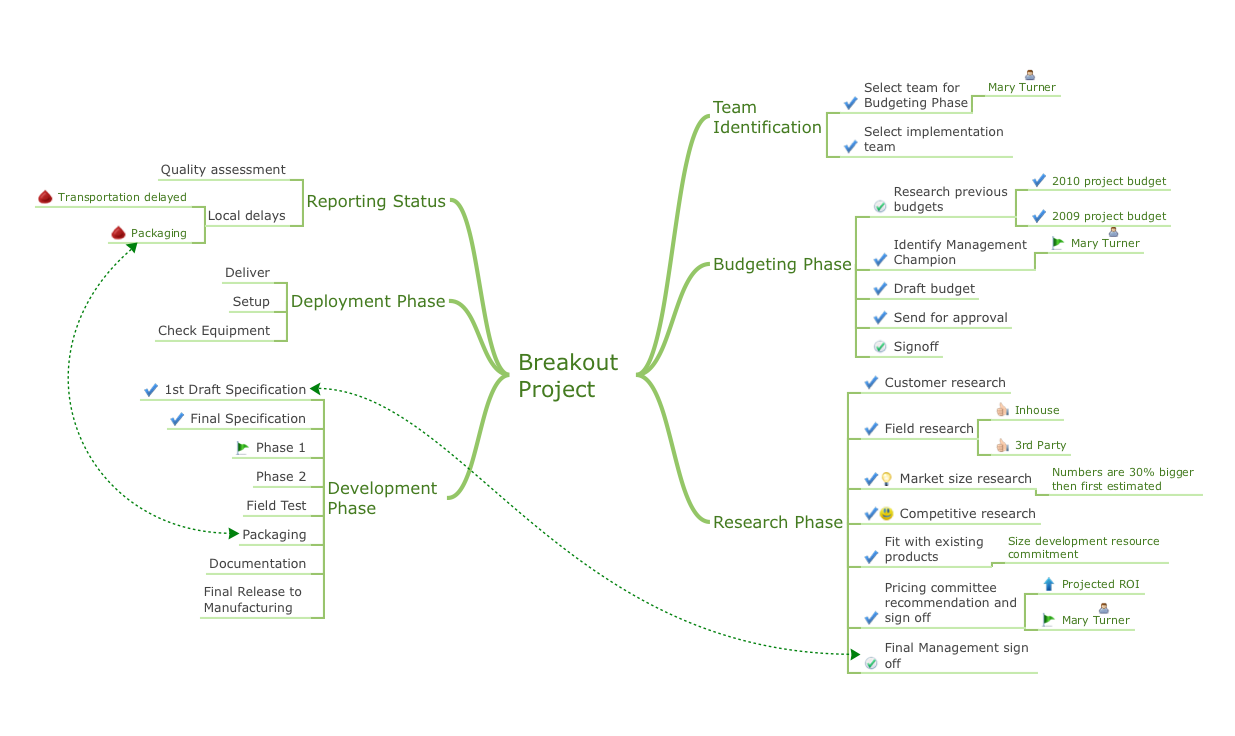
Picture: Best Software for Making Presentations
Related Solution:
Why do you need network visualizations? 🔸 Unlock the full potential of network visualization with our in-depth guide on using the ConceptDraw Network Visualization Tool. ✔️ Explore features, tips, and best practices to create stunning visual representations of your network architecture
Picture:
Network Visualization Guide.
How to Use ConceptDraw Network Visualization Tool
Related Solutions:
Visual navigation through the stages of a response process helps you locate specific actions to be taken via Action Mind Maps. Use ConceptDraw DIAGRAM and ConceptDraw MINDMAP for organize the process of response for interactions occurring in social media.
Picture: Create Response Charts
Related Solution:
ConceptDraw PROJECT is a powerful Gantt Chart Software. The Gantt Charts are useful for displaying a large amount of detailed information, project tasks and timelines in a visually pleasing, easy-to-understand format.
ConceptDraw PROJECT provides wide capabilities of importing and exporting in various formats: Microsoft Project, ConceptDraw MINDMAP , Mindjet MindManager, PDF file.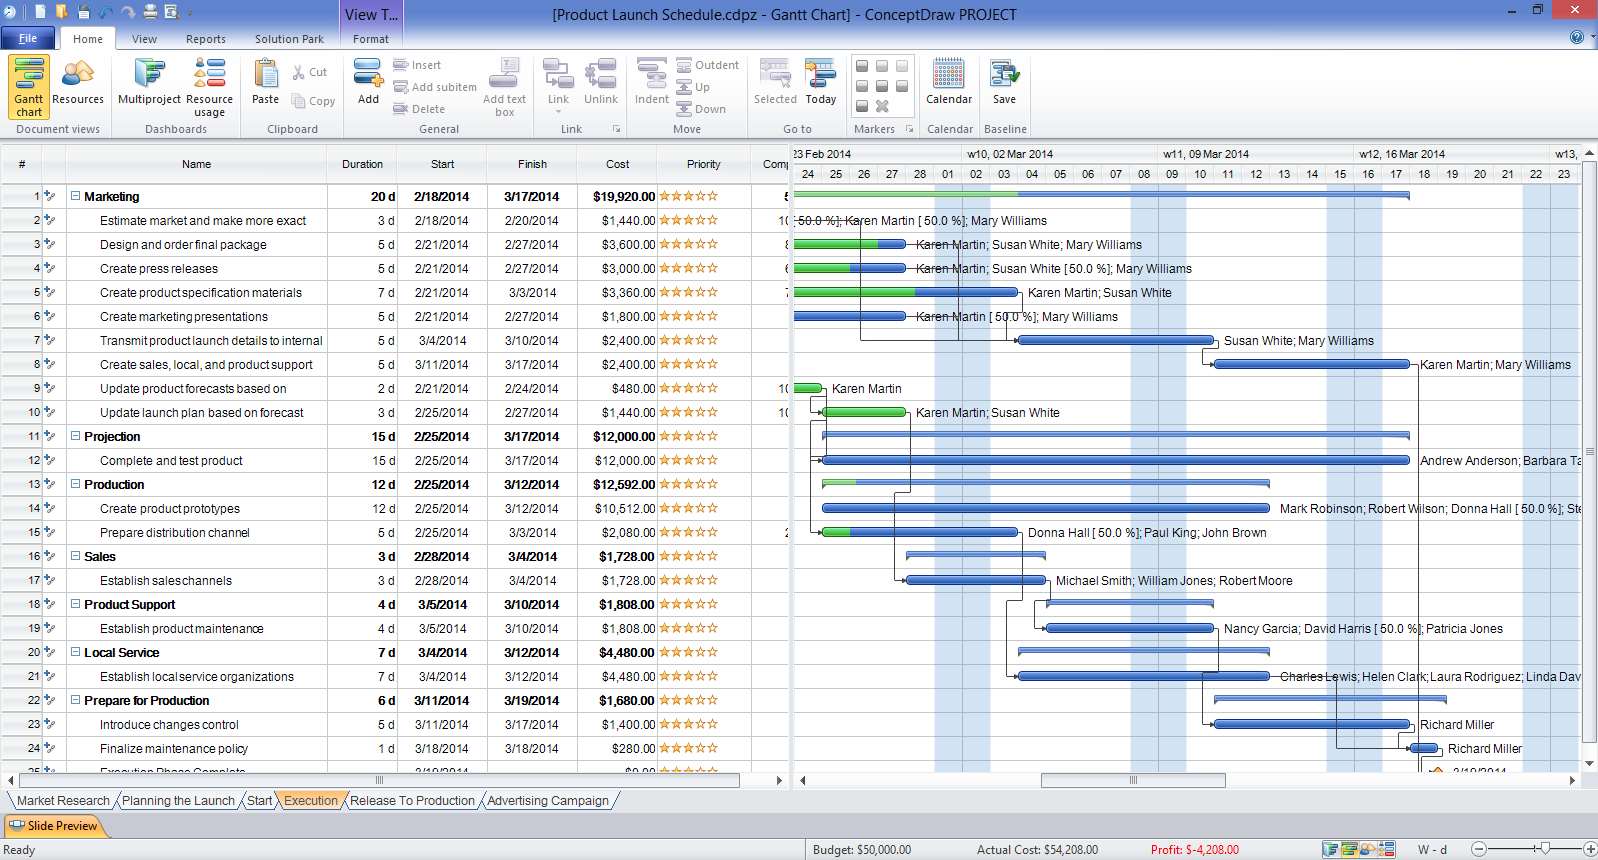
Picture: Gantt Chart Software
To support you in your tasks you can use the power of ConceptDraw DIAGRAM providing
intelligent vector graphics that are useful for marketing diagramming and
ConceptDraw MINDMAP for key marketing mind maps.
Picture: Business Productivity - Marketing
Related Solution:
How to describe the necessity of using network security devices and visually illustrate this information? Now, it's very easy thanks to the ConceptDraw DIAGRAM diagramming and vector drawing software extended with Network Security Diagrams Solution from the Computer and Networks Area of ConceptDraw Solution Park.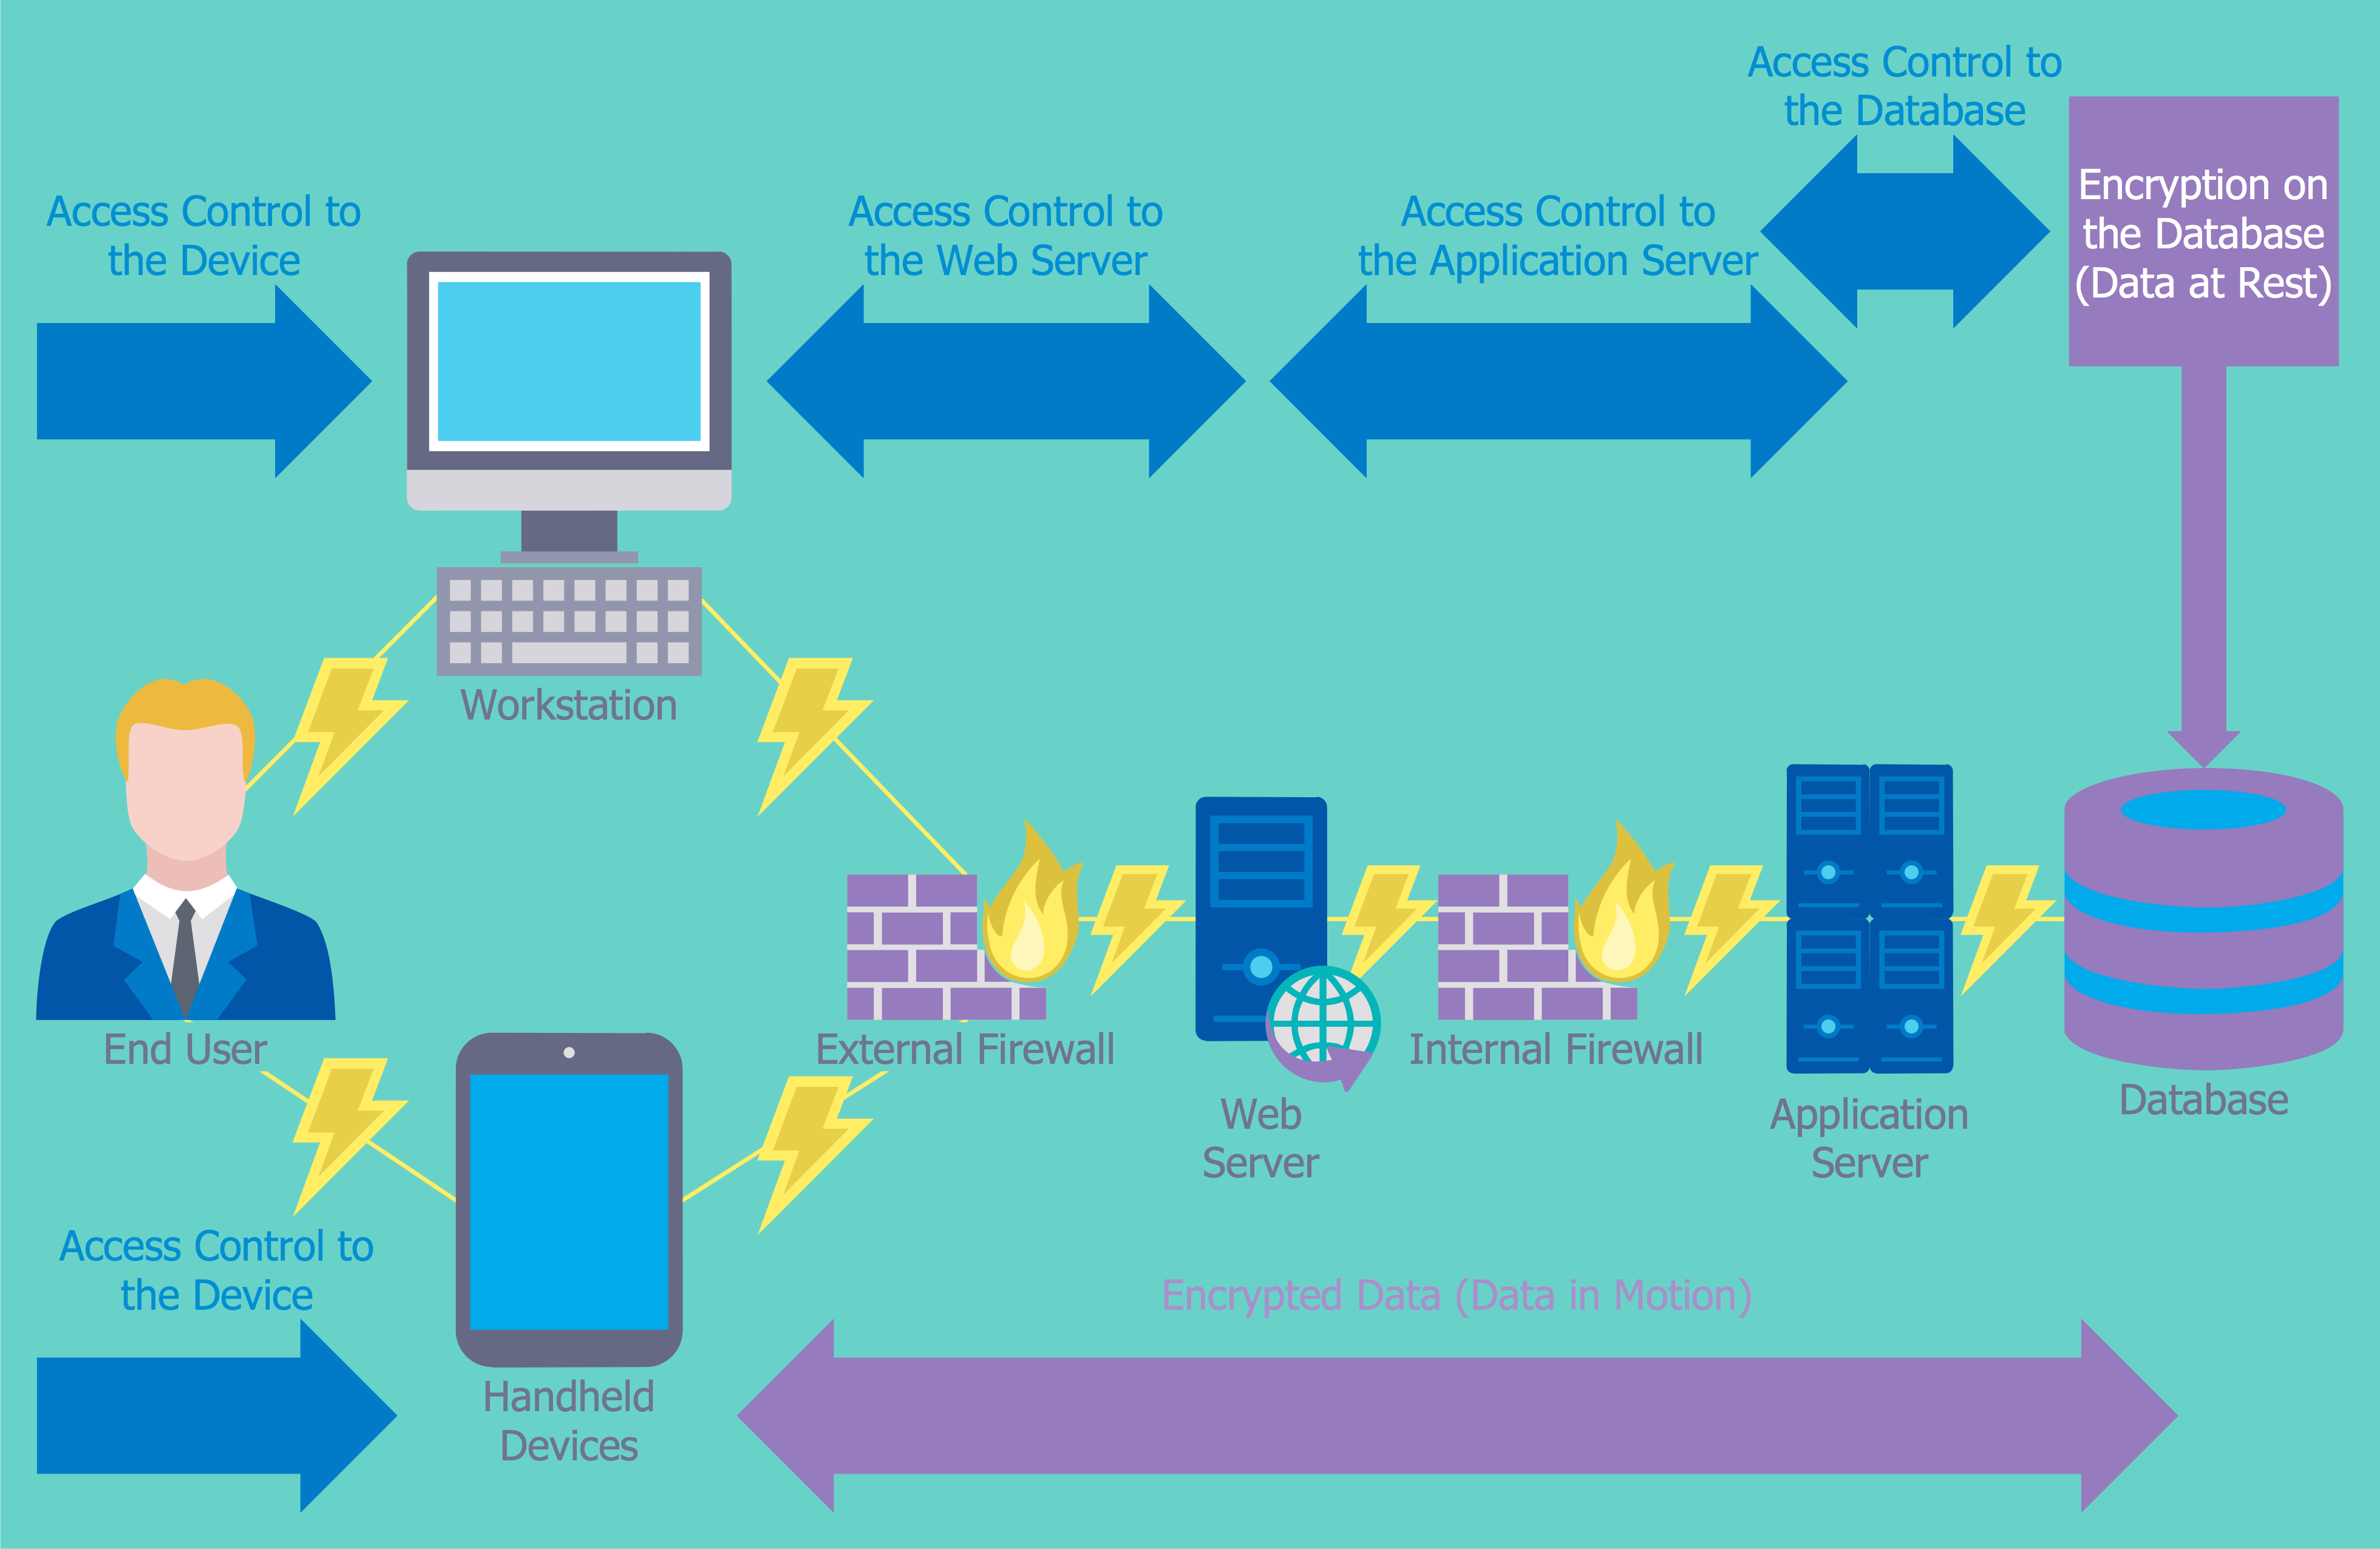
Picture: Network Security Devices
Related Solution:
ConceptDraw DIAGRAM diagramming and vector drawing software extended with Mac OS User Interface Solution from the Software Development area is a powerful Mac OS GUI Software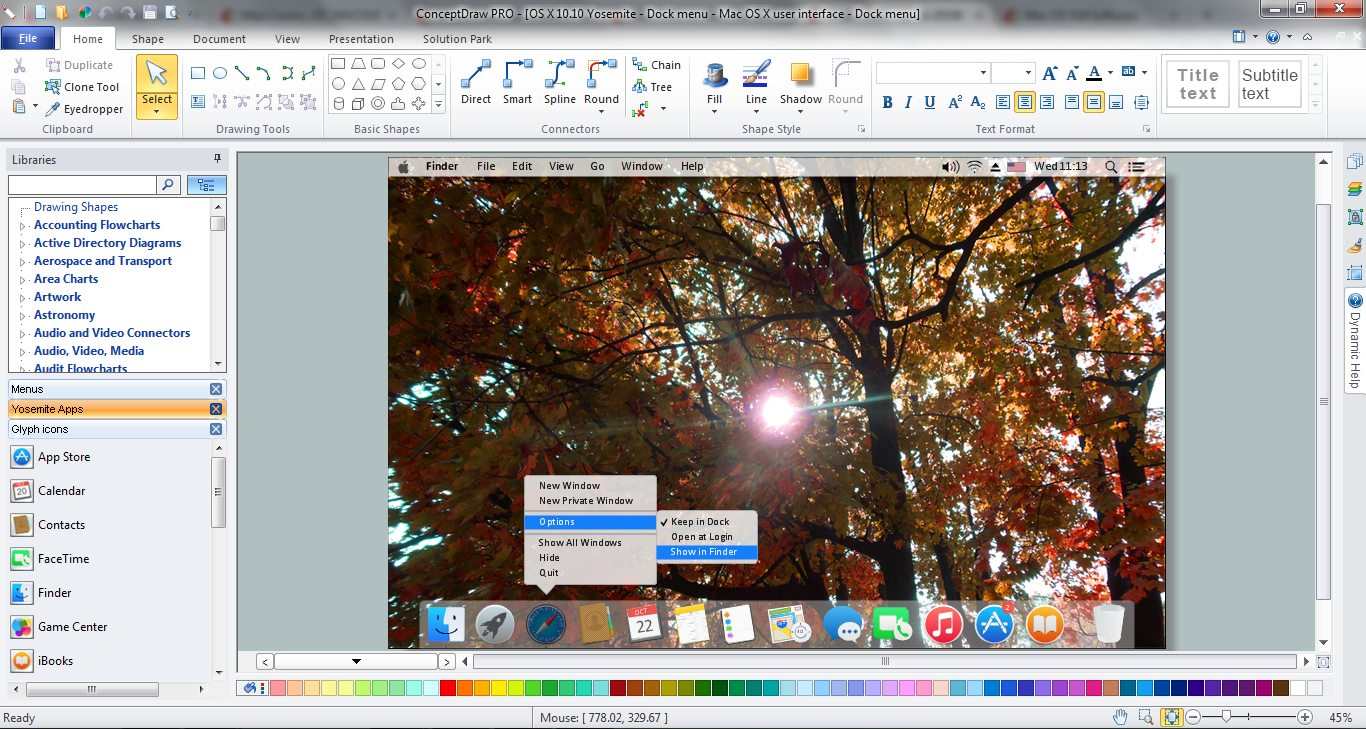
Picture: Mac OS GUI Software
Related Solution:
Make diagrams, charts, workflows, flowcharts, org charts, project charts easily with ConceptDraw software.
Picture: Best Program to Make Diagrams
Related Solution:

