Flowchart Software
Flowcharts visualize a process or algorithm of program as step/operation blocks of various shapes connected with arrowed lines showing the process flow direction. They are often used to visualize business and technical processes as well as software algorithms.
ConceptDraw DIAGRAM
ConceptDraw DIAGRAM enhanced with Flowcharts Solution from the "Diagrams" Area of ConceptDraw Solution is a easy flowchart program for drawing flow chart example illustrating the essence and importance of the technical flow chart use. This is classic flowchart maker, it follows the industry standards providing sets of flowchart symbols geathered by our team during a ten years into useful tool ConceptDraw Solution Park.

Example 1. FlowChart solution
ConceptDraw DIAGRAM is a Mac OS X and Windows software. Numerous vector stencils, samples and templates created by designers are included in the basic package. This software especially developed to simplify drawing any type of flowcharts. Flowcharts give users the ability to represent structural data visually.

Example 2. Flow chart sample: Invoice payment
This flow chart example visualizes payment process.
The base flowchart solution for ConceptDraw DIAGRAM has a large library of all common flowcharting symbols.

Example 3. Flowchart Software
Use flowchart maker of ConceptDraw DIAGRAM diagramming and business graphics software to draw your own business process flowcharts.
See also Samples:
TEN RELATED HOW TO's:
If you ever tried programming, you could face a lot of problems as a beginner. To help yourself, create a flowchart to follow an algorithm logic. Flowchart represents a program as a sequence of steps depicted in special symbols for each type of action.
This image of the interactive diagram made in ConceptDraw DIAGRAM applying the Live Objects technology. The diagram shows the effect of Selection Sort algorithm. The left part of the chart is the input area. The diagram in the central part of the drawing is a flow chart showing of the selection sort algorithm. The flowchart includes basic flowchart symbols, that represent various stages of algorithm. The flowchart symbols are connected with arrows ended lines, that depict the direction of the process flow. On the right side — the result is displayed.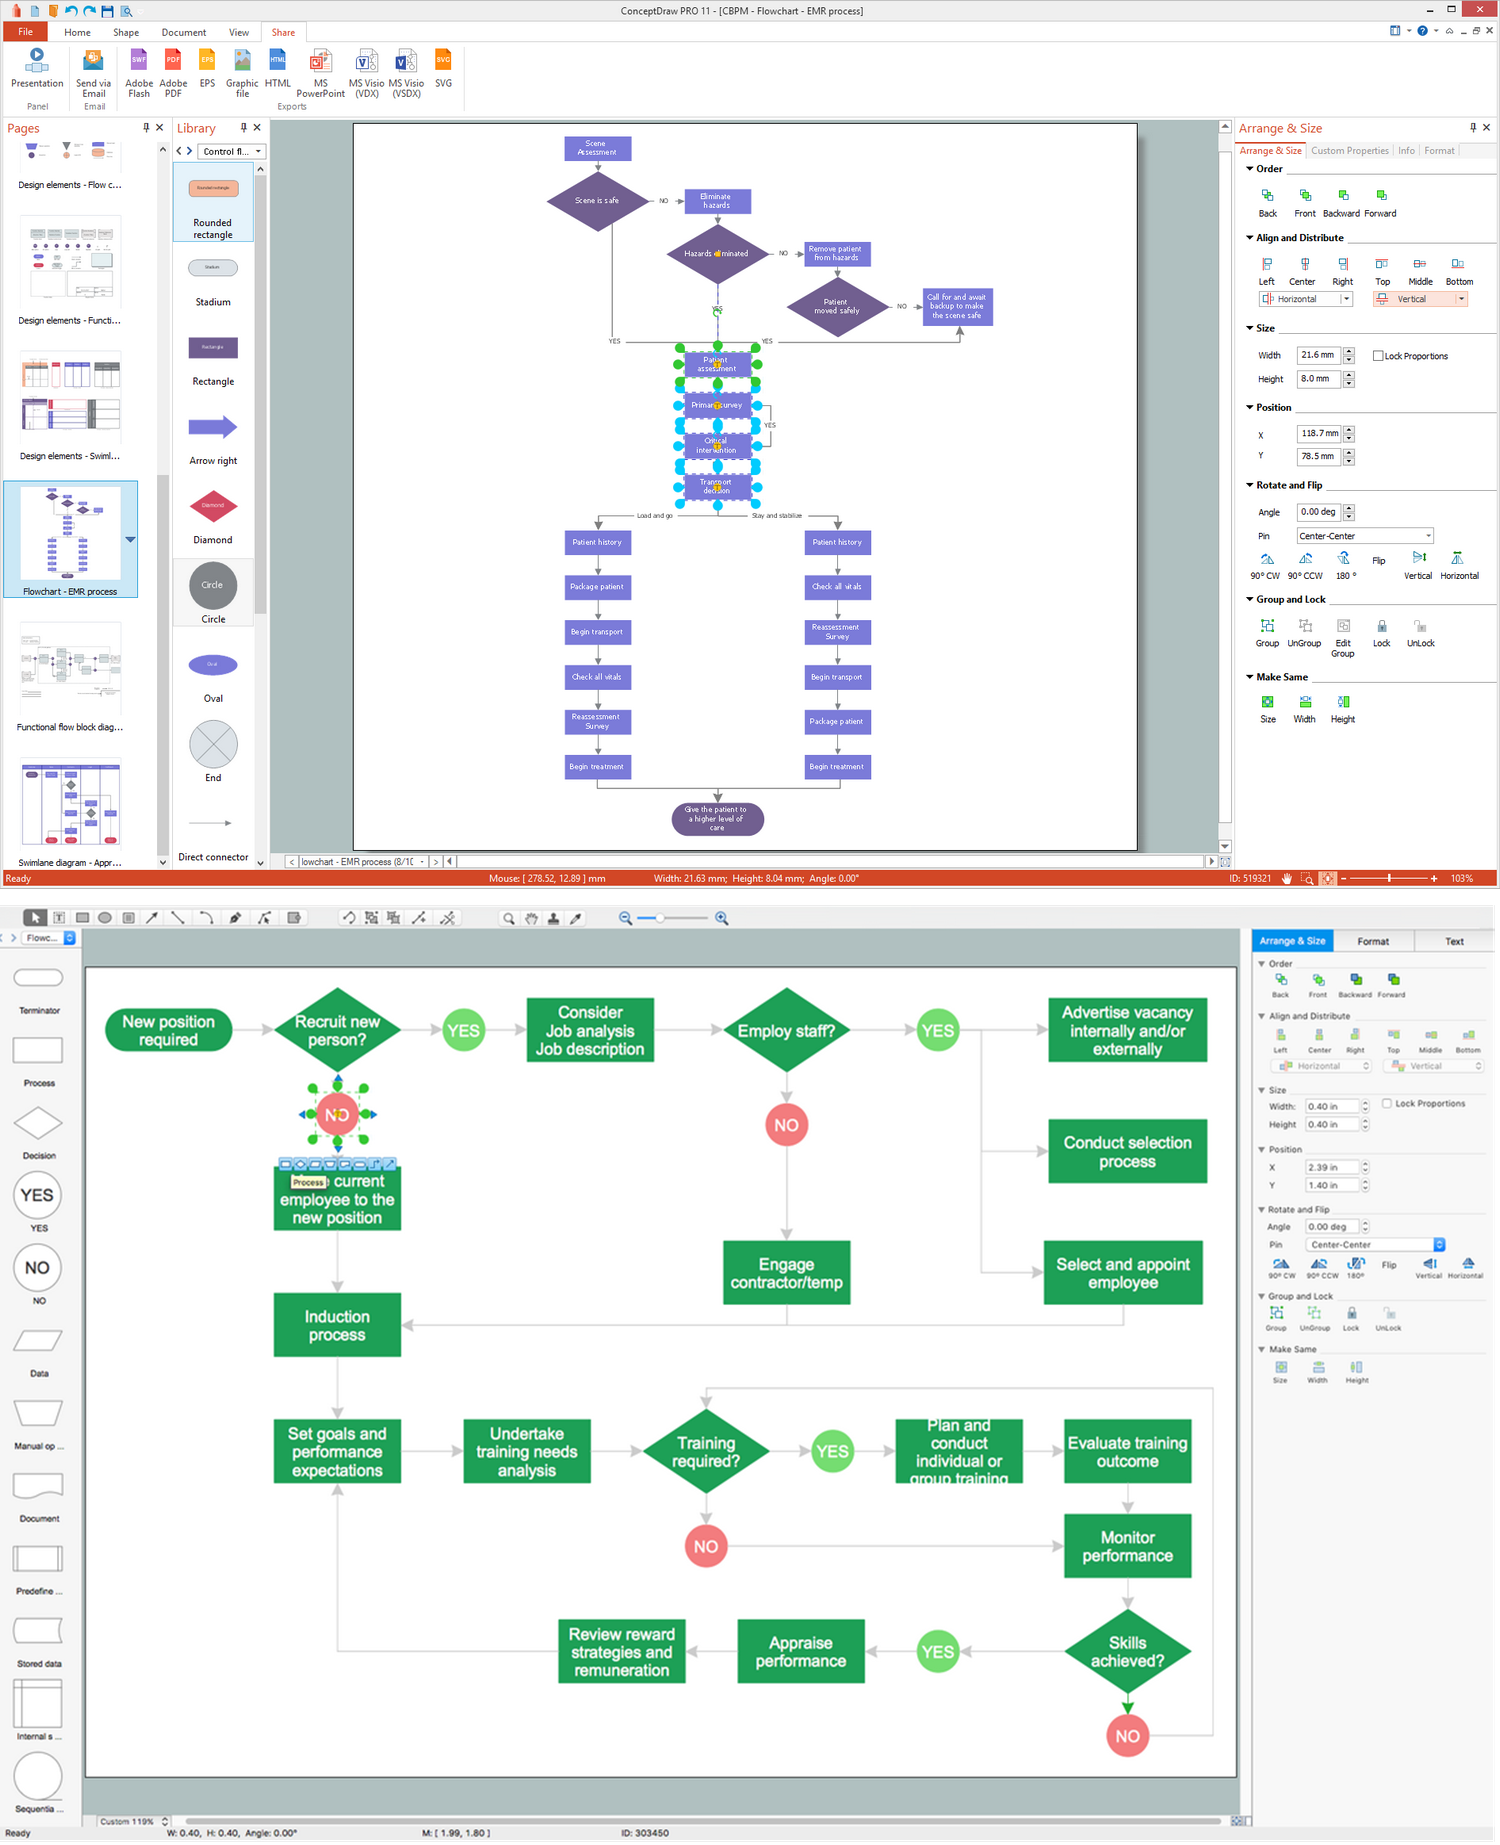
Picture: What Is a Flowchart? Definition, Symbols, Examples and How to Create One
Related Solution:
Gant Chart is a graphical representation of tasks as segments on a time scale. It helps plan and monitor project development or resource allocation. The horizontal axis is a time scale, expressed either in absolute or relative time.
Picture: Gant Chart in Project Management
Related Solution:
Don't let your first glance fool you. ConceptDraw is a lot easier to use than it looks. Use its cross-functional templates and library as basics to get started.
All you need to know are a few basic steps and terms.
ConceptDraw Arrows10 Technology is a new age in drawing software. Use it for process flows and its new rapid draw feature enables to draw an impressive charts in a seconds.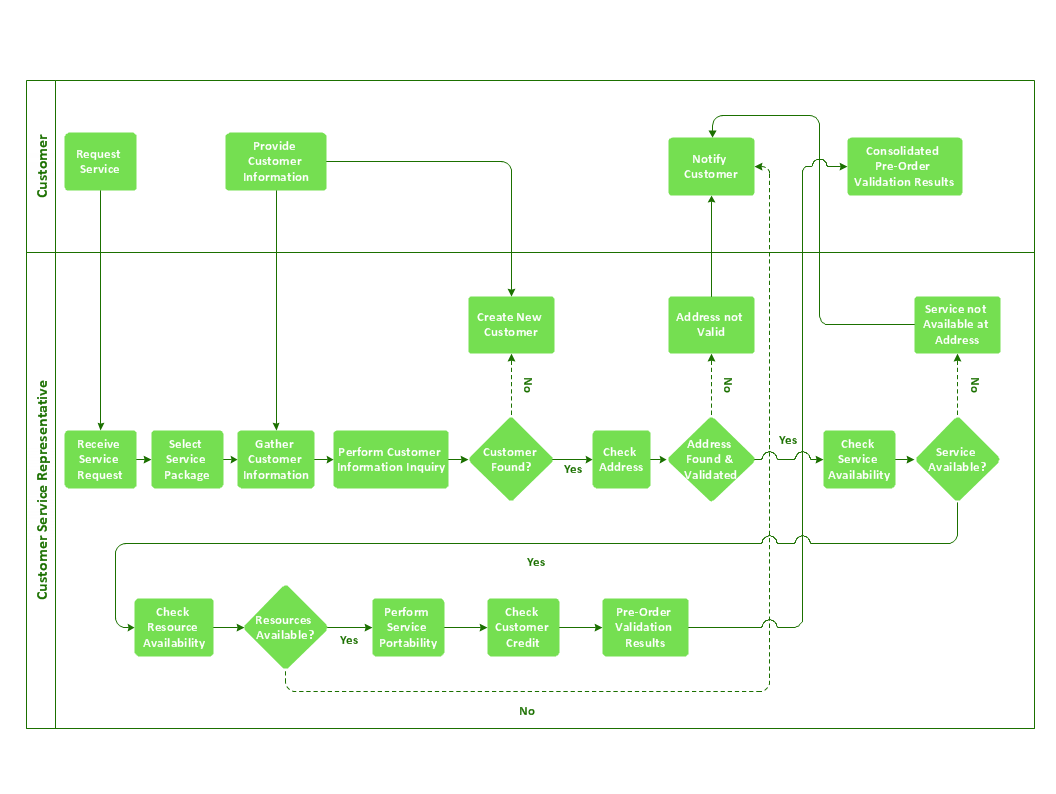
Picture: Cross-Functional Flowchart Basics
Enjoy the flowcharting process with the intuitive interface and powerful tools of the user-friendly ConceptDraw DIAGRAM software: ✔️ represent algorithms, ✔️ break down complex processes, ✔️ display workflows, ✔️ show procedures, ✔️ succeed in decision-making, ✔️ streamline processes, ✔️ increase productivity, ✔️ enhance efficiency
Picture: Flowcharting Software
Related Solution:
The audit process is a definite set of steps used in a financial, operational or compliance audit. This set of steps depends of the audit services company. The auditing process usually includes three main steps: planning, fieldwork and reporting.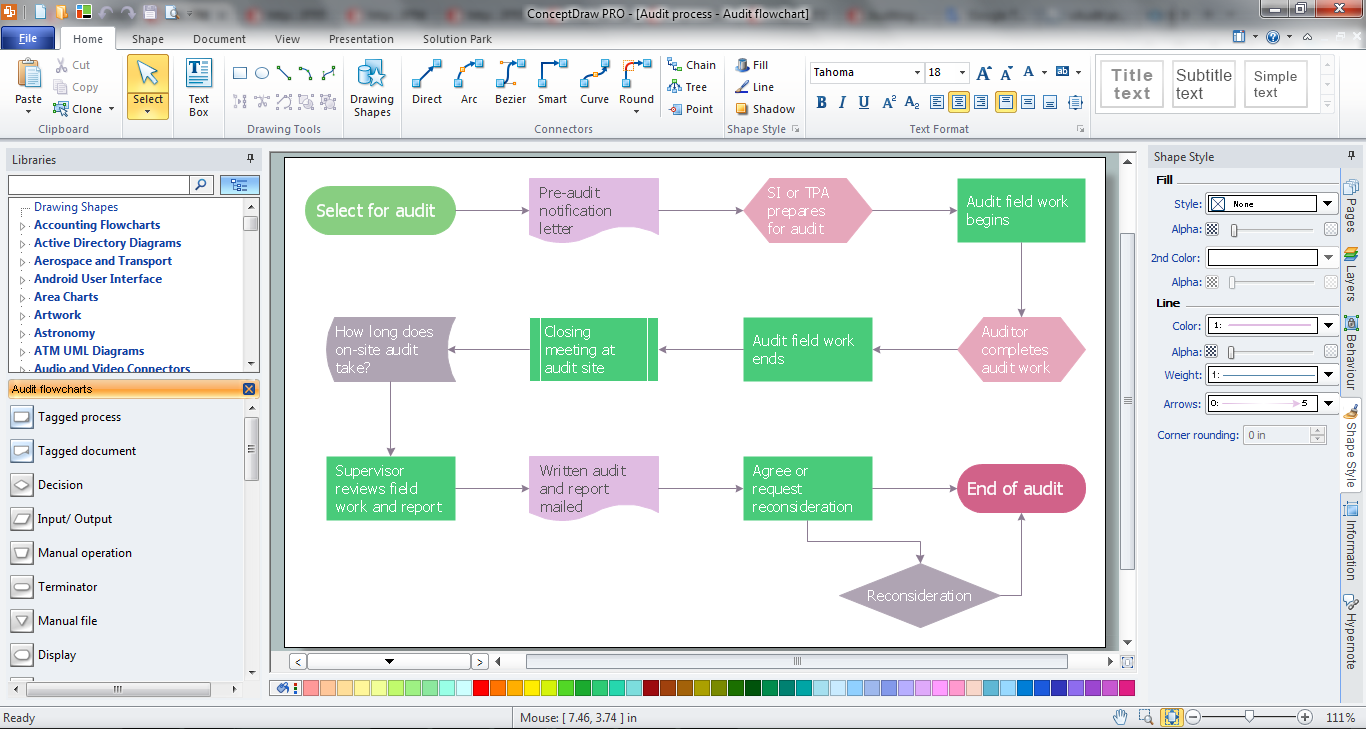
Picture: Audit Process
Related Solution:
In ConceptDraw DIAGRAM it really is sp simple to draw even the most complex cross-functional flowcharts. Use the RapidDraw technology and Cross-Functional libraries in ConceptDraw DIAGRAM for the best results.
Picture: How to Simplify Flow Charting — Cross-functional Flowchart
Related Solution:
The app's user interface is everything what user see and interact with on its electronic device. Great number of touch screen smartphones and tablets now work under the Linux-based Android operating system.
Android UI design is a daunting process which requires certain knowledge, abilities and skills from Android developers and designers. Now it is available the special Android UI design tool - ConceptDraw DIAGRAM diagramming and vector drawing software supplied with Android User Interface Solution from the Software Development Area of ConceptDraw Solution Park.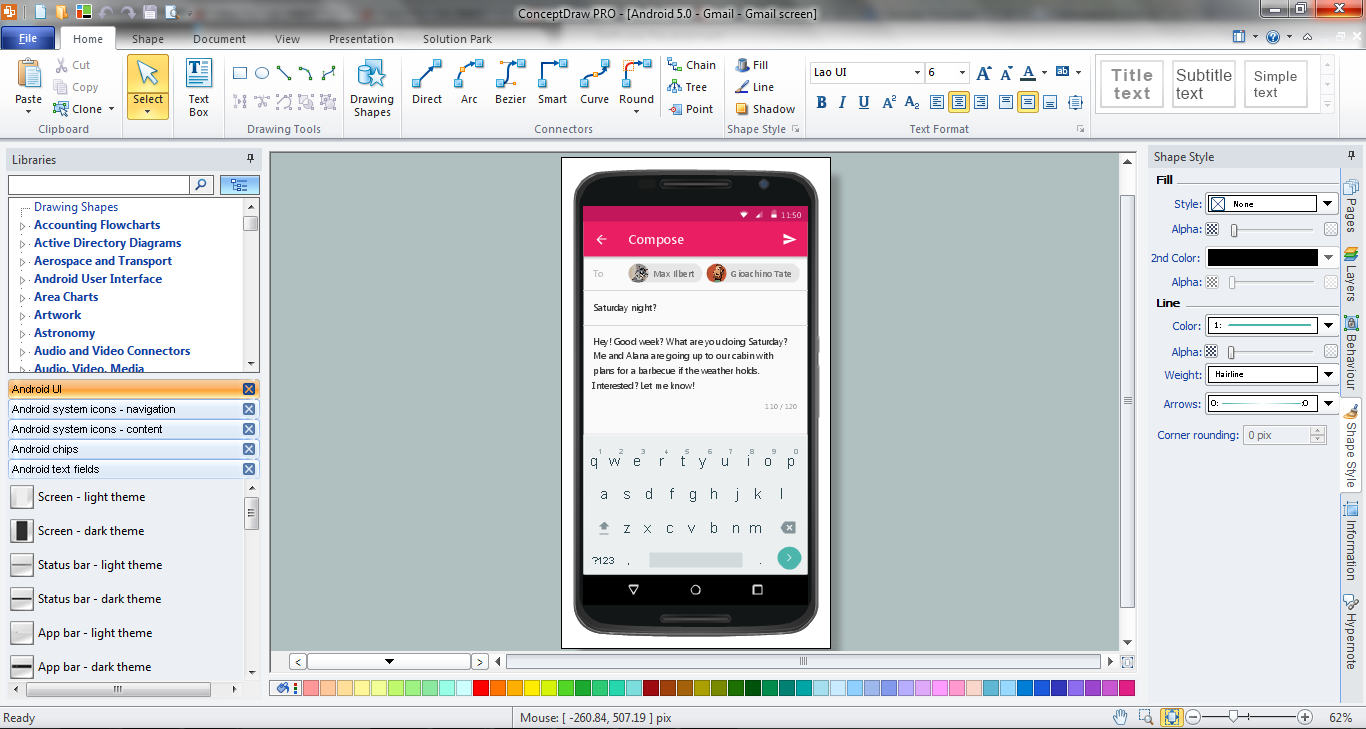
Picture: Android UI Design Tool
Related Solution:
Database model is a graphic representation need at the beginning of project development. You won't have any problems with drawing ER diagrams on a Mac anymore with ConceptDraw DIAGRAM application. Special libraries that contain all the symbols of both Chen's and Crow’s foot notation allow you to start database modeling within a few minutes.
Creating entity-relationship diagrams on Mac is fun and effortless when you use a software designed for professional ERD drawing tailored to specific characteristics of Apple OS X. ConceptDraw DIAGRAM is a business diagramming software for those using OS X.
The Entity-Relationship Diagrams solution for ConceptDraw has 2 libraries containing about 50 vector icons, depicting ERD symbols of the most popular Chen's and Crow’s Foot Notations. The other valuable component of the solution is a collection of ERDs samples and templates that can be opened on Macs and PCs.
Picture: Drawing ER diagrams on a Mac
Related Solution:
ConceptDraw DIAGRAM software is a Simple Flow Chart Maker and the easiest way to make a Flowchart. It allows users to ✔️ streamline the creation and editing of Flowcharts for both internal and external purposes, ✔️ visualize the algorithms, business processes, and tasks, ✔️ clarify complex processes and simplify their understanding by the audience, ✔️ easier detection of bottlenecks, redundancies, delays, and other inefficiencies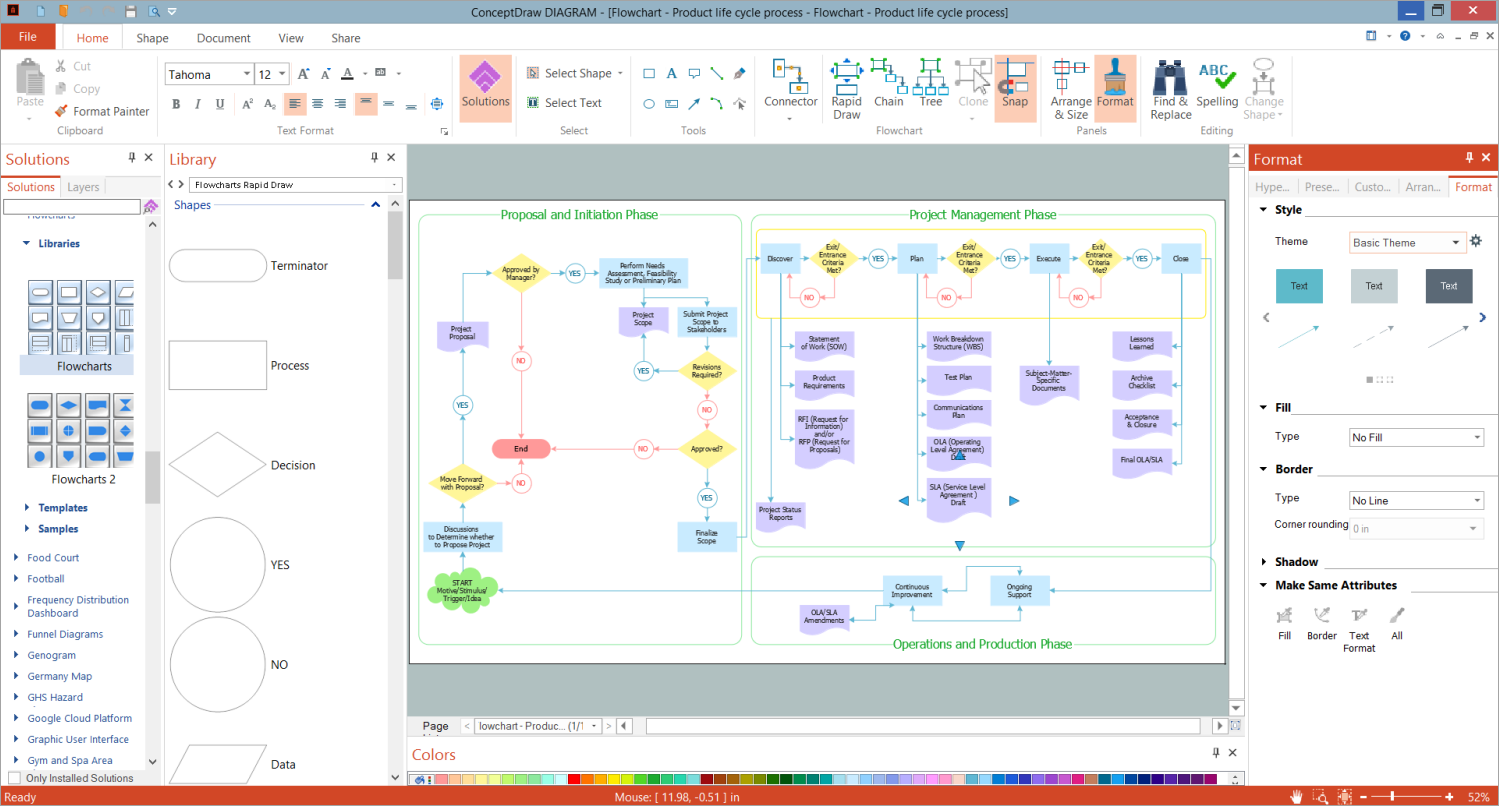
Picture: Simple Flow Chart Maker: A Comprehensive Guide
Related Solution:
Visio Files and ConceptDraw. ConceptDraw DIAGRAM is compatible with MS Visio.VDX formatted files.VDX is Visio’s open XML file format, and it can be easily imported and exported by ConceptDraw DIAGRAM.
Picture: Visio Files and ConceptDraw

