Pyramid Diagram
Three level pyramid model
A three level pyramid model of different types of Information Systems based on the type of decisions taken at different levels in the organization.
The first level represents transaction processing systems focused on operational decisions.
The second level represents management information systems focused on tactical decisions.
The third level represents executive information systems focused on strategic decisions.
This triangle chart example is included in the Pyramid Diagrams solution from Marketing area of ConceptDraw Solution Park.

Example 1. Pyramid Diagrams Solution
This diagram was redesigned using ConceptDraw DIAGRAM diagramming and vector drawing software from Wikimedia Commons.
[commons.wikimedia.org/wiki/File:Three-Level-Pyramid-model.png]

Example 2. Pyramid Diagram. 3 level pyramid model of information systems types
This diagram was redesigned using ConceptDraw DIAGRAM diagramming and vector drawing software from Wikimedia Commons.
[commons.wikimedia.org/wiki/File:Three-Level-Pyramid-model.png]
See more Pyramid Diagram:
TEN RELATED HOW TO's:
A Flow Map is a type of thinking maps, which help organize and understand information easily. Use ConceptDraw DIAGRAM software to ✔️ create a Flow Map of any degree of complexity in a few minutes, ✔️ display the interrelated information, ✔️ structure information sequentially or chronologically, ✔️ represent manufacturing or engineering processes
Picture: Flow Map: A Step-by-Step Guide
Related Solution:
There are plenty of diagramming tools, the question is to choose the most suitable for your needs. For example, you can choose ConceptDraw DIAGRAM as organizational chart software and get fascinating results in a few minutes. An orgchart is useful for any corporation.
This is an example of a hierarchical organization scheme of the company. It has tree-like structure. Each middle manager is subordinated to a few employees, and he is accountable to one of the top managers. Every type of organizational composition of businesses may be presented in the view of an organizational chart that is supported by ConceptDraw Organisational Charts solution. There are number of ways of building a structure of business organization, establishing how it should function.
Picture: ConceptDraw DIAGRAM - Organizational chart software
Related Solution:
Electrical plan is a document that is developed during the first stage of the building design. This scheme is composed of conventional images or symbols of components that operate by means of electric energy. To simplify the creation of these schemes you can use house electrical plan software, which will not require a long additional training to understand how to use it. You only need to install the necessary software ant it’s libraries and you’ll have one less problem during the building projection.
Any building contains a number of electrical systems, including switches, fixtures, outlets and other lightening equipment. All these should be depicted in a building electrical plans and included to general building documentation. This home electrical plan displays electrical and telecommunication devices placed to a home floor plan. On the plan, each electrical device is referenced with the proper symbol. Electrical symbols are used for universal recognition of the building plan by different persons who will be working on the construction. Not all possible electric symbols used on a certain plan, so the symbols used in the current home plan are included to a legend. The electrical home plan may be added as a separate document to a complete set of building plans.
Picture: How To use House Electrical Plan Software
Related Solution:
This sample was created in ConceptDraw DIAGRAM diagramming and vector drawing software using the Computer and Networks solution from Computer and Networks area of ConceptDraw Solution Park.
This sample shows the Hierarchical network topology.
A Hierarchical network topology interconnects multiple groups that are located on the separate layers to form a larger network. Each layer concentrates on the specified functions, this allows to choose the right equipment for the layer.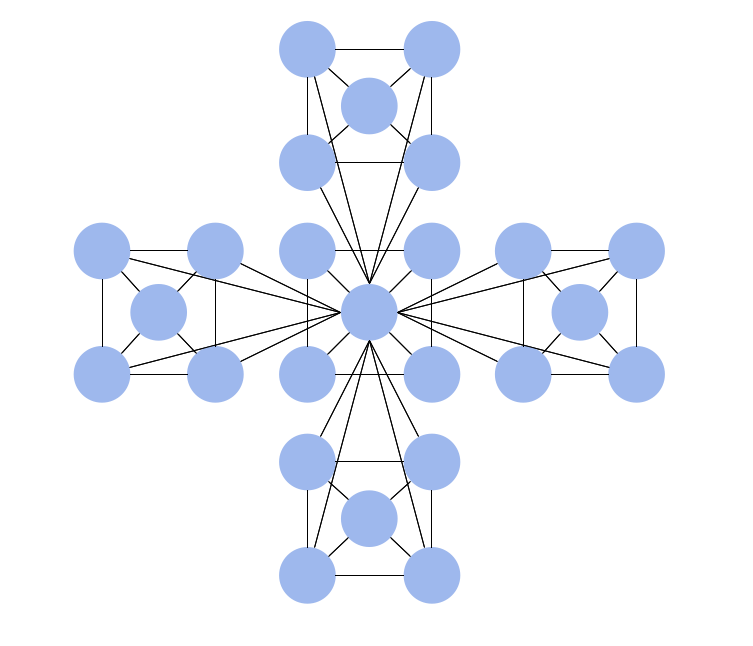
Picture: Hierarchical Network Topology
Related Solution:
Wiring and circuit diagrams use special symbols recognized by everyone who uses the drawings. The symbols on the drawings show how components like resistors, capacitors, inductors, switches, lamps, acoustic devices, measuring devices and other electrical and electronic components are connected together.
26 libraries of the Electrical Engineering Solution of ConceptDraw DIAGRAM make your electrical diagramming simple, efficient, and effective. You can simply and quickly drop the ready-to-use objects from libraries into your document to create the electrical diagram.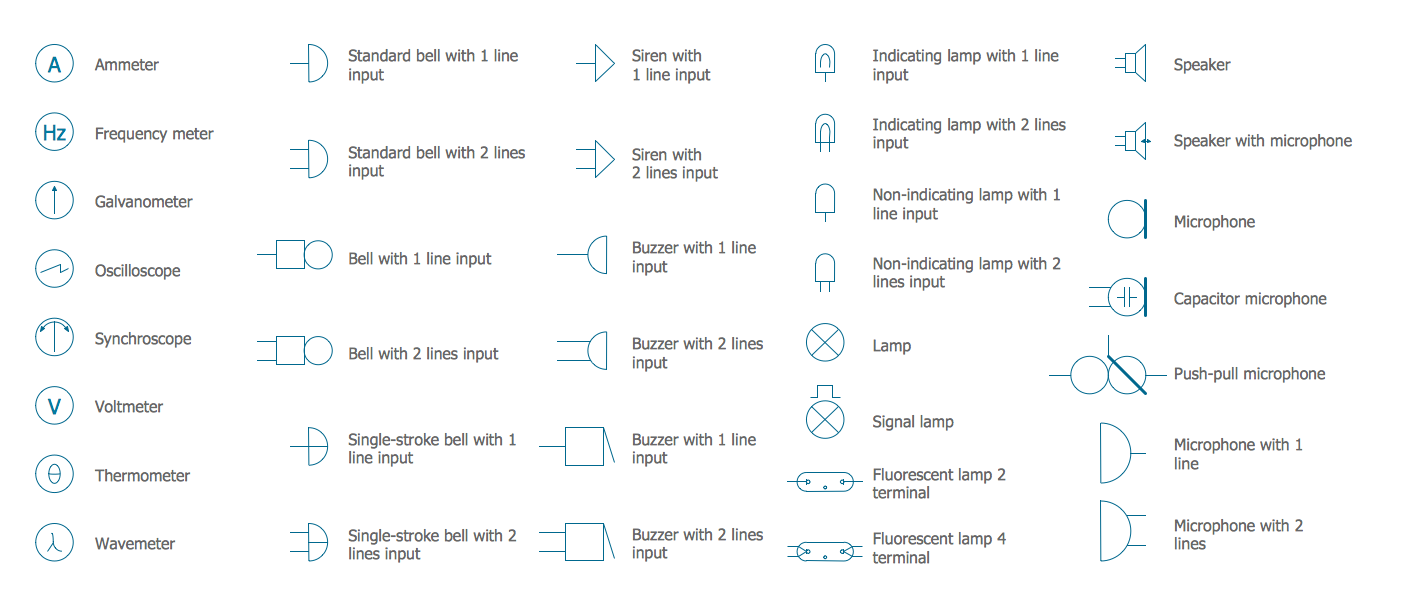
Picture: Electrical Symbols — Lamps, Acoustics, Readouts
Related Solution:
This sample was created in ConceptDraw DIAGRAM diagramming and vector drawing software using the Flowcharts solution from the Diagrams area of ConceptDraw Solution Park.
This sample shows the Flowchart of the Subprime Mortgage Crisis. This Flowchart describes the decline in housing prices when the housing bubble burst and what it caused on the housing and financial markets. You can also see the Government and Industry responses in this crisis situation.
Picture: Flowchart on Bank. Flowchart Examples
Related Solution:
Competitor analysis is a first and obligatory step in elaboration the proper corporate marketing strategy and creating sustainable competitive advantage. Use powerful opportunities of numerous solutions from ConceptDraw Solution Park for designing illustrative diagrams, charts, matrices which are necessary for effective competitor analysis.
Picture: Competitor Analysis
Related Solution:
A waterfall model describes software development process as a sequence of phases that flow downwards. SSADM is one of the implementations of waterfall method. It’s easier to learn about structured systems analysis and design method (SSADM) with ConceptDraw DIAGRAM because this software has appropriate tools for creating data flow diagrams. You can use all the three main techniques of SSADM method with special tools and predesigned templates.
This data flow diagram illustrates the Structured Systems Analysis and Design Method. This method method considers analysis, projecting and documenting of information systems. Data flow models are the most important elements of SSADM and data flow diagrams are usually used for their description. It includes the analysis and description of a system as well as visualization of possible issues.
Picture: Structured Systems Analysis and Design Method. SSADM with ConceptDraw DIAGRAM
Related Solution:
Bureaucratic companies usually are characterized by a strict hierarchy and clearly defined responsibilities. However, sometimes organizational structure of a company reminds of somewhat tangled. To clarify it, you can create an orgchart that will represent the company as a tree with its' departments as branches.
This organization diagram represents a tree-like organizational structure. This is a typical example of a top-level branches of the hierarchical organizational structure. This part of the tree shows heads of branches who are subordinated completely to the president. The information and solutions are distributed though a tree structure down to the company's departments. Each of the sub-division has its own structure that is reflected in the corresponding organizational chart. This orgchart diagram was created using the vector graphic library supplied with ConceptDraw Organizational Charts solution.
Picture: Organizational Structure
Related Solution:
When creating ER diagrams, you can apply different color ER diagram styles and also notation styles. ConceptDraw DIAGRAM enhanced with Entity-Relationship Diagram (ERD) Solution gives the ability to draw visual and attractive ER Diagrams using the style icons from Crow’s Foot notation and Chen's notation professionally designed and offered by ERD Chen's Notation and ERD Crow’s Foot Notation libraries.
Picture: ER Diagram Styles
Related Solution:
