Flow Chart Online
A good Flowchart is incredibly helpful for representing and understanding the system and the systematic flow of information in the system. That's why its creation requires attention, accuracy, caution, and expertise. Having a completed Flowchart, you can identify time lags and non-value-adding steps, responsibility for each step, brainstorm for problems in the process, determine major and minor inputs into the process with a Cause & Effect diagram, choose the most likely trouble spots with the consensus builder, etc. Use your Flowcharts in spheres of activity such as business, engineering, architecture, science, manufacturing, administration, government, etc.
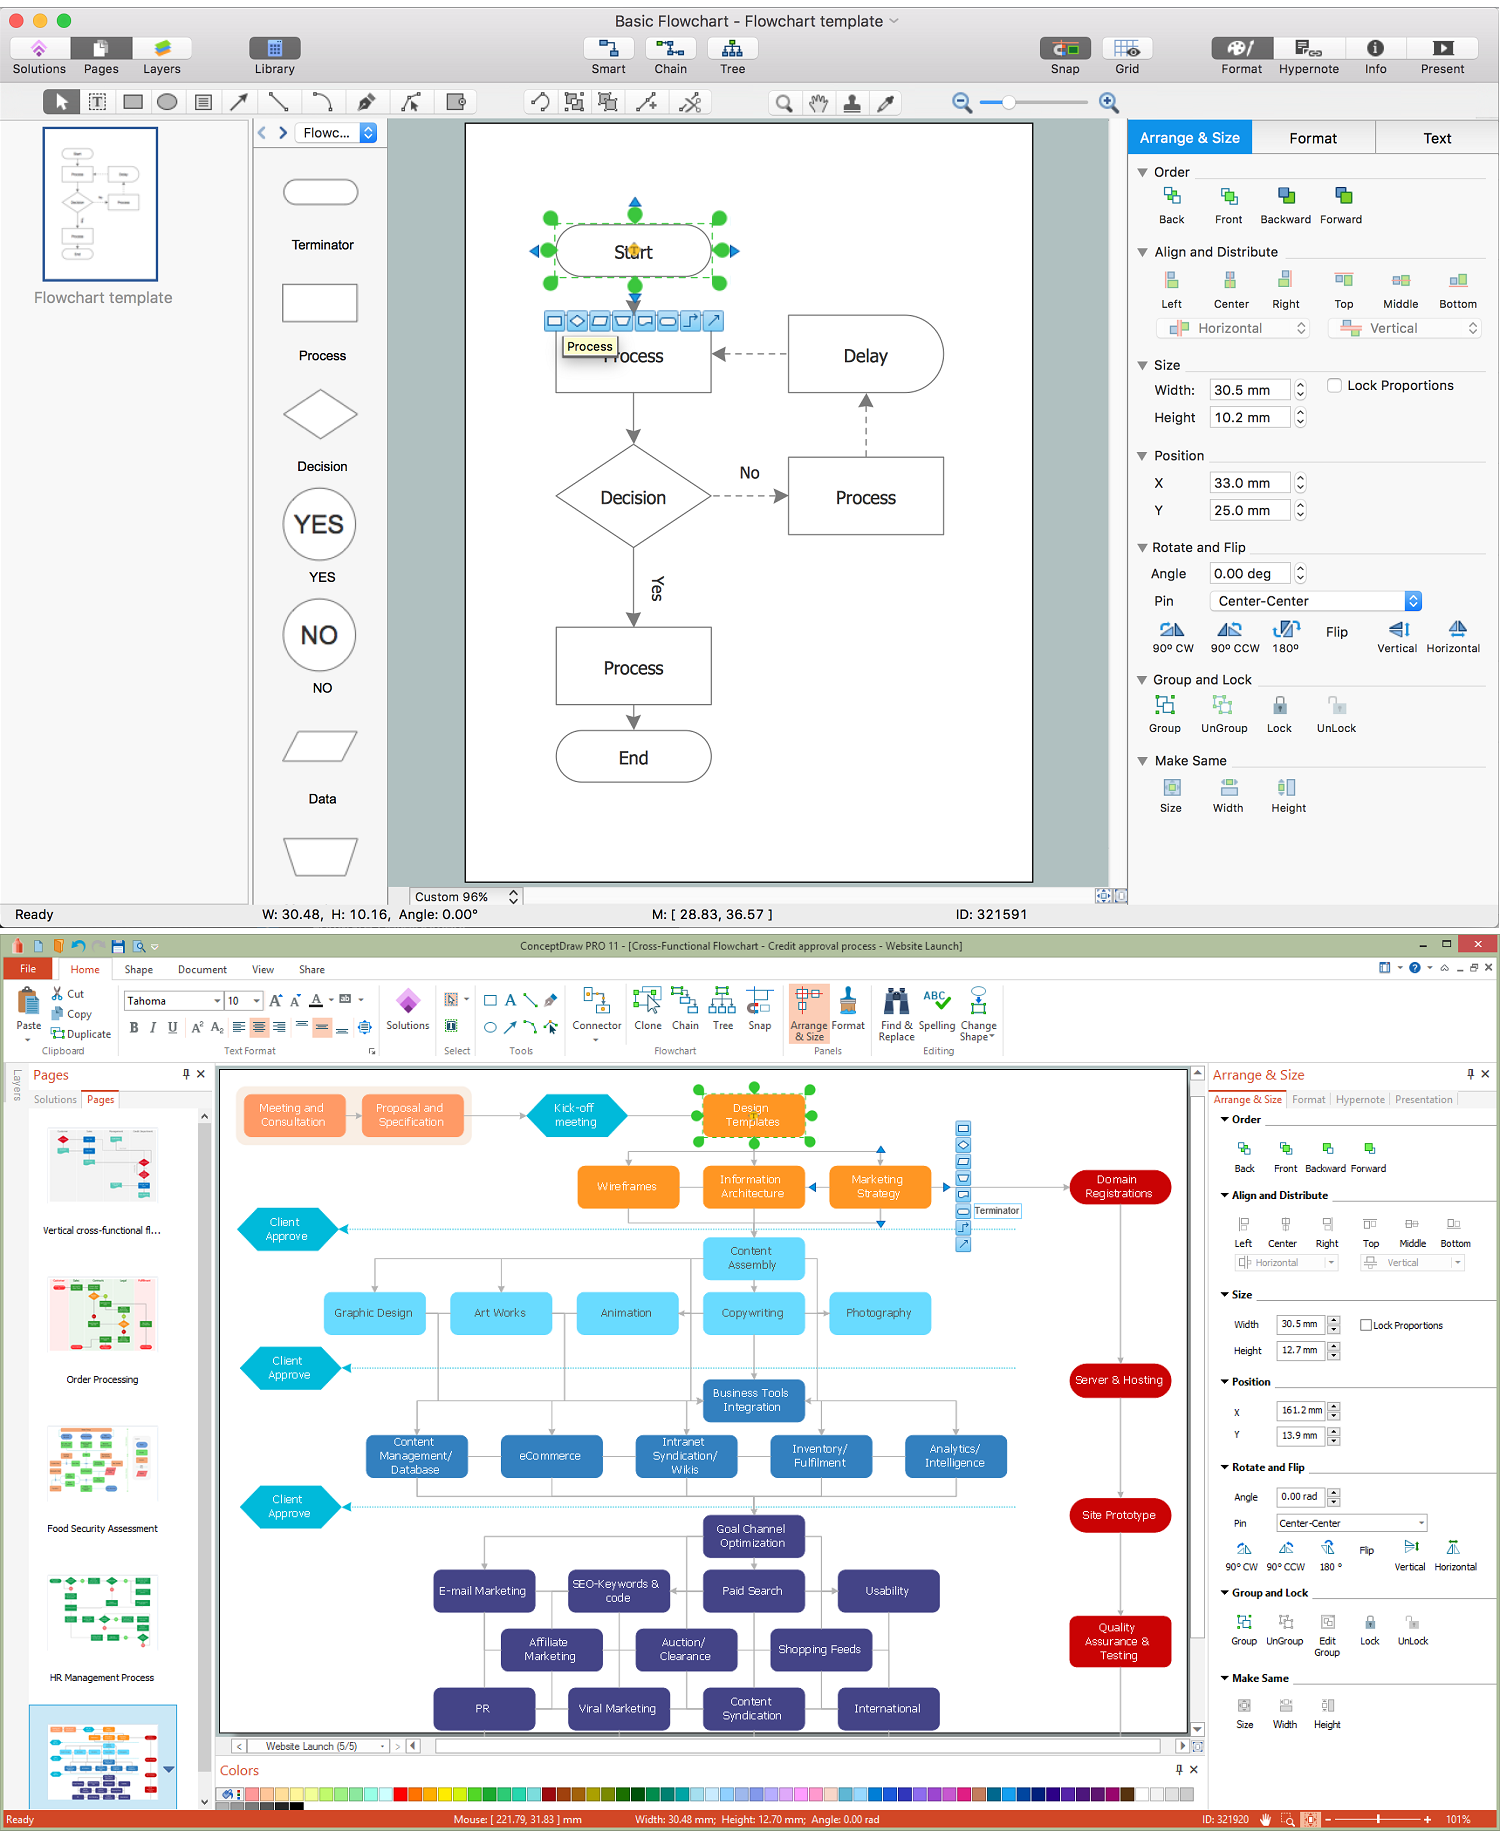
There are many standardized symbols that can be used in Flowcharts to represent different kinds of steps. The basic flowchart's element is a simple action, which is represented as a box containing a description of the action. The flow is shown with arrows between sequential action boxes. The decision is displayed as a diamond that contains a simple question to which the answer is 'yes' or 'no'. Any Flowchart should be started and ended with the terminator symbol. Use the decision symbol to ask a question. The process symbol is usually used for activities or action steps. Finally, connect the Flowchart elements with the arrow connectors. A circle symbol containing a letter or number means that this chart connects to another chart on a different page.
Flowchart Benefits
Flow Chart is a great visualization tool for the flow of a process, algorithm, or procedure, which has a lot of benefits:
- offers a common understanding of processes;
- gives a clear documentation of a process;
- allows identification of the scope of the process;
- allows tracing and analyzing the process steps;
- helps to build a process visual representation for analysis, discussion, and communication;
- helps to standardize and find areas for monitoring, improvement, and increased efficiency in a process;
- allows to find and detach the steps of the process that are not essential;
- helps in understanding the logic of complex problems;
- offers guidance for managers overseeing operations;
- helps programmers to write programs of any complexity and in any high-level language;
- helps in debugging process and provides efficient program maintenance;
- facilitates communication between programmers and business people;
- helps to understand and explain to other people the logic of complex problems and their solutions;
- assists in improving teamwork effectiveness.

Example 1. How to Make a Flowchart Online — Website Launch
Best Practices for Designing Flow Charts
It is convenient to use powerful software for creating Flow charts. Currently, we have the best flow chart diagram online design software — ConceptDraw DIAGRAM enhanced with Flowcharts Solution from the Diagrams area of ConceptDraw Solution Park.
ConceptDraw DIAGRAM with Flowcharts solution is so powerful flow chart maker online thanks to a wide set of included tools and services. To create the flow charts online, use primarily the ConceptDraw STORE which is an excellent tool for navigation through ConceptDraw Solution Park. It gives access to the libraries, templates, and samples, and also lets to manage downloads and updates. The best flowchart maker uses the Flowcharts solution of ConceptDraw Solution Park.
Flowcharts solution provides 2 libraries with numerous ready-to-use vector objects, a collection of predesigned flow chart diagrams examples and samples, and the perfect base for easy flowcharting — a basic flow chart template. Use the basic flow chart template for easy drawing flowchart, business process flow chart, online flow chart, data flow chart diagram, and many other types of Flowchart diagrams. All samples and template are available from the Flowcharts section in ConceptDraw STORE.
Benefits of Using Flowchart Maker ConceptDraw DIAGRAM
The following features make ConceptDraw DIAGRAM the best flow diagrams online design software:
- You don't need to be an artist to draw professional-looking diagrams in a few minutes.
- Large quantity of ready-to-use vector objects makes your drawing diagrams quick and easy.
- Great number of predesigned templates and samples gives you a good start for your own Flowcharts.
- ConceptDraw DIAGRAM provides you the possibility to use the grid, rules, and guides. You can easily rotate, group, align, and arrange the objects, use different fonts and colors to make your diagram exceptionally looking.
- All ConceptDraw DIAGRAM documents are vector graphic files available for reviewing, modifying, and converting to a variety of formats: image, HTML, PDF file, MS PowerPoint Presentation, Adobe Flash, MS Visio.
- Using ConceptDraw STORE you can navigate through ConceptDraw Solution Park, manage downloads and updates. You can access libraries, templates, and samples directly from the ConceptDraw STORE.
- If you have any questions, our free-of-charge support is always ready to come to your aid.

Example 2. Create Flow Charts Online — ConceptDraw STORE
Using Flowcharts in Decision-Making Processes
Among other useful functions, Flowcharts aid in decision-making and clarifying complex decisions. They simplify the process of organisation different elements, options, conditions, and potential outcomes into a logical visual sequence, clarifying the relationships between the steps and other components. Flowcharts turn abstract decisions into concrete visual representations, which simplify understanding the entire situation at a glance. The clear structure of a Flowchart improves efficiency and enables quicker decision-making. It is a perfect documentation, reporting, and presentation base.
Flowcharts help to identify risks, potential bottlenecks, and unforeseen consequences before making a final decision in situations with conditional choices. They highlight problem areas that may require further analysis, as well as facilitate understanding of processes and simplify communication and collaboration by offering clear representation. Moreover, Flowcharts ensure consistency in decision-making, help to standardize the decision-making approach and reduce errors and bias. They also help to understand the reasoning behind choices, visualize and evaluate potential risks, assist in risk management improvement and help to avoid costly mistakes.

Example 3. ConceptDraw DIAGRAM — Flow Chart Online Diagram Maker
Current Opportunities and Trends in Flowcharting
Flowcharting has been a popular way of visualizing processes and decision-making for decades. With the development of new technologies and under the impact of new trends and innovations, some types of Flowcharts slightly changed. The list of their applications also becomes more and more wider, but the key principles stay unchangeable. Some new transformations are also expected in the future, influenced by machine learning, automation, artificial intelligence, and other modern technologies, however, making your flowcharting even more convenient, easy, and always actual.
The professional tools help to create the Flowcharts faster and more accurately. Currently, powerful drawing tools like ConceptDraw DIAGRAM flowchart designer online help to simplify the flowcharting process. With the rising trend for remote work and cross-functional teams, useful collaborative tools have also become essential. ConceptDraw DIAGRAM software provides extensive export tools, the possibility of sharing Flowcharts directly from the program, creating visual PowerPoint presentations, etc.
ConceptDraw DIAGRAM is available for both Mac and Windows platforms. This gives additional flexibility in creating and updating your Flowcharts. Integrating flowcharting tools with other applications, exporting in a variety of graphical formats, pre-designed elements, and quick-start templates facilitate flowcharting in ConceptDraw DIAGRAM software. The listed tools streamline team workflows, their collaboration and cooperation, and make decision-making processes faster and more efficient.

Example 4. Flow Chart — Selection Sorting Method
Examples and Templates
ConceptDraw DIAGRAM software and Flowcharts solution offer many kinds of examples and templates for making a Flowchart of any needed type, including:
- Basic Flowchart which is often used for defining and documenting basic work and data flows, financial, production, and quality management processes in order to increase the efficiency of your business;
- Business Process Modeling Diagram which is a graphical representation for specifying business processes in a workflow;
- Process Flowchart (also known as the System flow diagram or SFD) which can show the relations between major parts of the system, and more others.
Conclusion
The future of flowcharting is bright and full of potential. Flowcharts enhance understanding of complex systems and processes and make decision-making and training more engaging, simple, and interactive. They enhance creativity and productivity across industries and streamline workflows. More accurate and actionable insights enable to adjust workflows and strategies based on up-to-date information. Creating multiple versions of the same Flowchart provides deeper insights into processes and allows choosing the best one.
As technological innovations continue to shape the way we work, flowcharting tools are enhanced and become more intuitive, interactive, and integrated with other business applications. By selecting the right software, such as ConceptDraw DIAGRAM online flowchart builder, anyone can start creating clear and actionable Flowcharts, which are able to improve decision-making and problem-solving in various scenarios. ConceptDraw DIAGRAM can make your final result after drawing truly unique, looking smart and professional for just a couple of minutes.