Create Process Flowcharts
What is a Process Flowchart?
A process flowchart is a picture of the separate steps of a process in sequential order.
When to Use a Flowchart:
- Analyzing complex processes
- Designing complex processes
- Communication in Complex processes
- Managing complex processes
- Representing process operations
- Plan the process steps
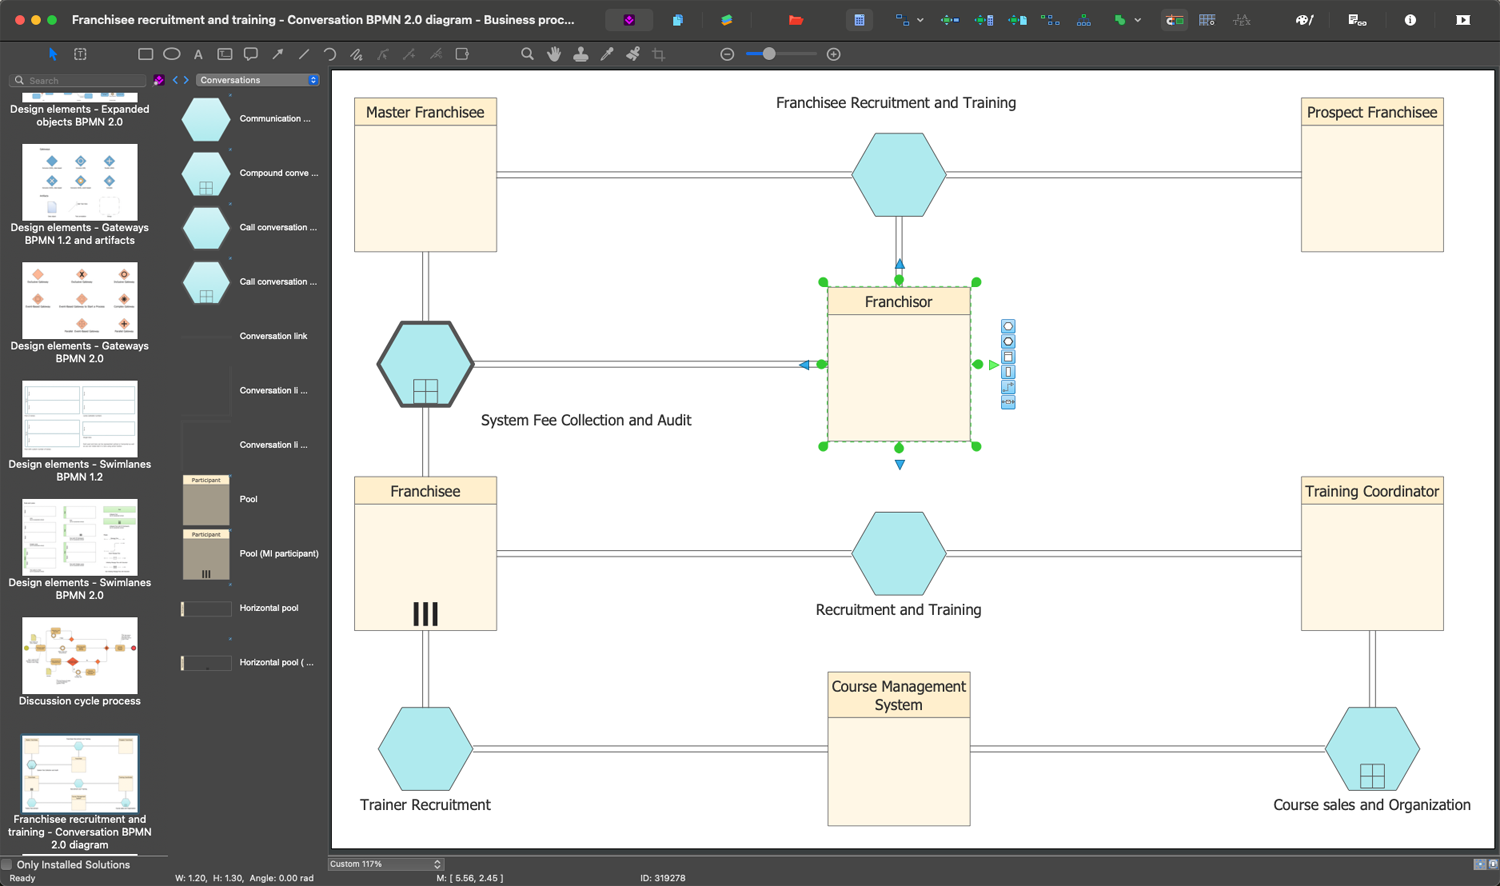
Use ConceptDraw DIAGRAM
ConceptDraw DIAGRAM is Process Flowcharts creating software. The built-in examples allow users to start drawing any type of flowchart simply. The vector stencils from object libraries are designed objects you can use adding to process flowcharts for the best result.
Commonly Used Symbols in Detailed Process Flowcharts:
| Symbol | Shape Name | Symbol Description |
| Common Symbols | ||
 |
Process | Show a Process or action step. This is the most common symbol in both process flowcharts and business process maps |
 |
Flow Line (Arrow, Connector) | Flow line connectors show the direction that the process flows |
 |
Decision | Indicates a question or branch in the process flow. Typically, a Decision flowchart shape is used when there are 2 options (Yes/No, No/No-Go, etc.) |
 |
Connector (Inspection) | In process maps, this symbol is full sized and shows an Inspection point in the process flow |
 |
Document | Pretty self explanatory - the Document flowchart symbol is for a process step that produces a document |
 |
Delay | The Delay flowchart symbol depicts any waiting period that is part of a process. Delay shapes are common in process mapping |
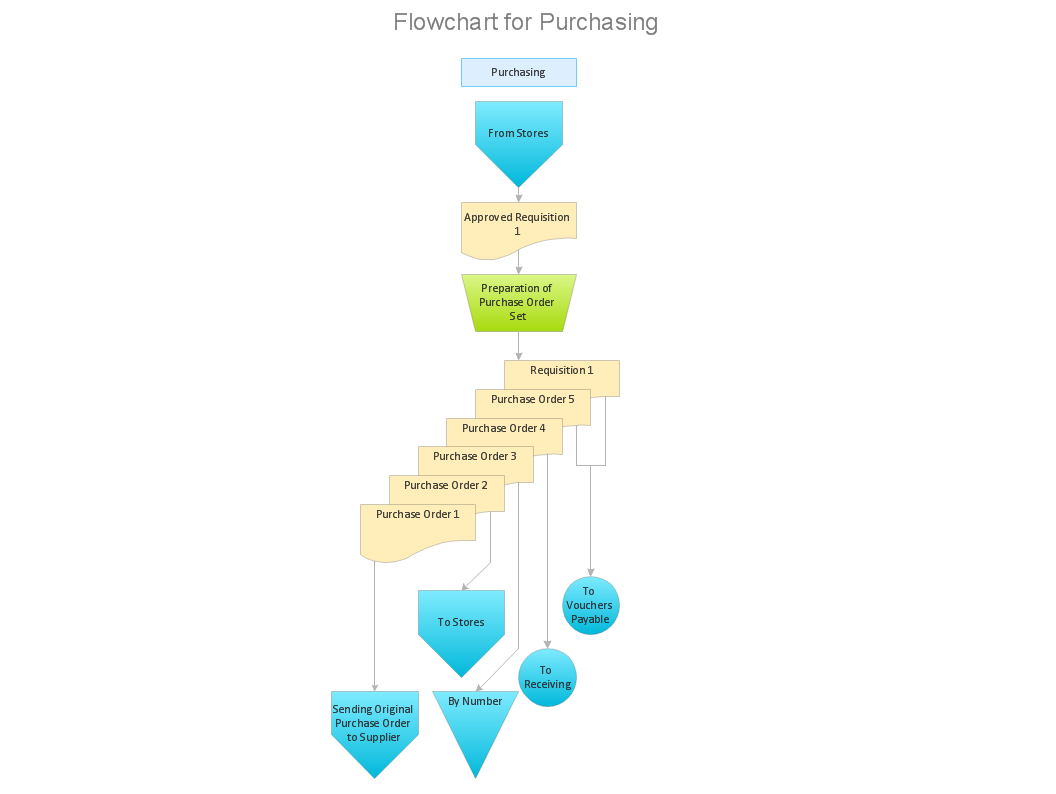
Process Flowchart Example
This flowchart sample provides a structure for business analysis that identifies a set of common stages in the life of a commercial product. This diagram is visually divided by blocks that describe the life cycle phases. For easier reading of the process definition each shape has its own color.

Example 1. Process Flowchart: Product life cycle process
Product life cycle is a business analysis that attempts to identify a set of common stages in the life of commercial products, for example, introduction, promotion, growth, maturity and decline. (Product lifecycle, Wikipedia)
Use ConceptDraw DIAGRAM software for drawing your own product life cycle flowcharts.