Diagramming Software for Design
Business Process Diagrams
Design Elements: Swimlanes
Swimlanes are a visual mechanism of organizing and categorizing activities, in BPMN consist of two types:
- Pool: represents major participants in a process. A pool contains one or more lanes.
- Lane: used to organize and categorize activities within a pool according to function or role.
ConceptDraw has 142 vector stencils in the 8 libraries that helps you to start using software for designing own Business Process Diagrams. Use Swimlanes library with 20 objects from BPMN.
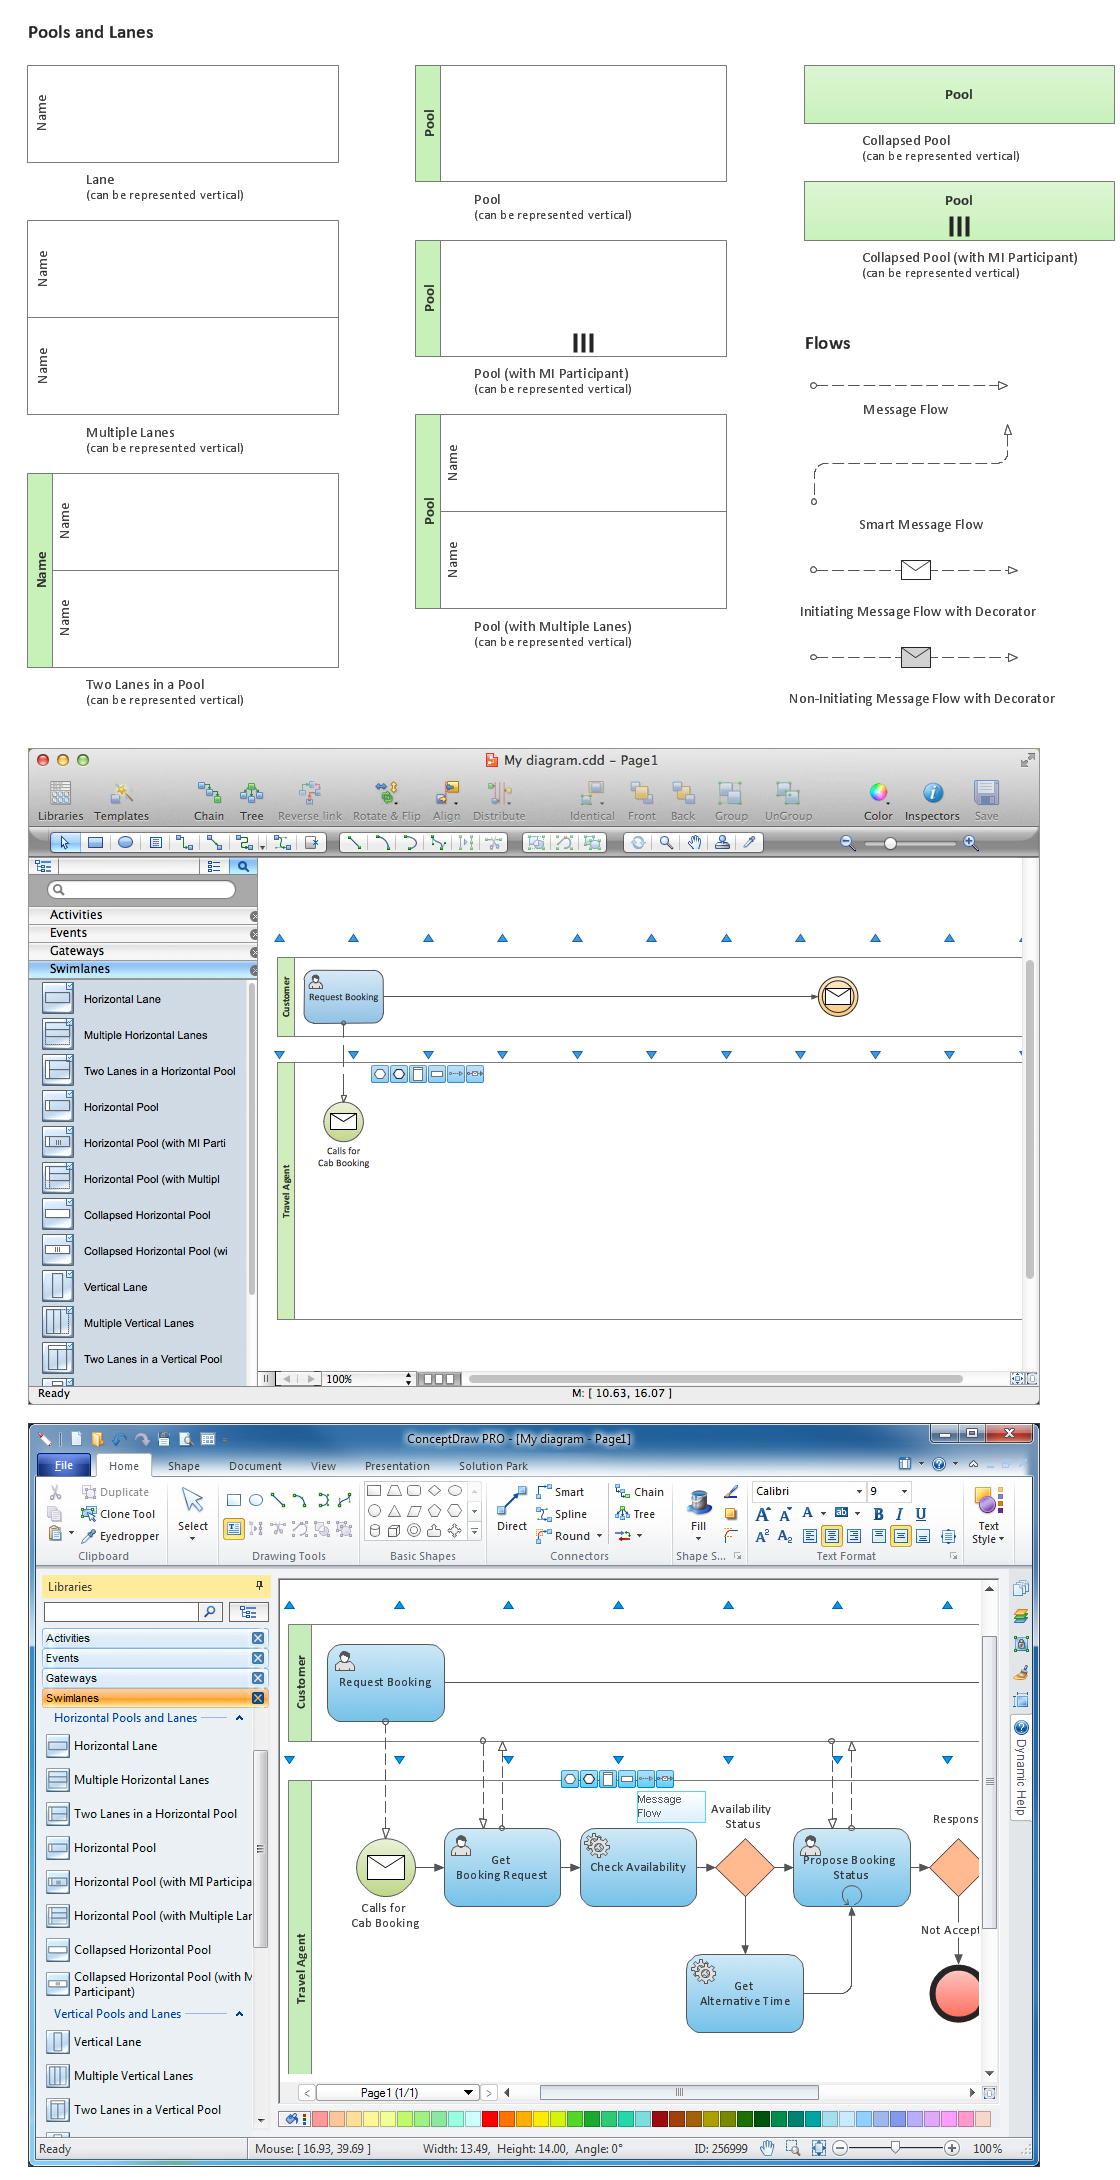
The Swimlanes library design elements provides a visual mechanism of organizing and categorizing activities in BPMN 2.0 diagrams.
Use Pool type Swimlane objects to show major participants in your business process.
Use Lane type Swimlane elements to visually organize and categorize activities in a pool by function or role.
TEN RELATED HOW TO's:
Create business process diagrams (BPMN 2.0.) with ConceptDraw using professional looking templates. ConceptDraw is business process improvement tools.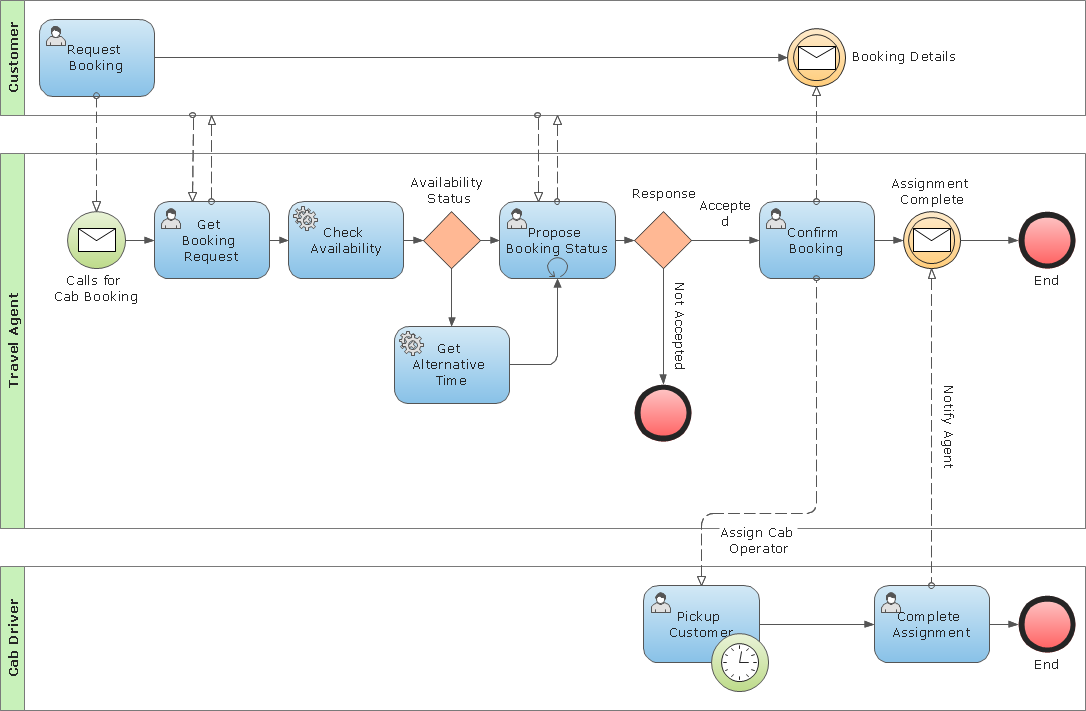
Picture: Business Process Modeling Notation Template
On this diagram are used the flowchart symbols that represents the processes and documents.
Picture:
Credit Card Order Process Flowchart.
Flowchart Examples
Related Solution:
The ConceptDraw Flowchart component includes a set of samples and templates. This geathered as flowchart maker toolbox which focused on drawing flowcharts of any industry standards.
Picture: Flowchart Components
Related Solution:
Create professional business process diagrams using ConceptDraw Events library with 17 objects from BPMN.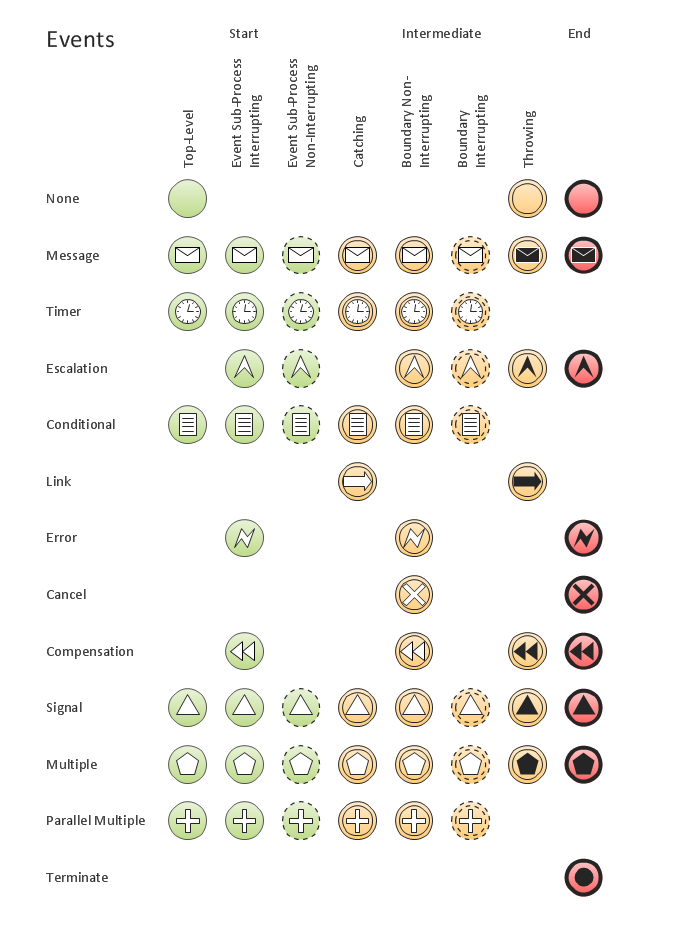
Picture: Business Process Elements: Events
Flowcharts are helpful in understanding a complicated process. ConceptDraw DIAGRAM allows you to creating a simple flowchart. The ability to create flowcharts is contained in the Flowcharts solution. The solution provides a set of special tools for creating flowcharts.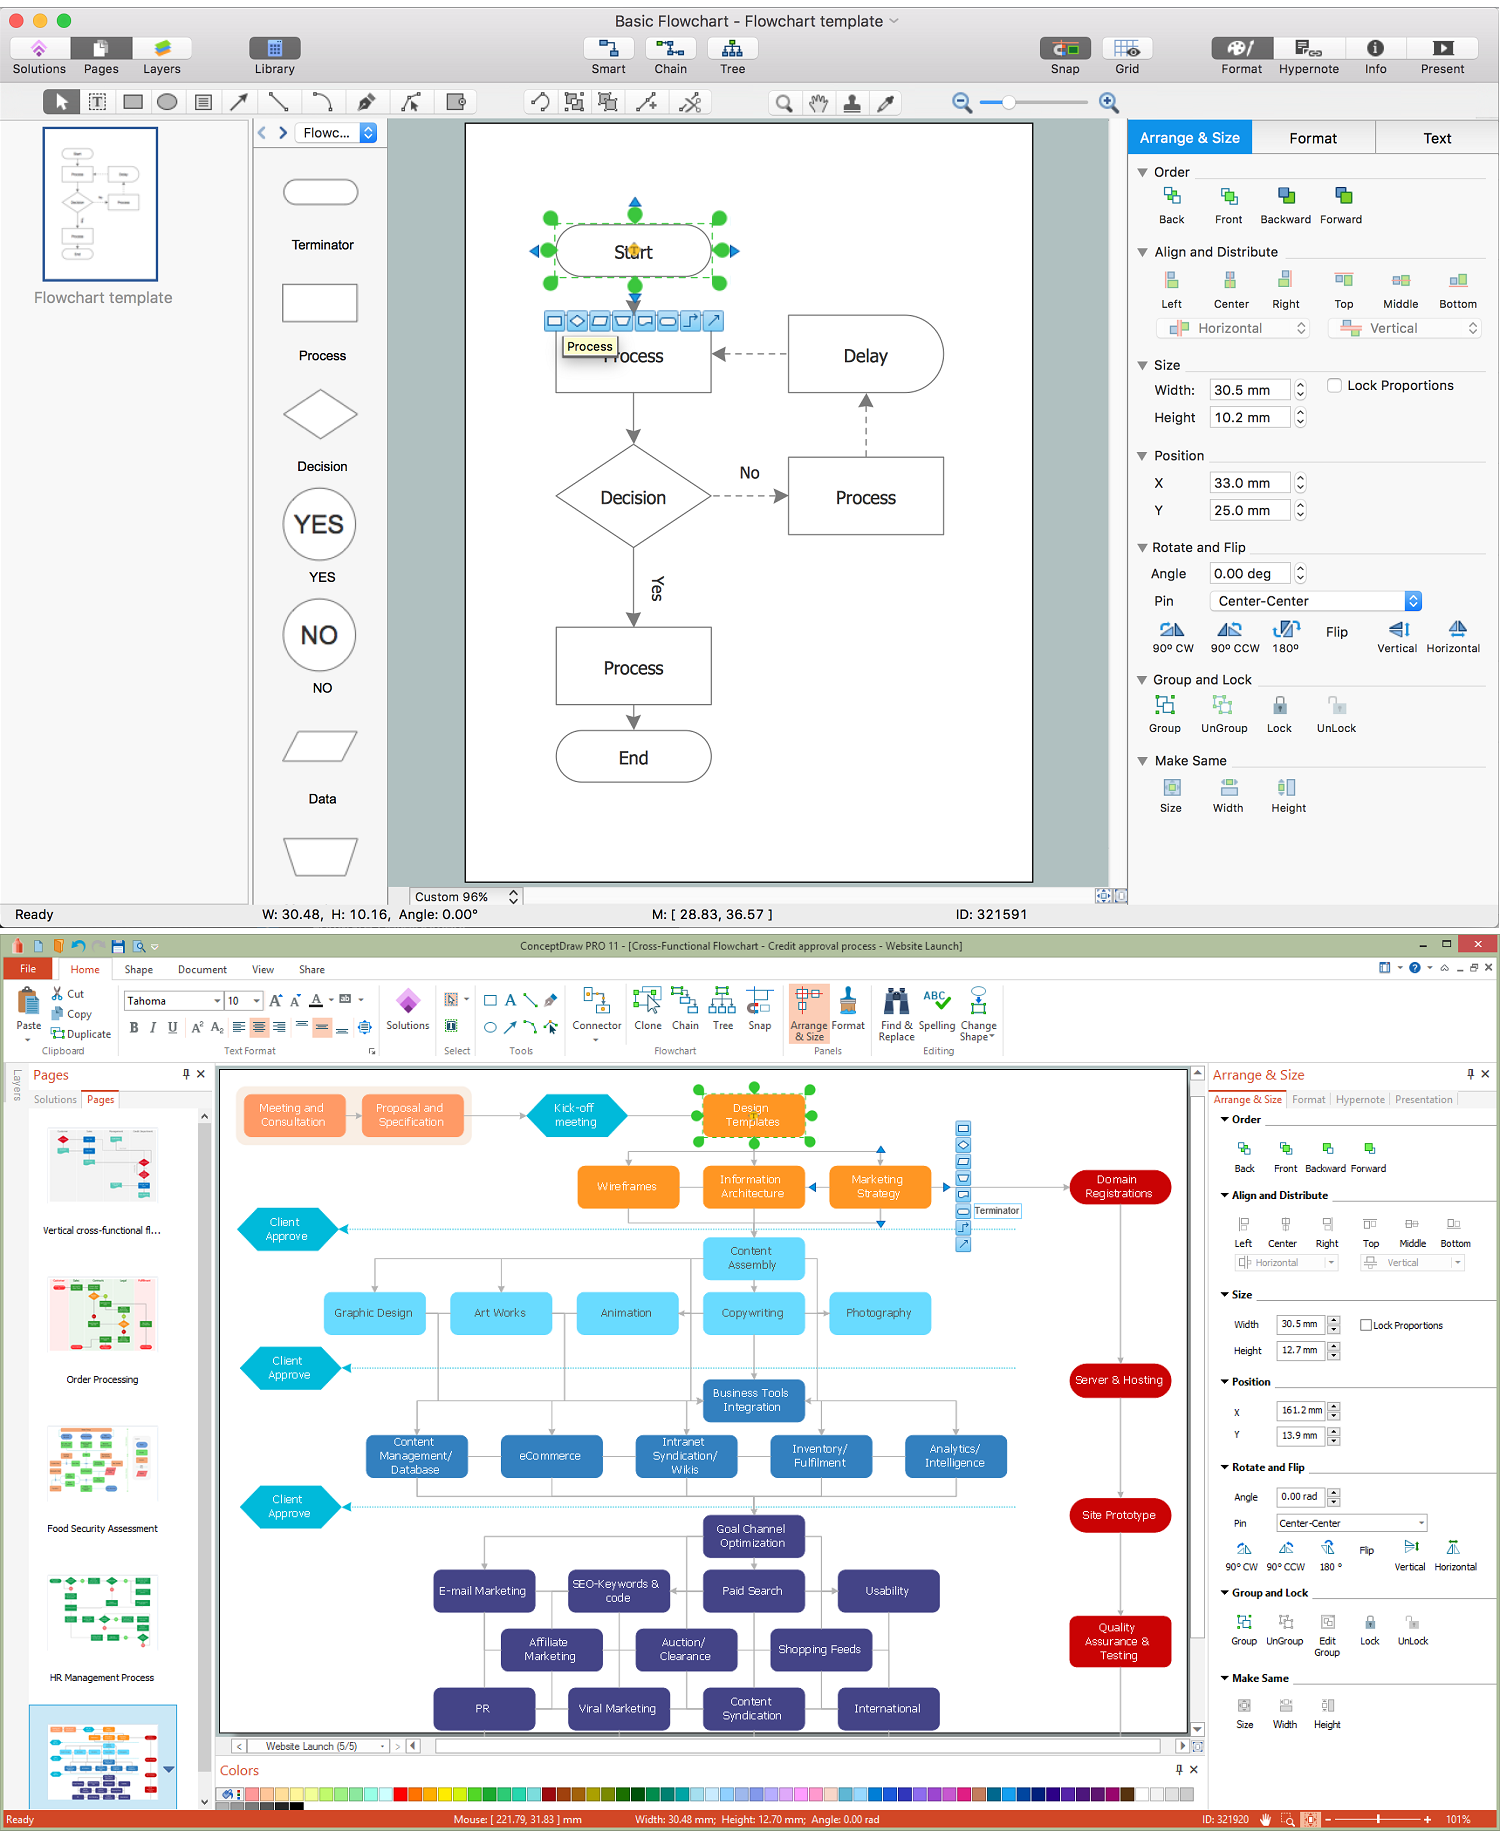
Picture: Creating a Simple Flowchart
Related Solution:
ConceptDraw DIAGRAM is a flowchart design software. There are large collections of professional flowchart symbols for process flow diagrams, standard flowchart symbols and colored basic flowchart symbols. Built-in examples and video lessons allow users to get started immediately and do drawing of virtually any type of flowchart or process flow diagrams
Picture: Flow Chart Creator
Related Solution:
Successful quality management implemented in a company of any size is a critical component of a company organization.
Picture: What is a Quality Management
Related Solution:
If you ever tried programming, you could face a lot of problems as a beginner. To help yourself, create a flowchart to follow an algorithm logic. Flowchart represents a program as a sequence of steps depicted in special symbols for each type of action.
This image of the interactive diagram made in ConceptDraw DIAGRAM applying the Live Objects technology. The diagram shows the effect of Selection Sort algorithm. The left part of the chart is the input area. The diagram in the central part of the drawing is a flow chart showing of the selection sort algorithm. The flowchart includes basic flowchart symbols, that represent various stages of algorithm. The flowchart symbols are connected with arrows ended lines, that depict the direction of the process flow. On the right side — the result is displayed.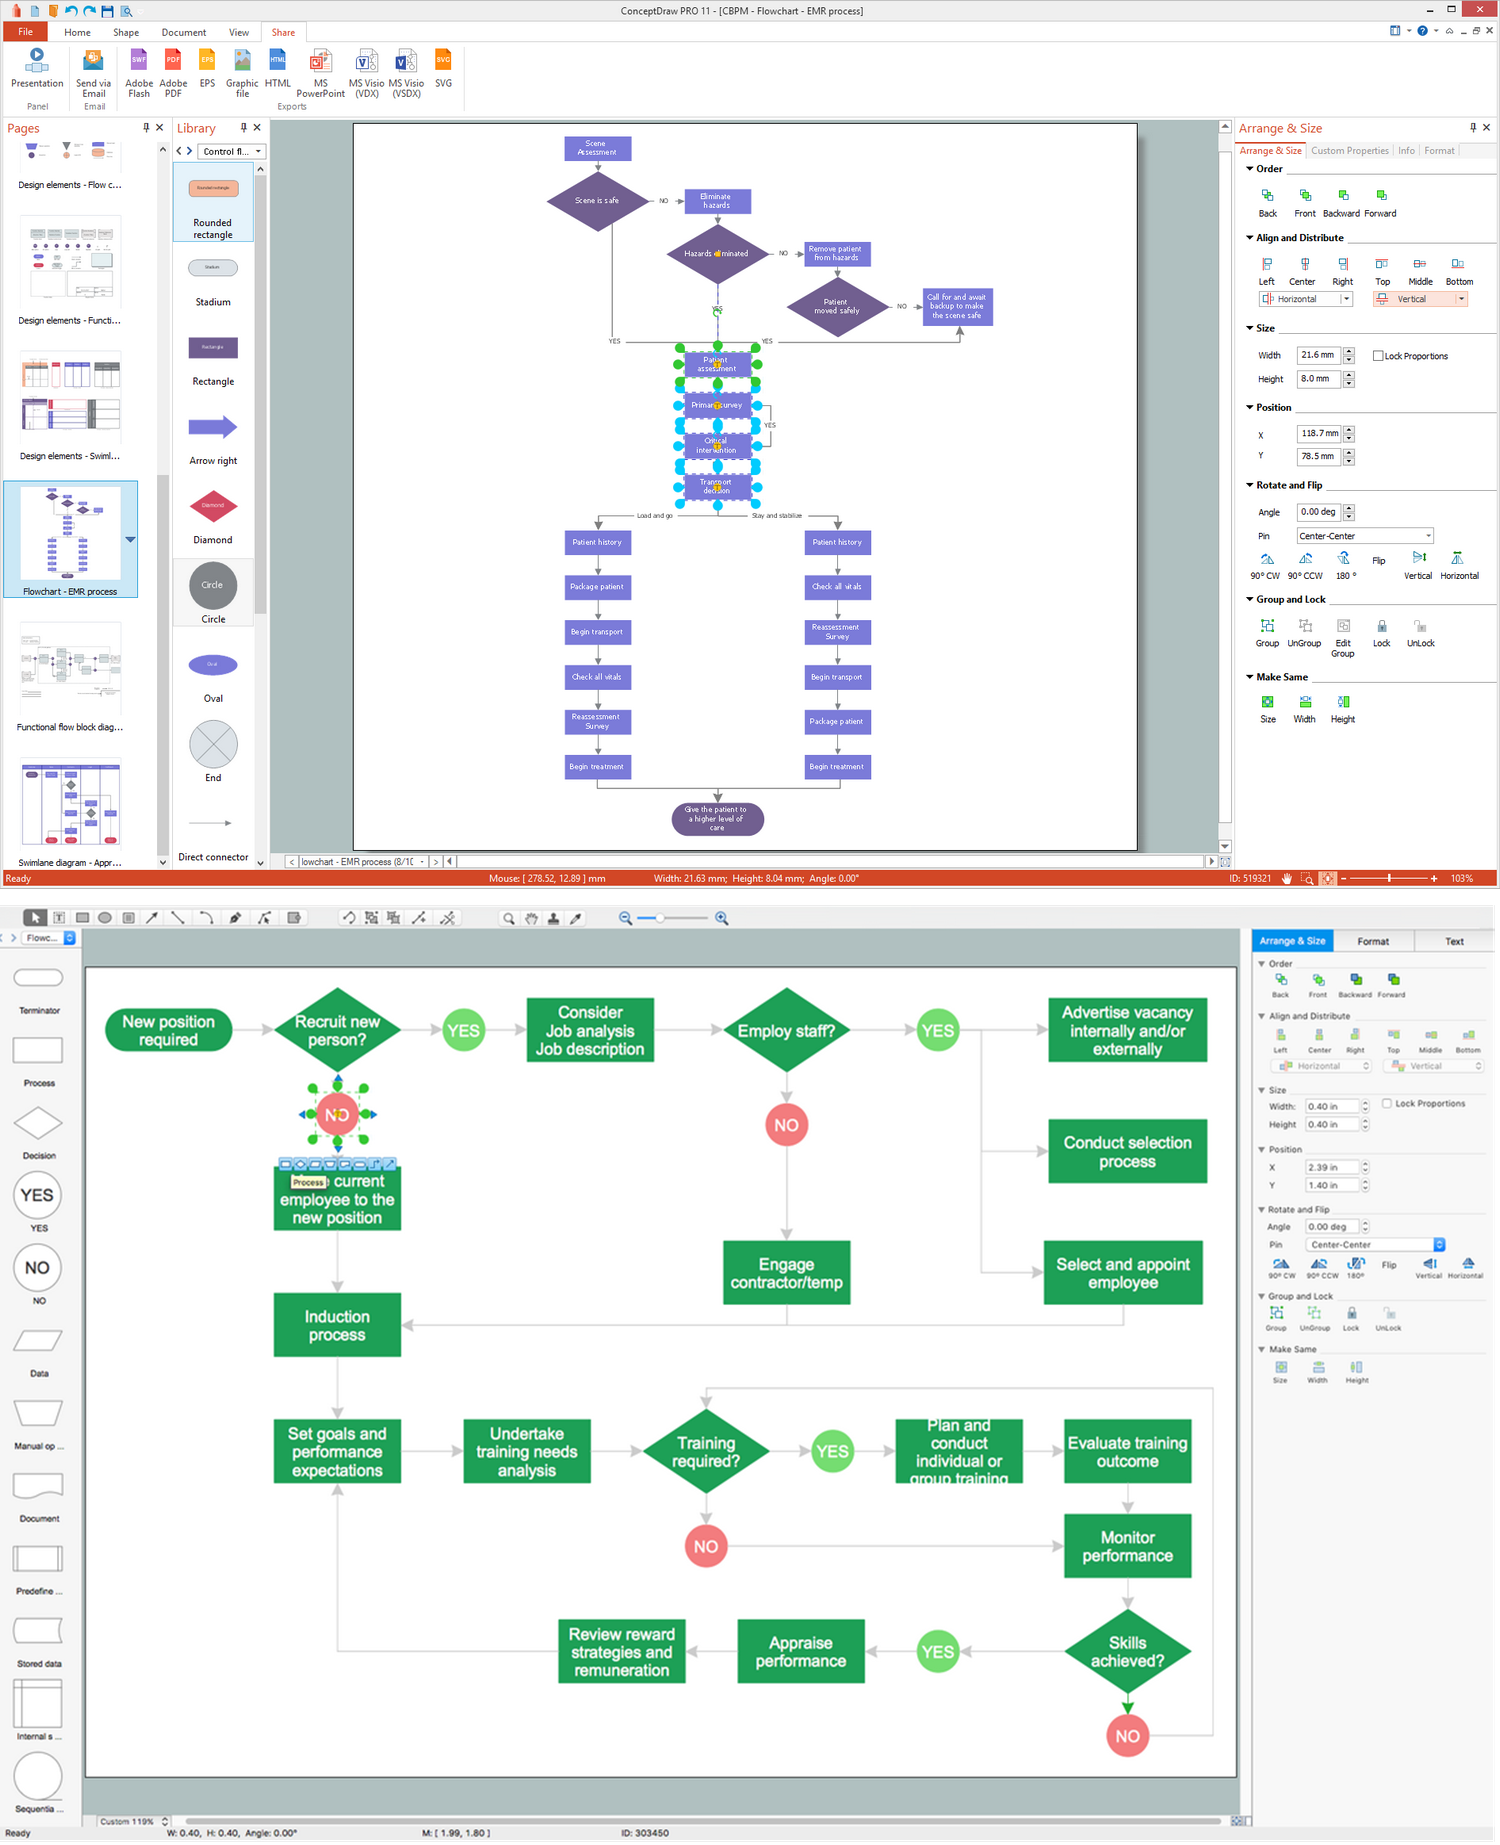
Picture: What Is a Flowchart? Definition, Symbols, Examples and How to Create One
Related Solution:
SIPOC is a tool that summarizes the inputs and outputs of one or more processes in table form.
You need to draw professional looking SIPOC Diagram quick and easy? Pay please your attention on ConceptDraw DIAGRAM diagramming and vector drawing software. Extended with Business Process Mapping Solution from the Business Processes Area of ConceptDraw Solution Park, it suits ideal for this.
Picture: SIPOC Diagram
Related Solution:
What is a Process Flow Map? It is a chart which visually illustrates a business process and how its steps work together. Process Flow Maps help companies define problem areas, inefficient activities for the purpose of further increasing performance and profitability of businesses. ConceptDraw DIAGRAM diagramming and vector drawing software extended with Flowcharts solution from the Diagrams area of ConceptDraw Solution Park is efficient and productive software for fast and simple creating professional looking Process Flow Map.
Picture: Process Flow Maps
Related Solution:
ConceptDraw
DIAGRAM 18