Cross Functional Flowchart (Swimlane Diagram): Definition, Structure, Examples, and How to Create
A cross functional flowchart (also called a swimlane flowchart, cross functional process flowchart, or swimlane diagram) is a type of flowchart that organizes a process or workflow across multiple roles, teams, or departments. Instead of showing only the sequence of steps, this diagram structure separates responsibility into lanes, making it clear who performs each task, how decision points are handled, and how control flow moves between participants.
This type of workflow diagram is often used as a cross functional process map to visualize task ownership, decision points, and coordination between teams in a structured diagram.
This type of workflow diagram is used when a process cannot be explained clearly by sequence alone.
In many cases, it can also be used to represent algorithm-like logic, where decisions and branching paths define how a process behaves under different conditions.
It shows not only what happens next, but also who owns each step and where responsibility changes.
In business process analysis and workflow design, cross functional flowcharts are used to identify bottlenecks, clarify responsibility, and improve coordination between teams.
This guide reflects established practices in business process modeling, workflow design, and cross-functional coordination used in operations management and process documentation.
For readers, the main value of this diagram type is simple: it shows both sequence and ownership in one view, so handoffs, delays, and unclear responsibility become easier to spot before they create workflow problems.
The diagram below shows a simplified cross functional flowchart to illustrate how process steps move across responsibility lanes.
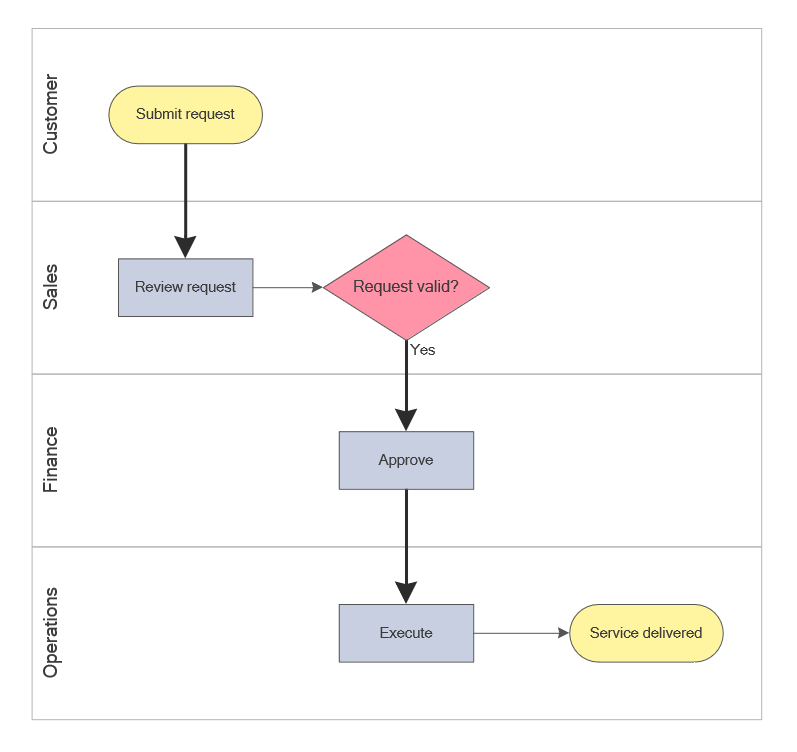
Simplified cross functional flowchart showing how a workflow moves across customer, sales, finance, and operations lanes.
This hero visual introduces the core concept of a cross functional flowchart by showing swimlanes, decision logic, and responsibility handoffs across multiple roles.
Each visual on this page is intended to explain a different aspect of the diagram type: overall concept, structure, example workflow, readability, and usage scenario.
Create your own cross functional flowchart using ConceptDraw DIAGRAM flowchart software with built-in swimlane templates and professional diagram tools.
What Is a Cross Functional Flowchart?
A cross functional flowchart is a process diagram that maps a workflow across multiple participants using swimlanes and structured control flow. Each lane represents a role, department, or system responsible for specific steps in the process.
In simple terms, a cross functional flowchart is a workflow diagram that shows both process steps and who is responsible for each step across multiple roles.
Unlike a standard flowchart, which focuses only on control flow and decision logic, a cross functional diagram adds a layer of responsibility. This makes it easier to see how tasks move between teams, where decisions occur, and how the overall workflow is coordinated.
This type of diagram is commonly used in business process management, service delivery workflows, approval chains, and any situation where a process spans multiple functional areas.
Because it combines process flow with ownership tracking, this diagram is also used as a cross functional process map or workflow with swimlanes in business documentation and process improvement.
In some business process documentation, a cross functional flowchart may also be referred to as a Rummler-Brache diagram, especially when the focus is on responsibility, handoffs, and process performance across functional areas.
Structure of a Cross Functional Flowchart
The structure of a cross functional flowchart is built around swimlanes and standard flowchart symbols. Each swimlane represents a responsibility area, such as a department, role, or system, while the process flow moves across these lanes from start to finish.
Within each lane, process steps are placed according to ownership using standard flowchart symbols. Decisions are typically positioned in the lane responsible for making them, and arrows connect steps to show control flow, decision paths, and direction across the diagram structure.
The most important difference from a simple flowchart is the handoff between lanes. Each move from one swimlane to another shows that responsibility has shifted to a different role, department, or system within the same process.
This structure is widely used in process modeling to represent responsibility and workflow interactions across roles.
In a well-designed swimlane diagram, lanes define responsibility, symbols define actions and decisions, and lane transitions define handoffs. This separation is what makes cross functional flowcharts effective for process analysis.
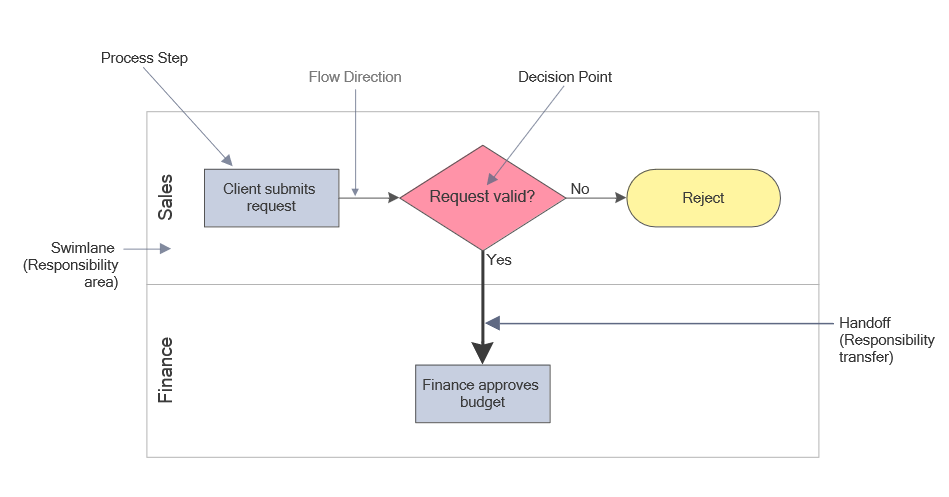
This labeled visual explains how a cross functional flowchart is structured and how swimlanes, steps, decisions, flow direction, and handoffs work together in one diagram.
This simplified diagram illustrates the core principle of a cross functional flowchart: swimlanes define responsibility, while decisions and handoffs show how the workflow moves between roles.
Standard flowchart symbols are still used inside the lanes: start and end symbols mark boundaries, process symbols show actions, decision diamonds indicate branching, and arrows show control flow. The swimlane structure adds ownership to that same logic.
Cross functional flowcharts can be arranged horizontally or vertically. Horizontal swimlane diagrams are often used for presentations, while vertical layouts are more common in detailed process documentation.
To read a cross functional flowchart effectively, follow the control flow from start to end, then scan horizontally across swimlanes to understand how responsibility shifts between roles. Each vertical or horizontal transition between lanes represents a handoff in the process.
Example of a Cross Functional Flowchart
Tip: Before looking at the example, try to predict how the workflow will move between roles and where the decision point will appear in the process.
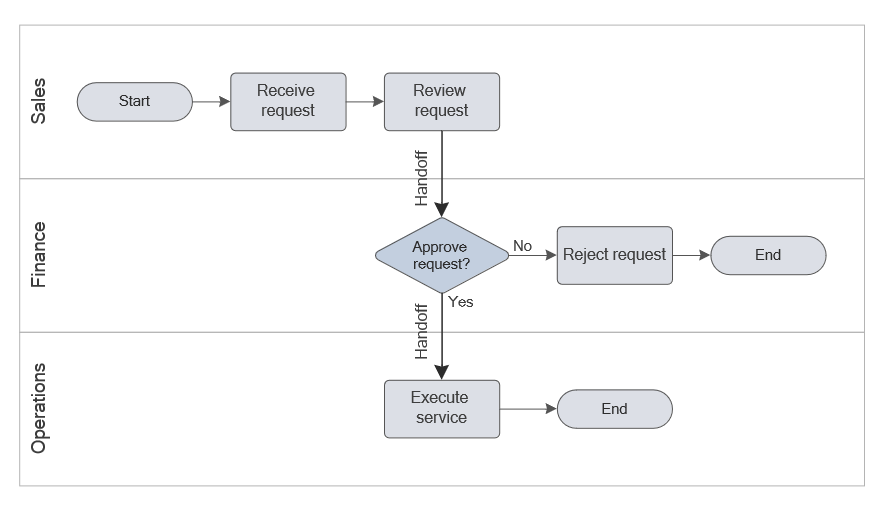
The example below shows a typical workflow where a customer request is reviewed, approved, and executed across multiple departments in a cross functional workflow diagram.
This is a typical swimlane diagram example used to represent a cross functional workflow with decisions, approvals, and responsibility transitions.
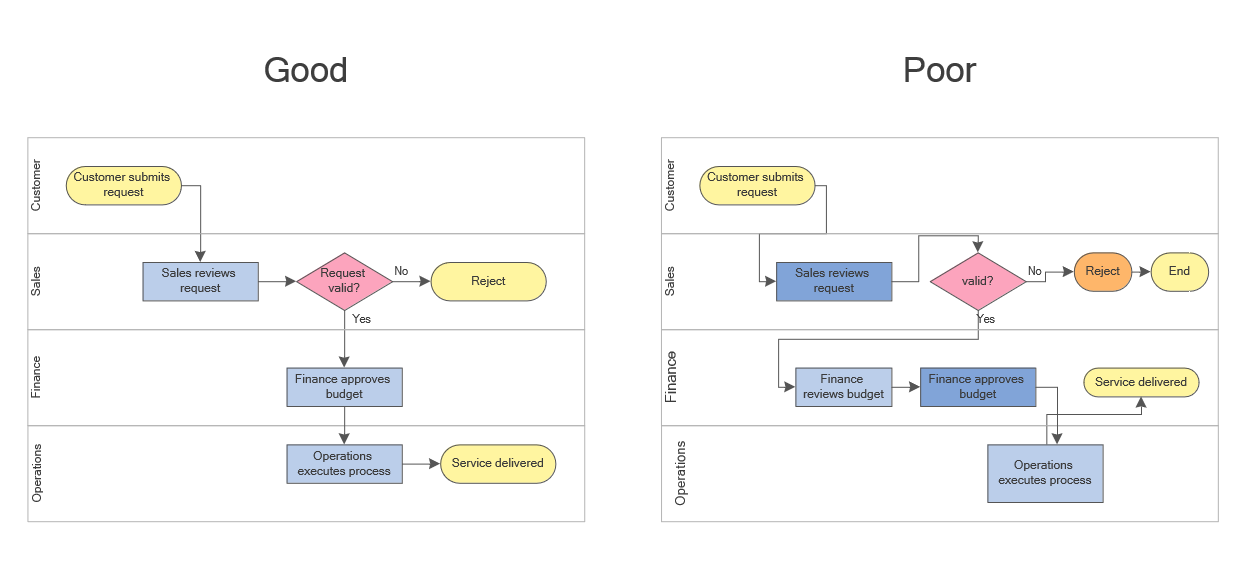
This example illustrates a real-world process workflow where responsibility and decision logic are distributed across roles.
This example demonstrates how swimlanes, decisions, and process steps work together to show workflow structure and responsibility across multiple roles.
To read this process diagram, first follow the arrows from start to finish, then use the swimlanes to understand task ownership, and finally review the decision branch to see how the workflow changes under different conditions.
Each transition between lanes marks a handoff, which makes coordination points easier to identify and helps reveal where delays, duplication, or unclear ownership may affect the workflow.
A well-structured cross functional flowchart should allow a reader to identify responsibility, follow decision paths, and understand the workflow without additional explanation. If the diagram requires repeated backtracking or interpretation, its structure may need refinement.
This kind of example is especially useful for identifying where approvals slow the process, where work is duplicated, and where responsibility changes create friction between teams.
In real-world use, cross functional flowcharts are often applied to processes such as order handling, onboarding, and service delivery, where coordination between teams is required and delays typically occur at handoff points.
To compare this diagram with other layouts and process scenarios, explore additional flowchart examples.
This comparison shows how layout, spacing, and connector clarity affect how easily a cross functional workflow can be understood.
When to Use a Cross Functional Flowchart
A cross functional flowchart is most useful when a workflow or process diagram spans multiple roles, departments, or systems. It helps visualize responsibility, track handoffs, and ensure that each step in the process is clearly assigned.
This type of swimlane diagram is especially effective when responsibility, approvals, and coordination between teams need to be visualized clearly.
As a practical rule, use a simple flowchart when one person or team owns most of the workflow, and use a cross functional flowchart when the process depends on coordination between several participants.
This makes cross functional flowcharts especially useful in process modeling and workflow optimization scenarios.
If the main goal is only to show basic sequence, a standard flowchart is usually enough. If the goal is to show sequence, ownership, communication, and handoffs together, a cross functional flowchart is usually the better choice.
This comparison helps answer a common question: when to use a standard flowchart vs a cross functional (swimlane) diagram.
The table below highlights the key differences between a standard flowchart and a cross functional flowchart.
| Feature | Standard Flowchart | Cross Functional Flowchart |
|---|---|---|
| Main Focus | Process logic and sequence of steps | Process logic, task ownership, and handoffs between roles |
| Structure | Single workflow path without responsibility lanes | Swimlanes that separate roles, departments, or systems |
| Responsibility | Not always shown explicitly | Clearly assigned to specific lanes |
| Best Use Case | Simple workflows with one main owner | Multi-team processes with approvals, decisions, and handoffs |
| Complexity | Usually simpler and faster to read | More structured, but better for cross-team coordination |
As shown above, a standard flowchart is useful when the goal is to explain process logic clearly. A cross functional flowchart becomes more effective when the same process involves multiple roles, departments, or systems and responsibility must be clearly defined and visualized within the diagram.
- Processes involving multiple departments or teams
- Workflows with approvals, validations, or decision points
- Service delivery or operational processes with handoffs
- Business process analysis and improvement initiatives
- Situations where responsibility tracking is important
Common use cases include onboarding, order processing, service delivery, payroll workflows, approval routing, and other cross-team operations where visibility into responsibility and handoffs is important.
However, if the workflow is very small or has a single clear owner, swimlanes can add unnecessary complexity instead of improving clarity.
Avoid using a cross functional flowchart when the process involves only a single role or when responsibility does not change throughout the workflow. In such cases, a simple flowchart provides clearer visualization without unnecessary structural complexity.
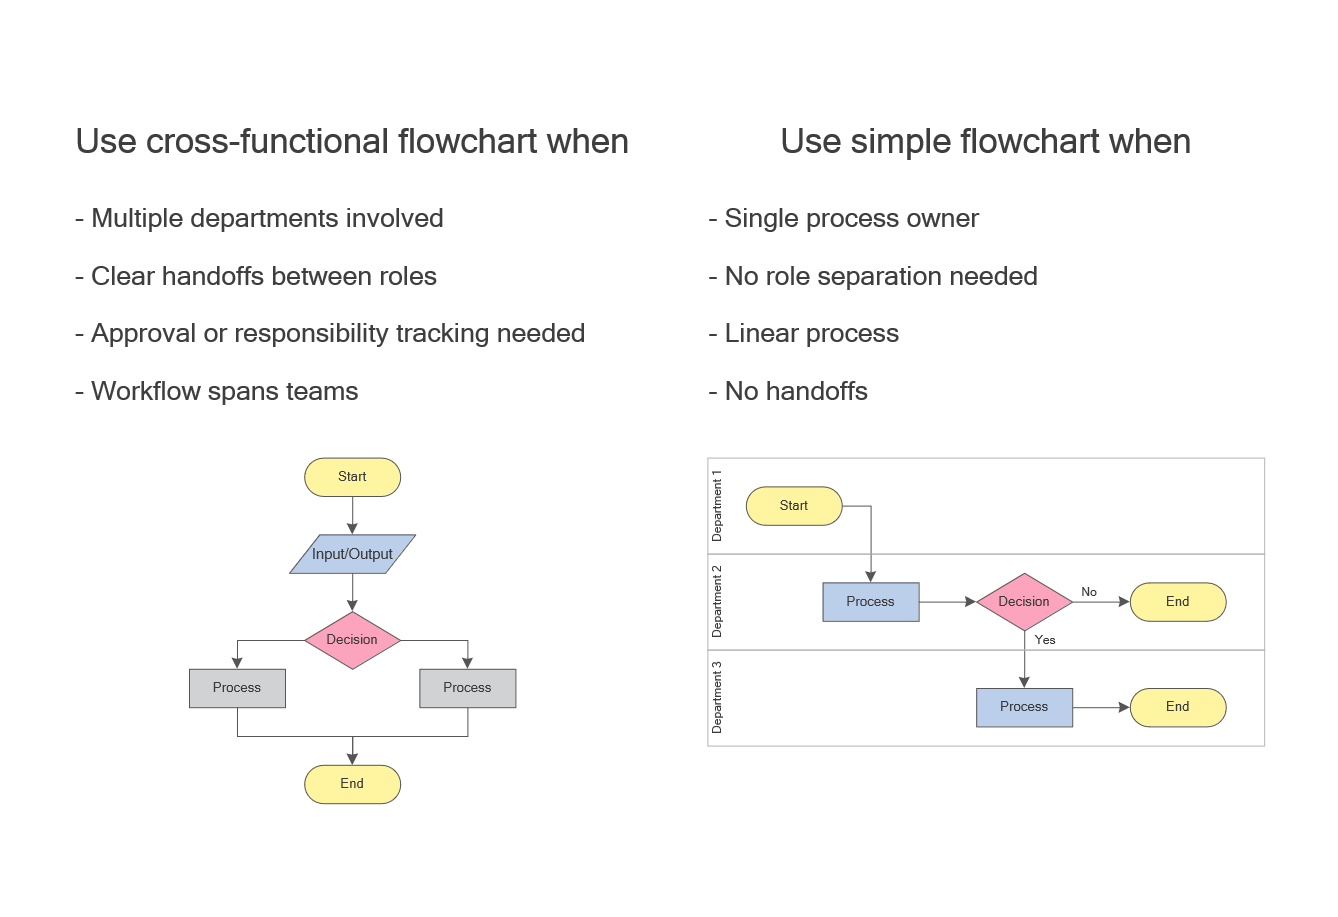
This diagram helps determine when swimlane-based diagrams improve clarity, especially in workflows involving multiple roles and handoffs.
How to Create a Cross Functional Flowchart
The steps below show how to create a cross functional flowchart (swimlane diagram) for a real workflow.
- Define the process boundaries, start point, and end point.
- Identify all roles, departments, or systems involved in the workflow.
- Create swimlanes to represent each responsibility area.
- Place process steps in the correct lanes based on ownership.
- Add decision points and connect steps using arrows to show control flow, decision logic, and workflow direction.
- Review the diagram to ensure clarity, readability, and logical flow.
Use consistent standard flowchart symbols to represent actions, decisions, outputs, and connectors within the workflow diagram.
The goal is to build a clear diagram that combines process logic with responsibility structure.
Best practices include minimizing line crossings, limiting the number of swimlanes, and aligning elements for readability. Common mistakes include mixing responsibilities within a single lane, overloading the diagram with too much detail, and leaving decision outcomes unclear.
Common mistakes to avoid:
- Mixing multiple responsibilities within a single swimlane
- Using too many lanes, making the diagram difficult to scan
- Allowing connector lines to cross excessively
- Placing decision points in the wrong responsibility lane
- Creating unclear or unlabeled decision outcomes
Best practices for clarity:
- Limit the number of swimlanes to essential roles only
- Keep flow direction consistent (left-to-right or top-down)
- Align elements to reduce visual noise
- Use consistent flowchart symbols and labeling
- Highlight key decision points clearly
Before finalizing the diagram, check the following points:
- Are all swimlanes clearly labeled?
- Is each task placed in the correct responsibility lane?
- Are decision points labeled clearly?
- Are handoffs between roles easy to follow?
- Can the workflow be understood in one reading pass?
After drafting the diagram, test it by checking whether a new reader can identify the lane owner for each step, follow the decision path without hesitation, and spot every handoff in a single reading pass.
A well-designed cross functional flowchart should remain easy to scan, with clear lane labels, visible handoffs, consistent symbols, and a process flow that does not require repeated backtracking.
To create cross functional flowcharts efficiently, you can use a professional flowchart software with swimlane templates, standard symbols, and structured diagram layouts.
You can also explore ready-to-use diagram templates and workflow examples in our flowchart solution to speed up diagram creation and maintain consistency across business processes.
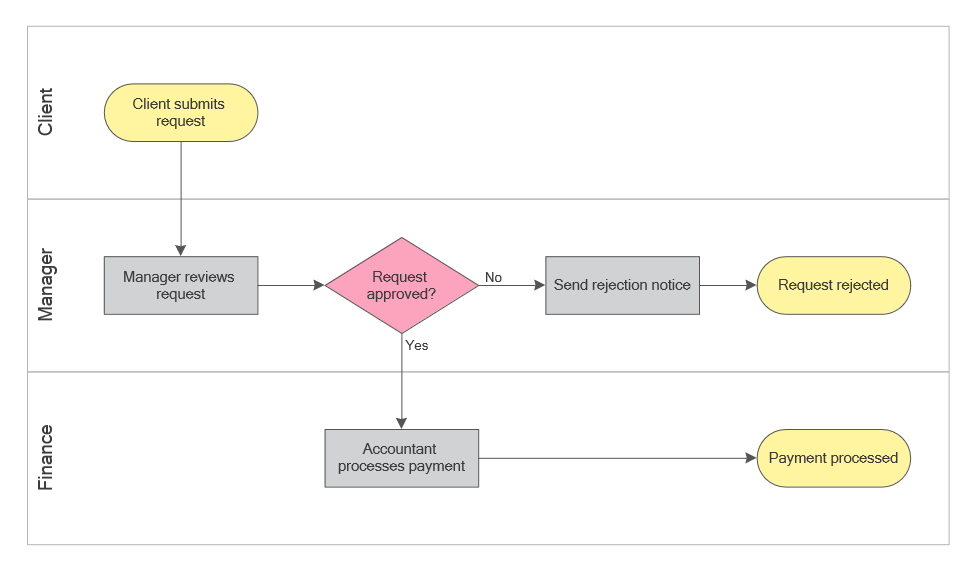
The diagram below focuses specifically on handoffs — the points where responsibility moves between roles — and helps identify where delays, miscommunication, or process breakdowns are most likely to occur.
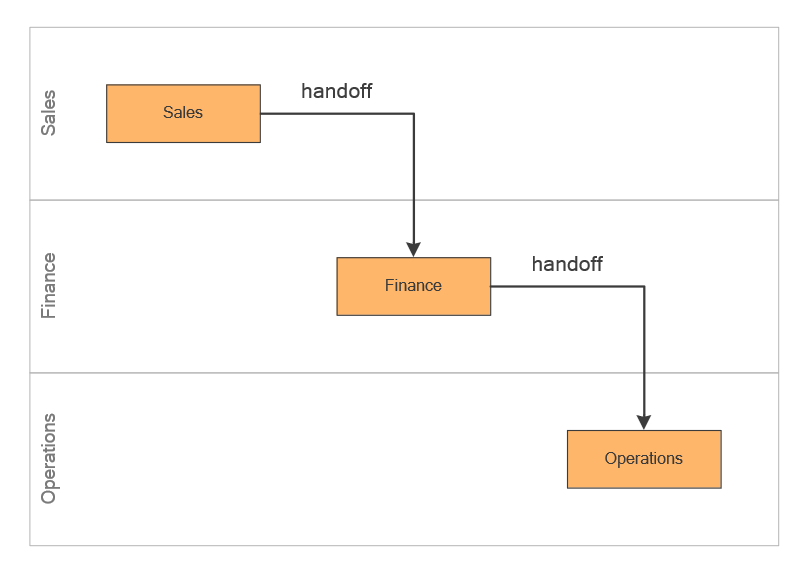
This visual highlights how swimlane diagrams make handoffs visible, helping identify coordination points and potential delays in a workflow.
FAQ
What is a cross functional flowchart?
A cross functional flowchart is a process diagram (also called a swimlane diagram) that uses swimlanes to show how a workflow moves across different roles or departments.
Is a cross functional flowchart the same as a swimlane diagram?
Yes. The terms are often used interchangeably because both describe a flowchart with lanes that represent responsibility areas.
Is a cross functional flowchart a type of workflow diagram?
Yes. It is a workflow diagram that organizes process steps across roles using swimlanes to show responsibility.
When should I use a cross functional flowchart?
Use it when a process involves multiple teams, handoffs, or approvals that require clear responsibility tracking.
How many swimlanes should a diagram have?
Typically three to six lanes is optimal. Too many lanes can reduce readability and make the diagram harder to follow.
What symbols are used in cross functional flowcharts?
They use standard flowchart symbols such as process, decision, input/output, and connectors, organized within swimlanes.
What is the difference between a simple flowchart and a cross functional flowchart?
A simple flowchart shows the sequence of steps, while a cross functional flowchart also shows who is responsible for each step.
Can a cross functional flowchart be vertical or horizontal?
Yes. Cross functional flowcharts can use either horizontal or vertical swimlanes depending on whether the diagram is intended for presentation, analysis, or detailed documentation.
What is the main benefit of swimlanes in a workflow diagram?
The main benefit is clarity of ownership. Swimlanes show who is responsible for each step and make handoffs between teams easier to identify.
What is the main purpose of a cross functional flowchart?
The main purpose is to visualize workflow and responsibility in a single diagram.


