SWOT Template
The "SWOT Analysis" solution gives simple visual support for all the steps of a SWOT Analysis process. SWOT analysis is a strategic planning method used to evaluate the Strengths, Weaknesses, Opportunities, and Threats facing a project.
The new template for ConceptDraw MINDMAP isually supports identifying internal and external factors that are favorable and unfavorable. When the analysis is complete, output your data to a SWOT Matrix in ConceptDraw DIAGRAM for exporting to a variety of other formats: MS Visiso, PowerPoint presentation, PDF, image files, etc.

Wondering what SWOT analysis means? SWOT analysis is the one that is conducted in order to evaluate the existing company resources as well as its capabilities. SWOT analysis can be conducted in order to make sure that all of the elements of it are correctly used and that the planned projects are all well implemented. SWOT analysis is important for conducting in terms of evaluating the constituents, including the fact that the profit is taken on the constant basis and that it is profitable to run this particular business as well as some particular project.
People who work in any kind of business, both running their own business or working for somebody else as employees, providing any kind of products or any kinds of services, take a huge risk by investing in their business activity their money or their time or both their money and their time or their investor’s money, they have to make sure that all of what they do will one day lead to the planned success and that there will be no loss in money by the end of each month and so each year, but the profit will increase. With the help of SWOT matrix, which is the representation of SWOT analysis, it is all possible as well as with ConceptDraw DIAGRAM application.
Once again, SWOT analysis (which result of conducting is illustrated in a way of SWOT Matrix) is a special method of structured planning, which is normally being used for evaluating the pros and cons of the way of doing business within one organization by analysing its strengths, weaknesses, opportunities and threats. If you work on some project, you have to care about what else can be done to make the situation you are in now better. You obviously cannot make as much money as you want by doing nothing, except for working hard and thinking about the strategy of leadership.
You can generate SWOT analysis not only for a company in a whole, but it might as well be done for some product, some place for office planned, for some area you work in or some person you work with. You can always make it for evaluating the strengths, weaknesses, opportunities and threats of some business venture as well as if to co-operate with another company or not. The process of making such SWOT analysis involves specifying the goal of having some business venture or business project, as well as identifying the internal and external factors which can influence on the possibility of reaching those objectives.
Members of the IT team of CS Odessa have developed the SWOT Analysis solution especially for ConceptDraw DIAGRAM users, which can be found in the Management area of ConceptDraw Solution Park. It contains samples and templates of TOWS and SWOT matrix diagrams and it can help you to quickly and effectively design any TOWS or SWOT matrix any time you want and need it utilizing ConceptDraw DIAGRAM ector and diagramming drawing software.
Using ConceptDraw DIAGRAM software can help make a well-designed SWOT matrix (which illustrates the result of the analysis of strengths, weaknesses, opportunities and threats) in only a couple of minutes. Sounds interesting? Yes, owning SWOT analysis solution that enables to create any needed SWOT matrix by providing many pre-made examples of already existing matrices, means having enough for creating your own, unique and great looking matrix.
Creating this matrix, which will illustrate all of the resources and capabilities, which can be potentially used as a basis for developing the new advantages for a particular business or company, can be a fun and entertaining process in case you make it using ConceptDraw DIAGRAM software. This matrix will also represent the scarcity of such resources, which may be also called as weaknesses. It will show all of the new opportunities in order to get more profit out of using them and so to get the company growing. And, obviously, it will represent the threats for each particular business project and the company itself for the purpose of getting rid of them but improving the existing strengths instead.
Having ConceptDraw DIAGRAM SWOT matrix solution with lots of templates available for your use means having a unique tool which can be very useful and helpful in case you have to make some business structure’s SWOT analysis. While creating SWOT analysis do not forget to take into consideration all of its necessary sections mentioned below, which are Strengths, Weaknesses, Opportunities and Threats. SWOT matrix is the one representing the SWOT analysis which has to be done in order to evaluate the Threats, Opportunities, Weaknesses as well as Strengths of some organization. SWOT analysis is the one which is able to find out all of the opportunities, that have to be taken while the process of business activity, all of the threats as they can be harmful to both the business itself and its owners, all of the weaknesses as every single business project as well as business actually has its disadvantages, and all of the advantages as they can be used for attracting the clients and the investors.
TOWS is a well-known analysis which is usually done by the business specialists in order to concentrate on the external factors which can influence on the business as a whole or on some particular business process. TOWS matrix also represents the action planning. The process of creating such SWOT or TOWS matrix can be quite challenging unless you use ConceptDraw DIAGRAM application all together with the provided examples and templates of SWOT (and TOWS) matrix, which was developed by the team of IT specialists of CS Odessa in order to help ConceptDraw DIAGRAM users to illustrate the result of conducting the SWOT (and TOWS) analysis. Having ConceptDraw DIAGRAM software as well as SWOT Analysis solution, which you can download the same day you download ConceptDraw DIAGRAM means having pretty much everything for enabling yourself in making a great looking and professional matrix. Use this application today and so the pre-made templates for drawing smart and unique SWOT and TOWS analysis of your own business project, company or for making it for somebody else.
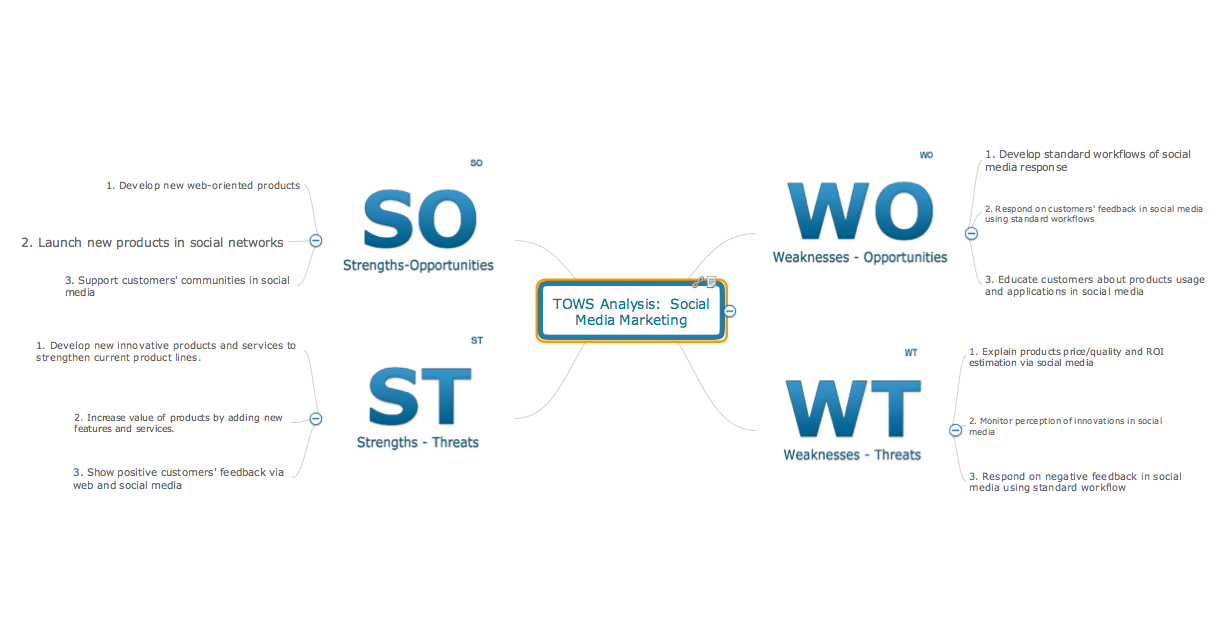
TOWS Mind Map for Social Media Marketing
Two-page template contains ready-to-input mindmaps, with predefined branches for Strenghts, Weaknesses, Opportunities and Threats (both SWOT and TOWS combinations).

SWOT Matrix Template
This sample of a completed SWOT Matrix with example entities provides an example to help you start your analysis of Strengths, Weaknesses, Opportunities and Threats facing a project or business.

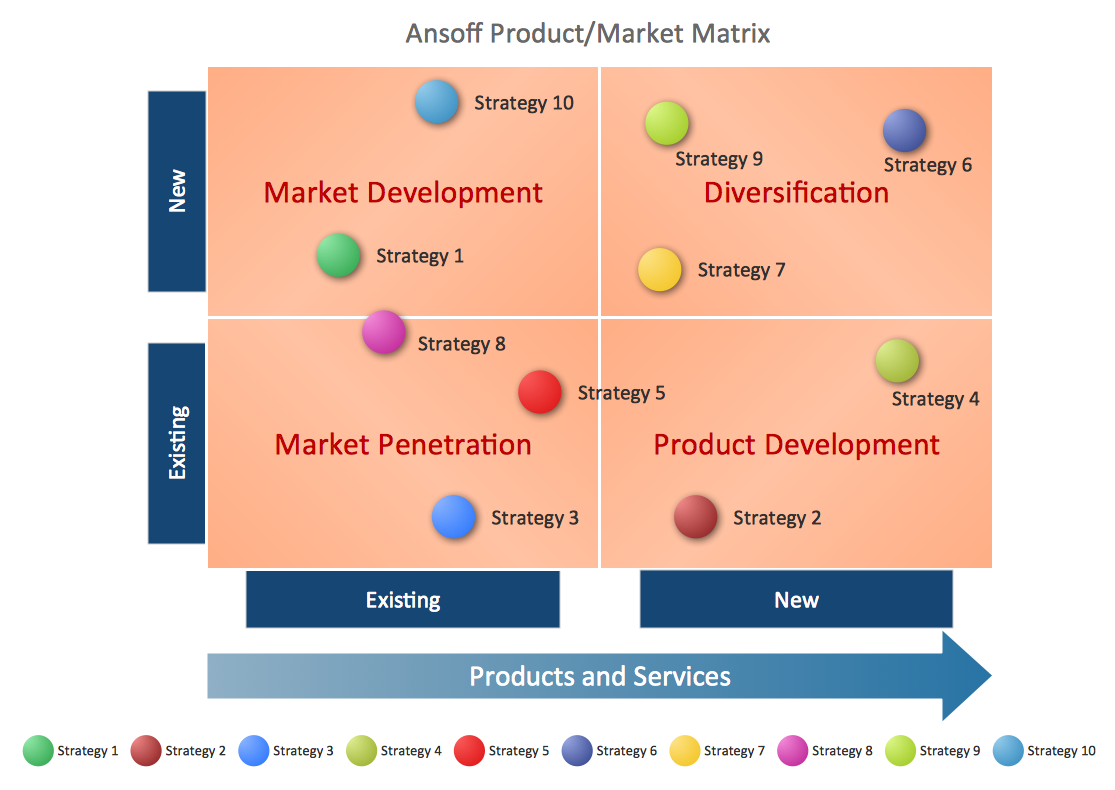
Positioning Matrix Template
This SWOT analysis matrix template helps you in positioning of SWOT factors as bubbles on bubble chart by existing/new (X axis) and existing/new (Y axis). The diameter of bubbles shows strategic impact of SWOT factors.
SWOT Matrix Template
This sample shows a SWOT Matrix diagram. Use the predesigned objects from the SWOT and TOWS Matrix Diagrams Solution to make a similar bright, attractive, professional-looking SWOT diagram in just a few minutes.
![]()
SWOT Analysis Template
This sample shows a SWOT Matrix diagram. Use the predesigned objects from the SWOT and TOWS Matrix Diagrams Solution to make a similar bright, attractive, professional-looking SWOT diagram in just a few minutes.

The templates you see on this page were created in ConceptDraw DIAGRAM using the SWOT and TOWS Matrix Diagrams Solution; they demonstrate a portion of the solution's capabilities and the professional results you can achieve.