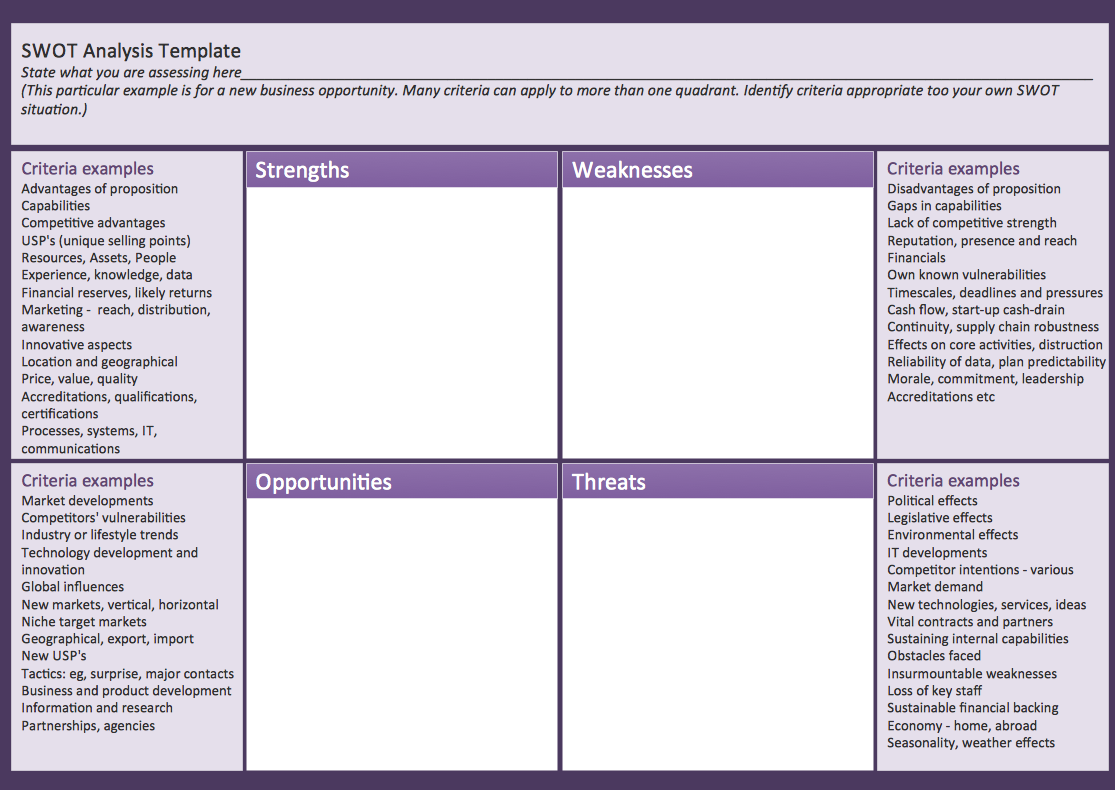
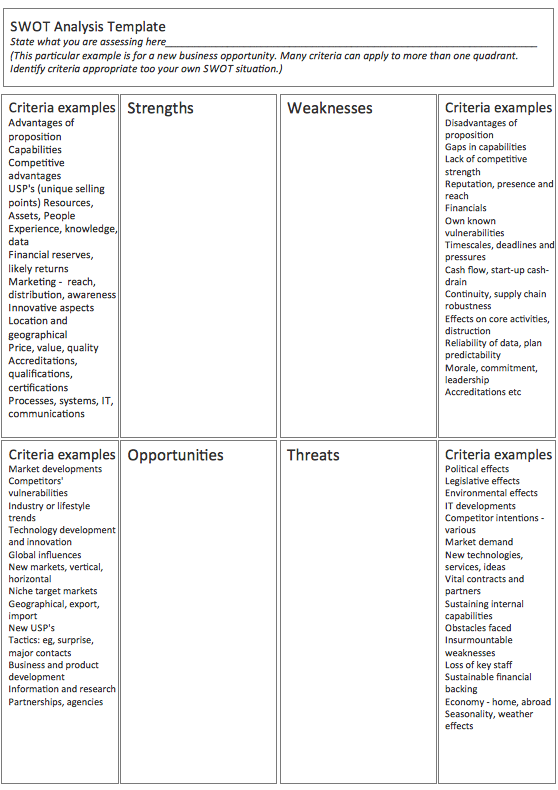
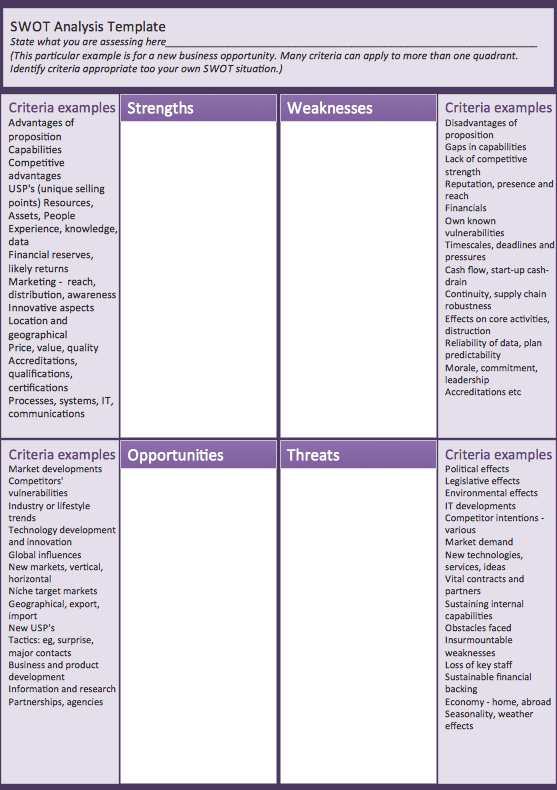
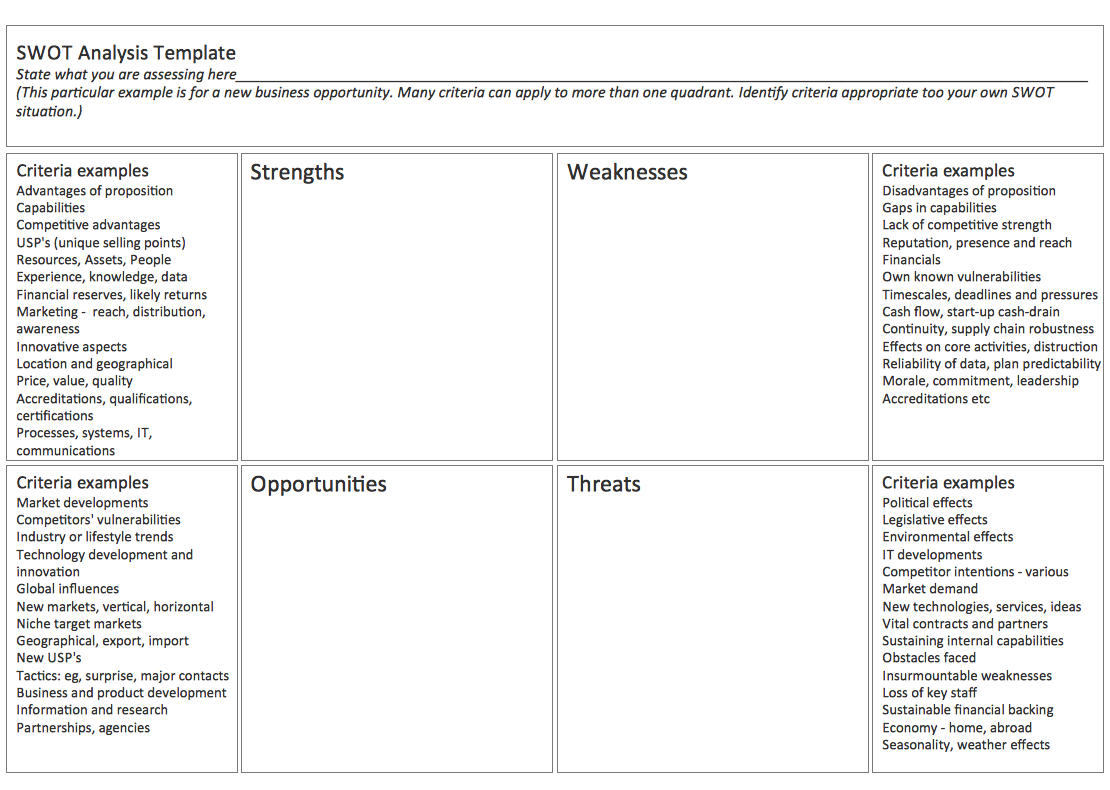
SWOT Matrix Template
SWOT analysis matrix diagram templates
Carrying out the analysis such as SWOT can be very useful as it can help you uncover the opportunities that you are well-placed to exploit and by understanding all of the weaknesses of your business – whether it is your own company or it is your business field of activity in general - you can manage as well as eliminate all of the threats that can catch you unawares. By looking at your own company as well as your competitors’ business by carrying out the SWOT framework, you can choose a strategy that can help you distinguish your company from your company’s competitors, so that you can compete in your market successfully.
SWOT analysis implies mentioning both strengths and weaknesses of your organization, which are often internal to your organization. Opportunities and threats have to be also identified within this SWOT analysis and they, in general, relate to the external factors. Thus, SWOT can be sometimes called “Internal-External Analysis” and the “SWOT Matrix” is also known an “IE Matrix”.
In terms of carrying out your own SWOT analysis, you have to identify Strengths in a way of asking yourself the following questions: “What advantages does my organization have?”, “What can I do better than any other company’s director else?”, “What unique or lowest-cost resources can I draw upon that others can't?” and so on. These questions can also include the following: “What do people in my business sphere of activity see as my company’s and my personal strengths as a director of this company?”, “What can influence on my profit and how to increase the number of clients?”, “What are all of my organization's strengths as well as advantages?”. The strengths of your organization have to be considered both from an internal perspective and from the point of your customers’ view as well as people in your business market.
In case you are having any difficulty in identifying all of the strengths of your organization, then you can try to write down a list of its characteristics. Looking at your organization’s strengths you can think about them in relation to your competitors before you start analysing its Weaknesses. To find out all of the Weaknesses of your own organization, you can ask yourself if you could improve anything about it, if you should avoid anything and if there are people in your market thinking of its weaknesses as well as what exactly they are. Think about all of the possible factors that lead to you losing your sales as well. And again, we recommend considering these weaknesses from both an internal and external perspective. You might think about other people perceiving weaknesses which you cannot see and that is the right thing to do as it can lead to the understanding of what your competitors do to achieve better results than you do.
Carrying out SWOT analysis may also lead to wondering if there are any Opportunities you could use to improve the situation with your business asking yourself if there are any you can spot straight away or if there are other people who can advise you what to do. It is important to understand what interesting trends are you aware of as well as to identify what exactly the useful opportunities can be in your particular situation. Sometimes you have to analyse if the changes in technology can help you succeed and if yes, you might need to invest in some of new tools or software, such as ConceptDraw DIAGRAM one.
Sometimes some changes in government policy which are related to your field can make difference and influence on the situation in general and so they can lead to the opportunity of increasing the profit. Changes in social patterns as well as population profiles and your own lifestyle changes can reverberate on your business and so your organization and the local events can help you promote your own product and so your company improving your reputation.
Also looking at the weaknesses of your organization you can ask yourself whether you could use the opportunities by eliminating them and you always have to determine the Threats too by asking yourself if there are any obstacles that you face in your business and if your competitors do the right thing by improving some particular product, so you have to follow them. Some other questions, which can occur: “Are quality standards or specifications for your job, your products or the services you provide changing?” and “Is the changing technology threatening your position on the market or in the particular business sphere?”. And the most important question is if any of the identified weaknesses seriously threaten your business activity.
If you are using SWOT analysis for a purpose of progressing and developing your skills as well as improving your business, then you have to make sure that you are rigorous enough in the way you apply it. We recommend you to ruthlessly prune long lists of factors as well as to prioritize them, so that you spend your time thinking about the most significant factors. You also should make sure that these options, which were generated after analysing the situations from the different sites, are carried through to the later stages in the strategy formation process. It is always very important to apply these options at the right level and on time not to waste your time thinking about whether to do it or not for too long not to waste the opportunity of using the appropriate things in order to improve what you’ve got.
Making this SWOT analysis is always simpler having our ConceptDraw DIAGRAM software which is the right tool for making such drawings. Having this application may allow you to create any needed both SWOT and TOWS analysis within only a couple of hours or even minutes as long as you have information ready to fill the gaps with. Our SWOT Analysis solution can be very useful for those who have to make such matrix and it can be found and downloaded from the “Management area” of ConceptDraw Solution Park, containing all of the examples and templates of SWOT and TOWS matrix diagrams.
SWOT Analysis Matrix Template Horizontal
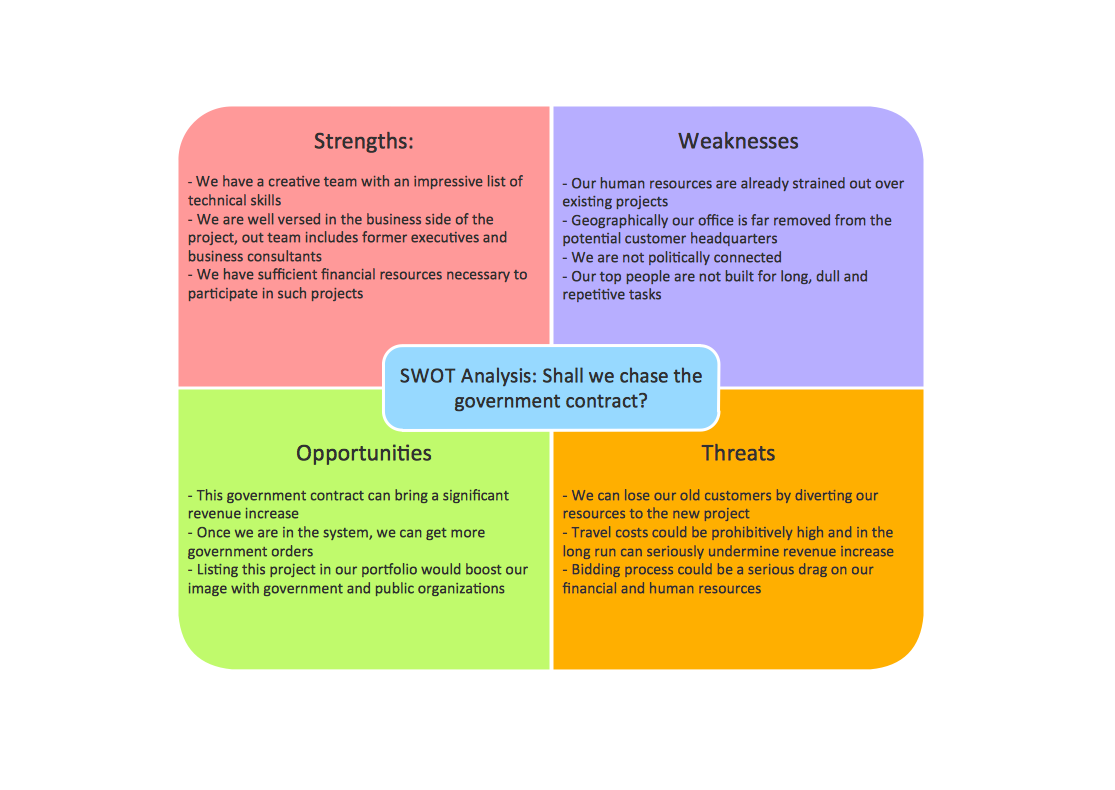
SWOT Analysis Government Contract