Swot Analysis Examples for Mac OSX
SWOT analysis is a rapid plan making methodology for evaluating the Strengths, Weaknesses, Opportunities, and Threats involved in a project. The ConceptDraw software with the SWOT Analysis solution includes the SWOT Analysis Examples for Mac OSX.

Sample 1. SWOT analysis positioning matrix template
SWOT Analysis solution from ConceptDraw Solution Park extends ConceptDraw MINDMAP and ConceptDraw DIAGRAM software with easy-to-use SWOT Analysis tools for Mac OSX and Windows.
This solution contains SWOT and TOWS matrices and mind map examples, templates and vector stencil libraries for creating SWOT and TOWS analysis mindmaps and matrix diagrams.
See also:
Marketing — Matrices
- Marketing positioning matrix - Product positioning map
- Product-market matrix - Ansoff matrix
- BCG matrix - Boston growth-share matrix
- Feature comparison chart - Digital scouting cameras
- Marketing matrix diagram - Competitive strategies
- Marketing matrix diagram - Porters value chain
- Marketing mindmap - Marketing research project
- Marketing mind map - Strategic accomplishment mapping
- Twitter Compaign for New Software Product
- Marketing mind map - Sales Call
TEN RELATED HOW TO's:
Succeed with ConceptDraw DIAGRAM and ConceptDraw MINDMAP software in ✔️ SWOT analysis, ✔️ creating visually appealing SWOT Matrices and SWOT Mind Maps, ✔️ strategic planning, ✔️ decision-making, ✔️ risk management, ✔️ market positioning, ✔️ company development, ✔️ identify emerging trends and customer needs, ✔️ identifying and eliminating external challenges, ✔️ communication and collaboration, ✔️ resource allocation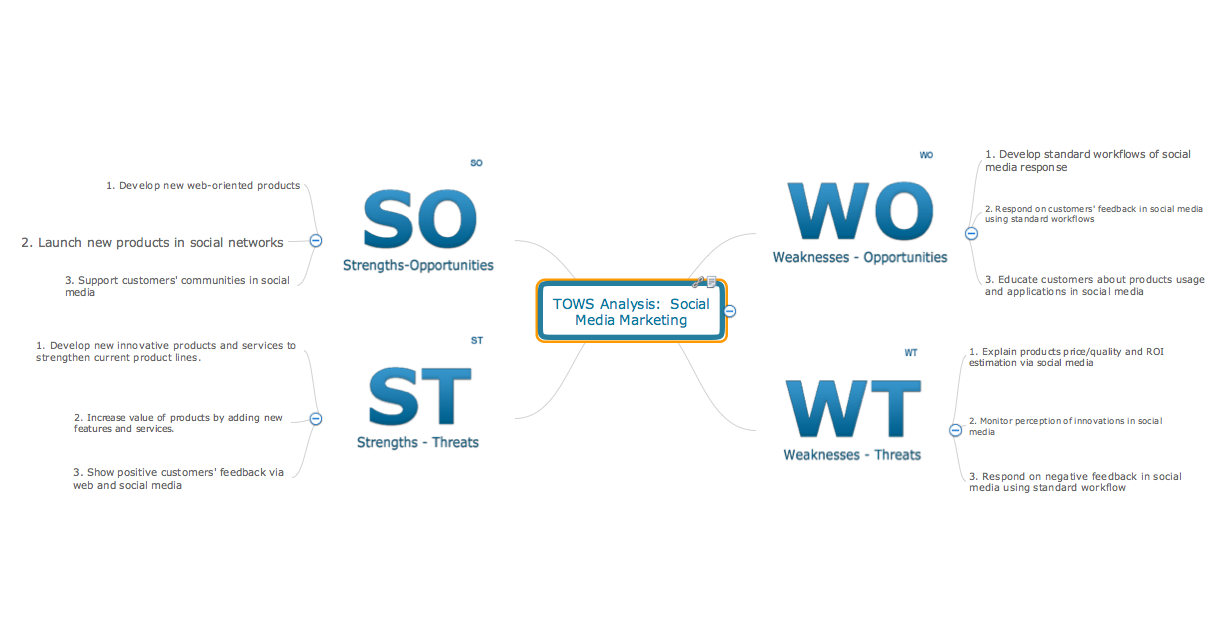
Picture: SWOT Analysis Marketing Tool: A Comprehensive Guide
An example of marketing analysis diagram, can be used to analyse product market and define marketing strategy.
This sample shows the Feature Comparison Chart of the digital scouting cameras. It can be useful for digital cameras production field, marketing, sales, etc.
Picture: Feature Comparison Chart Software
Related Solution:
Many things can be listed as potential strengths and weaknesses of a company. To create a good-looking scheme, use SWOT analysis software and enjoy the results within a few minutes. A good practice is to make a SWOT analysis twice a year.
These drawings illustrate the possibilities of ConcptDraw solution for building SWOT and TOWS Matrices. SWOT analysis matrix demonstrates this widely used method for detection of Strengths and Weaknesses, Opportunities and Threats facing any business. If SWOT analysis is carried out properly, it can help to build a good position in the market. The ConceptDraw SWOT and TOWS Analysis solution provides a great number of templates of both SWOT and TOWS matrices. Moreover, this is the only software that offers to carry out SWOT analysis starting from making mind maps. The solution contains SWOT mind map templates. A single mouse click is needed to turn the SWOT mind map into a SWOT matrix. The SWOT diagram will be created in ConceptDraw DIAGRAM on the base of SWOT mind map.
Picture: SWOT Analysis Software: Comprehensive Guide
Competitor analysis is a first and obligatory step in elaboration the proper corporate marketing strategy and creating sustainable competitive advantage. Use powerful opportunities of numerous solutions from ConceptDraw Solution Park for designing illustrative diagrams, charts, matrices which are necessary for effective competitor analysis.
Picture: Competitor Analysis
Related Solution:
ConceptDraw DIAGRAM is a powerful diagramming and vector drawing software. Extended with Matrices Solution from the Marketing Area of ConceptDraw Solution Park it became the best software for quick and easy designing various types of Matrix Diagrams, including Positioning Map.
Picture: Positioning Map
Related Solution:
Mind map template of a strategy map that can help you display a variety of performance measures that can have an impact on your organization.
Picture: SWOT Analysis
Related Solution:
The strategic balance is a combination of factors that can both positively and negatively affect the activity of the company. To know the factors that influence the organization success, managers should use SWOT matrix template that will define the potential inner strengths and weaknesses and potential external opportunities and threats. This matrix does not contain a ready solution, but allows to streamline all the available information.
This is a handy template of a SWOT matrix. It can serves as a visual guide for management students. To simplify the task, on the left and on the right we have added hints with examples of external and internal factors. This template one can found among numerous templates of SWOT and TOWS matrices that are included in the the eponymous solution by ConceptDraw Solution Park.
Picture: SWOT Matrix Template
A lot of business process techniques are able to be applied in regular life. Although this tool is considered to be used for business purposes, you can make a SWOT template for yourself. In fact, any obstacle might become a subject for SWOT analysis.
ConceptDraw solution for SWOT analysis solution provides a power visual maintenance of a SWOT analysis. It is a procedure of strategic planning made to discover the Strengths, Weaknesses, Opportunities, and Threats business meet. This mind map template for ConceptDraw MINDMAP isually maintains investigation of good and bad factors. For example, factors that provides an advantage over others are strength; factors that brings a disadvantage are factors of weakness. After the analysis is finished, transfer your data to create a SWOT matrix in ConceptDraw DIAGRAM.
Picture: SWOT Template
SWOT matrix is a structured planning method used to evaluate the strengths, weaknesses, opportunities and threats involved in a project or in a business venture. ConceptDraw DIAGRAM diagramming and vector drawing software extended with SWOT and TOWS Matrix Diagrams Solution from the Management Area will help you design SWOT Matrix of any complexity quick and easy.
Picture: SWOT Matrix
Related Solution:
An example of marketing analysis diagram, can be used to analyse product market and define marketing strategy.
Picture: Marketing Analysis Diagram
Related Solution:
ConceptDraw
DIAGRAM 18