
Example 1. Matrix Organization
25 Typical Orgcharts Solution offers 5 different Matrix Organization Chart templates. You can find them in ConceptDraw STORE.
Each of them is a real help for self-dependent drawing! Now you don't need to be an artist to create an organizational chart of any complexity and you can completely concentrate on your organization and on the filling of ready template, all rest is already made instead of you.
Any of these templates can be easy modified using the predesigned objects from the Organizational Chart and Organizational Chart (people) libraries of 25 Typical Orgcharts Solution.

Example 2. 25 Typical Orgcharts Solution in ConceptDraw STORE
The following features make ConceptDraw DIAGRAM the best Matrix Organizational Chart design software:
- You don't need to be an artist to draw professional looking diagrams in a few minutes.
- Large quantity of ready-to-use vector objects makes your drawing diagrams quick and easy.
- 25 predesigned templates and 10 samples give you the good start for your own diagrams.
- ConceptDraw DIAGRAM provides you the possibility to use the grid, rules and guides. You can easily rotate, group, align, arrange the objects, use different fonts and colors to make your diagram exceptionally looking.
- All ConceptDraw DIAGRAM documents are vector graphic files and are available for reviewing, modifying, and converting to a variety of formats: image, HTML, PDF file, MS PowerPoint Presentation, Adobe Flash, MS Visio.
- Using ConceptDraw STORE you can navigate through ConceptDraw Solution Park, managing downloads and updates. You can access libraries, templates and samples directly from the ConceptDraw STORE.
- If you have any questions, our free of charge support is always ready to come to your aid.
TEN RELATED HOW TO's:
ConceptDraw DIAGRAM is a powerful business and technical diagramming software tool that enables you to design professional-looking graphics, diagrams, flowcharts, floor plans and much more in just minutes. Maintain business processes performance with clear visual documentation. Effectively present and communicate information in a clear and concise manner with ConceptDraw DIAGRAM.
Picture: ConceptDraw DIAGRAM
AWS platform is great to develop reliable applications. If you are already aware of all the benefits that Amazon Web Services diagrams bring, then you'll need also a diagramming tool for architecture to share your vision. Luckily, ConceptDraw DIAGRAM has a special AWS Diagrams solution with vector icons and templates that are easy to edit.
The AWS architecture diagram, you see on this drawing, was designed using ConceptDraw Amazon Web Services Architecture Diagrams (AWS) solution. The 14 libraries, delivered with this solution introduces near 250 vector graphic images used to draw AWS Diagrams. The AWS Architecture Diagrams solution is a valuable tool for programmers, software architects and other IT professionals. It enables them to develop reliable applications with a high stage of interaction with AWS cloud.
Picture: Amazon Web Services Diagrams diagramming tool for architecture
For vector shapes and connector tools for quick and easy drawing diagrams for business, technology, science and education - The best choice for Diagramming is ConceptDraw DIAGRAM.
Picture: Diagram Software - The Best Choice for Diagramming
Design efficiently the technical flow charts in ConceptDraw DIAGRAM software for various fields and provide ✔️ clarity, ✔️ accuracy, ✔️ usability, ✔️ simple communication, analysis, and improvement
Picture: Technical Flow Chart Example
Related Solution:
The efficiency of any corporate network depends on many factors such as equipment, architecture etc. Moreover, every administer knows that network architecture is a cornerstone for any system. Also, it's easy to make a draft of a network structure using an appropriate diagramming tool.
Designing network architecture diagrams refers to the network structure, including hardware, software, connectivity, protocols of communication and type of transmission: wired or wireless. A high performance, highly reliable, and secure network architecture is critical for the successful deployment and operation of modern communication network. This diagram represents in detail the sample of the network architecture of the three-divisional office. It is designed using vector libraries supplied with ConceptDraw Computer and Networks solution.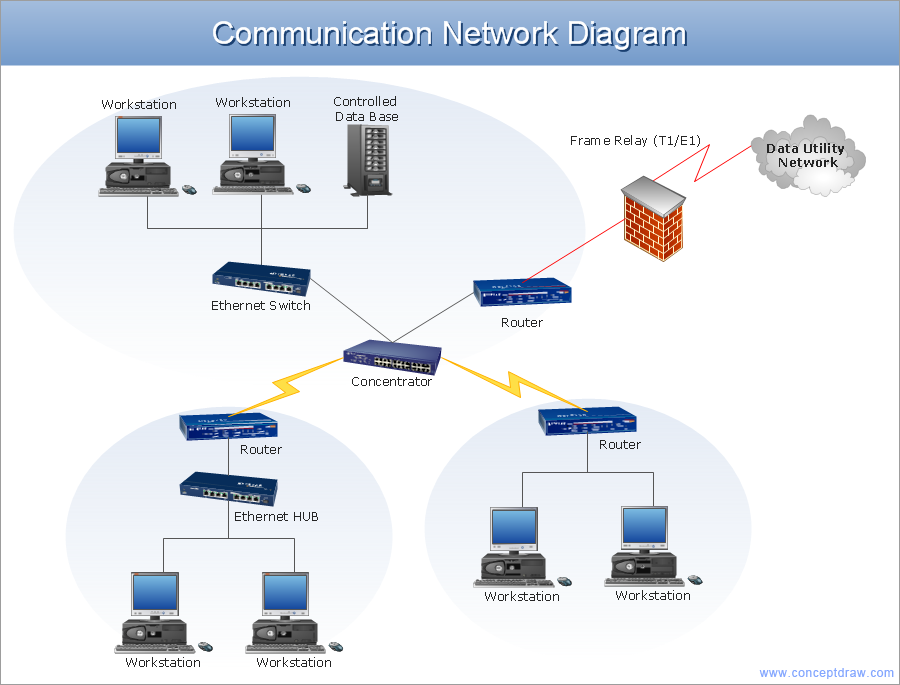
Picture: Network Architecture
Related Solution:
One of the three main constituents of any enterprise is the Control and Information Architecture. The rest two are Production facilities and People and Organization.
Picture: Control and Information Architecture Diagrams (CIAD) with ConceptDraw DIAGRAM
This sample was created on the Mac in ConceptDraw DIAGRAM diagramming and vector drawing software using the UML State Machine Diagram library of the Rapid UML Solution from the Software Development area of ConceptDraw Solution Park.
Picture: UML Diagram for Mac
Related Solution:
The Venn diagram example below shows sustainable development at the confluence of three constituent parts.
Create your Venn diagrams for problem solving in environmental social science using the ConceptDraw DIAGRAM software.
Picture:
Venn Diagram Examples for Problem Solving
Environmental Social Science
Human Sustainability Confluence
Related Solution:
The Rapid UML solution from Software Development area of ConceptDraw Solution Park includes 13 vector stencils libraries for drawing the UML 2.4 diagrams using ConceptDraw DIAGRAM diagramming and vector drawing software.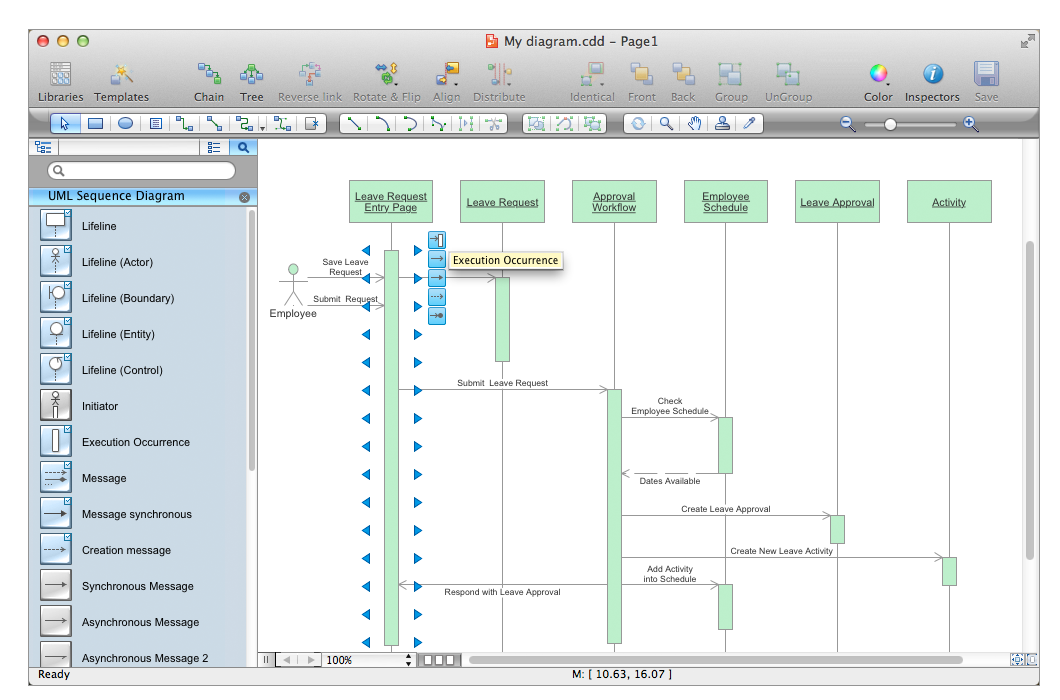
Picture: Design Elements for UML Diagrams
Related Solution:
Video tutorials on ConceptDraw products. Try it today!
Picture: How to Draw a Bubble Chart
Related Solution:


