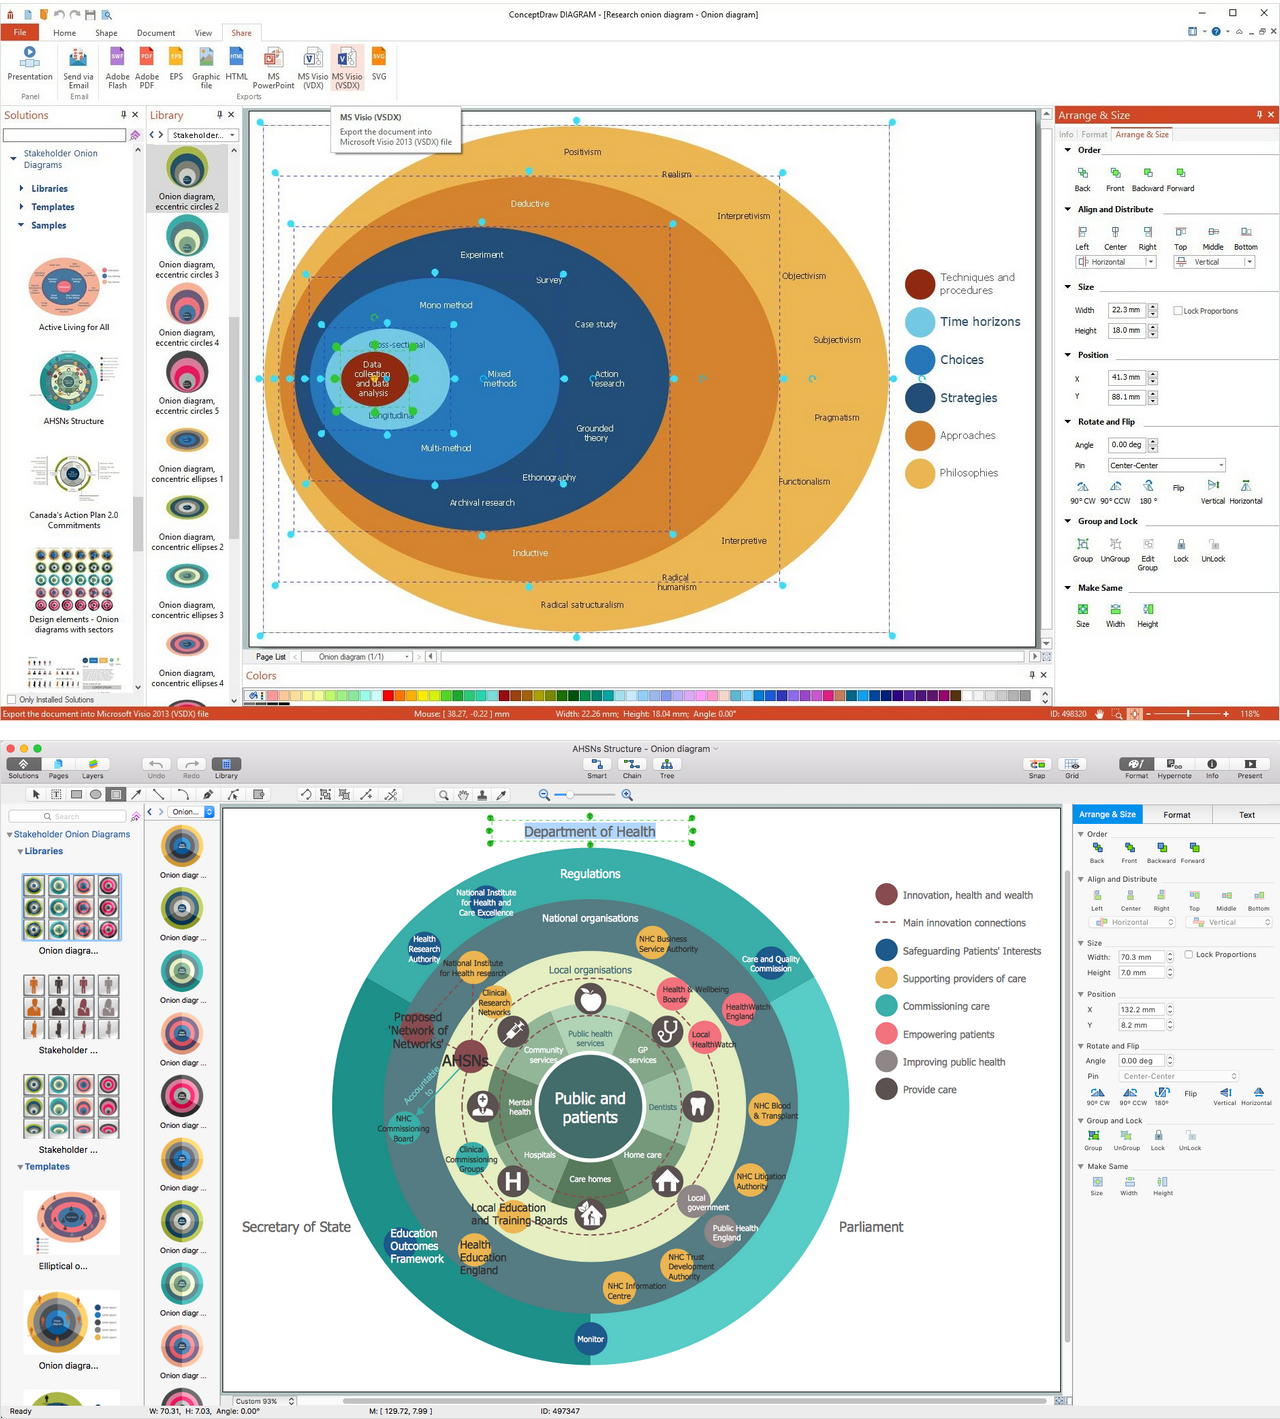
Example 1. Stakeholder Mapping Tool
Stakeholder mapping is a visual way to reveal and show stakeholders of a project with their relationships, attributes, and other information. Stakeholder Onion Diagrams Solution makes the ConceptDraw DIAGRAM software the best stakeholder mapping tool thanks to the number of predesigned samples, examples and templates, and also 3 libraries containing 91 vector objects:
- Onion Diagrams with Sectors library contains 30 shapes of onion diagrams divided into sectors.
- Stakeholder Icons library contains 41 icons for drawing onion diagrams.
- Stakeholder Onion Diagrams library contains 20 shapes of onion diagram.

Example 2. Stakeholder Onion Diagrams Solution in ConceptDraw STORE
Now you don't need to be an artist, all these tools are the real help for self-dependent drawing and stakeholder mapping. All that you need is to start with ready template from ConceptDraw STORE, make your own Stakeholder Onion Diagrams on the base of predesigned samples, or follow the next simple steps to make your diagram at new blank ConceptDraw document:
- drag the desired onion diagram object from the library to the document, or simply double-click its icon at the library to automatically place it at the center of your document;
- make needed changes with concentric rings - you can select, move, resize, or even remove the diagram segments;
- add the text on your diagram, type the title and change the colors, if needed.

Example 3. Stakeholder Onion Diagram - Active Living For All
The samples you see on this page were created in ConceptDraw DIAGRAM software using the unique stakeholder mapping tool - the Stakeholder Onion Diagrams Solution for ConceptDraw Solution Park. An experienced user spent 10 minutes creating each of them.
Use the Stakeholder Onion Diagrams Solution for ConceptDraw DIAGRAM software for fast and easy creation your own professional looking Stakeholder Onion diagrams and maps of any complexity.
All source documents are vector graphic documents. They are available for reviewing, modifying, or converting to a variety of formats (PDF file, MS PowerPoint, MS Visio, and many other graphic formats) from the ConceptDraw STORE. The Stakeholder Onion Diagrams Solution is available for all ConceptDraw DIAGRAM users.
TEN RELATED HOW TO's:
If you have a premise, or a studio and you want to start your own business, catering might be perfect for you. You can see a cafe floor plan as an example of possible usages of the free space on the floor. Obviously, you can rearrange it in any plausible way.
This cafe floor plan was created with a help of ConceptDraw solution for Cafe and Restaurant Floor Plans. Working under the design of interiors plans for cafe, commonly cause various creative and architectural issues. Primarily, cafe floor plan and interior design must be nice and at the same time comfortable for customers. Developing a floor plan and interior conception for cafe involve various elements that can be found out in the ConceptDraw Cafe and Restaurant Floor Plan solution. This sample drawing may be used as a template while proceeding to design a particular cafe. This sample plan can help to select furniture most suitable for cafe's guest rooms or cuisine. Also, this drawing may be handy as a requirements list of a furnishing and accessories necessary for the new cafe.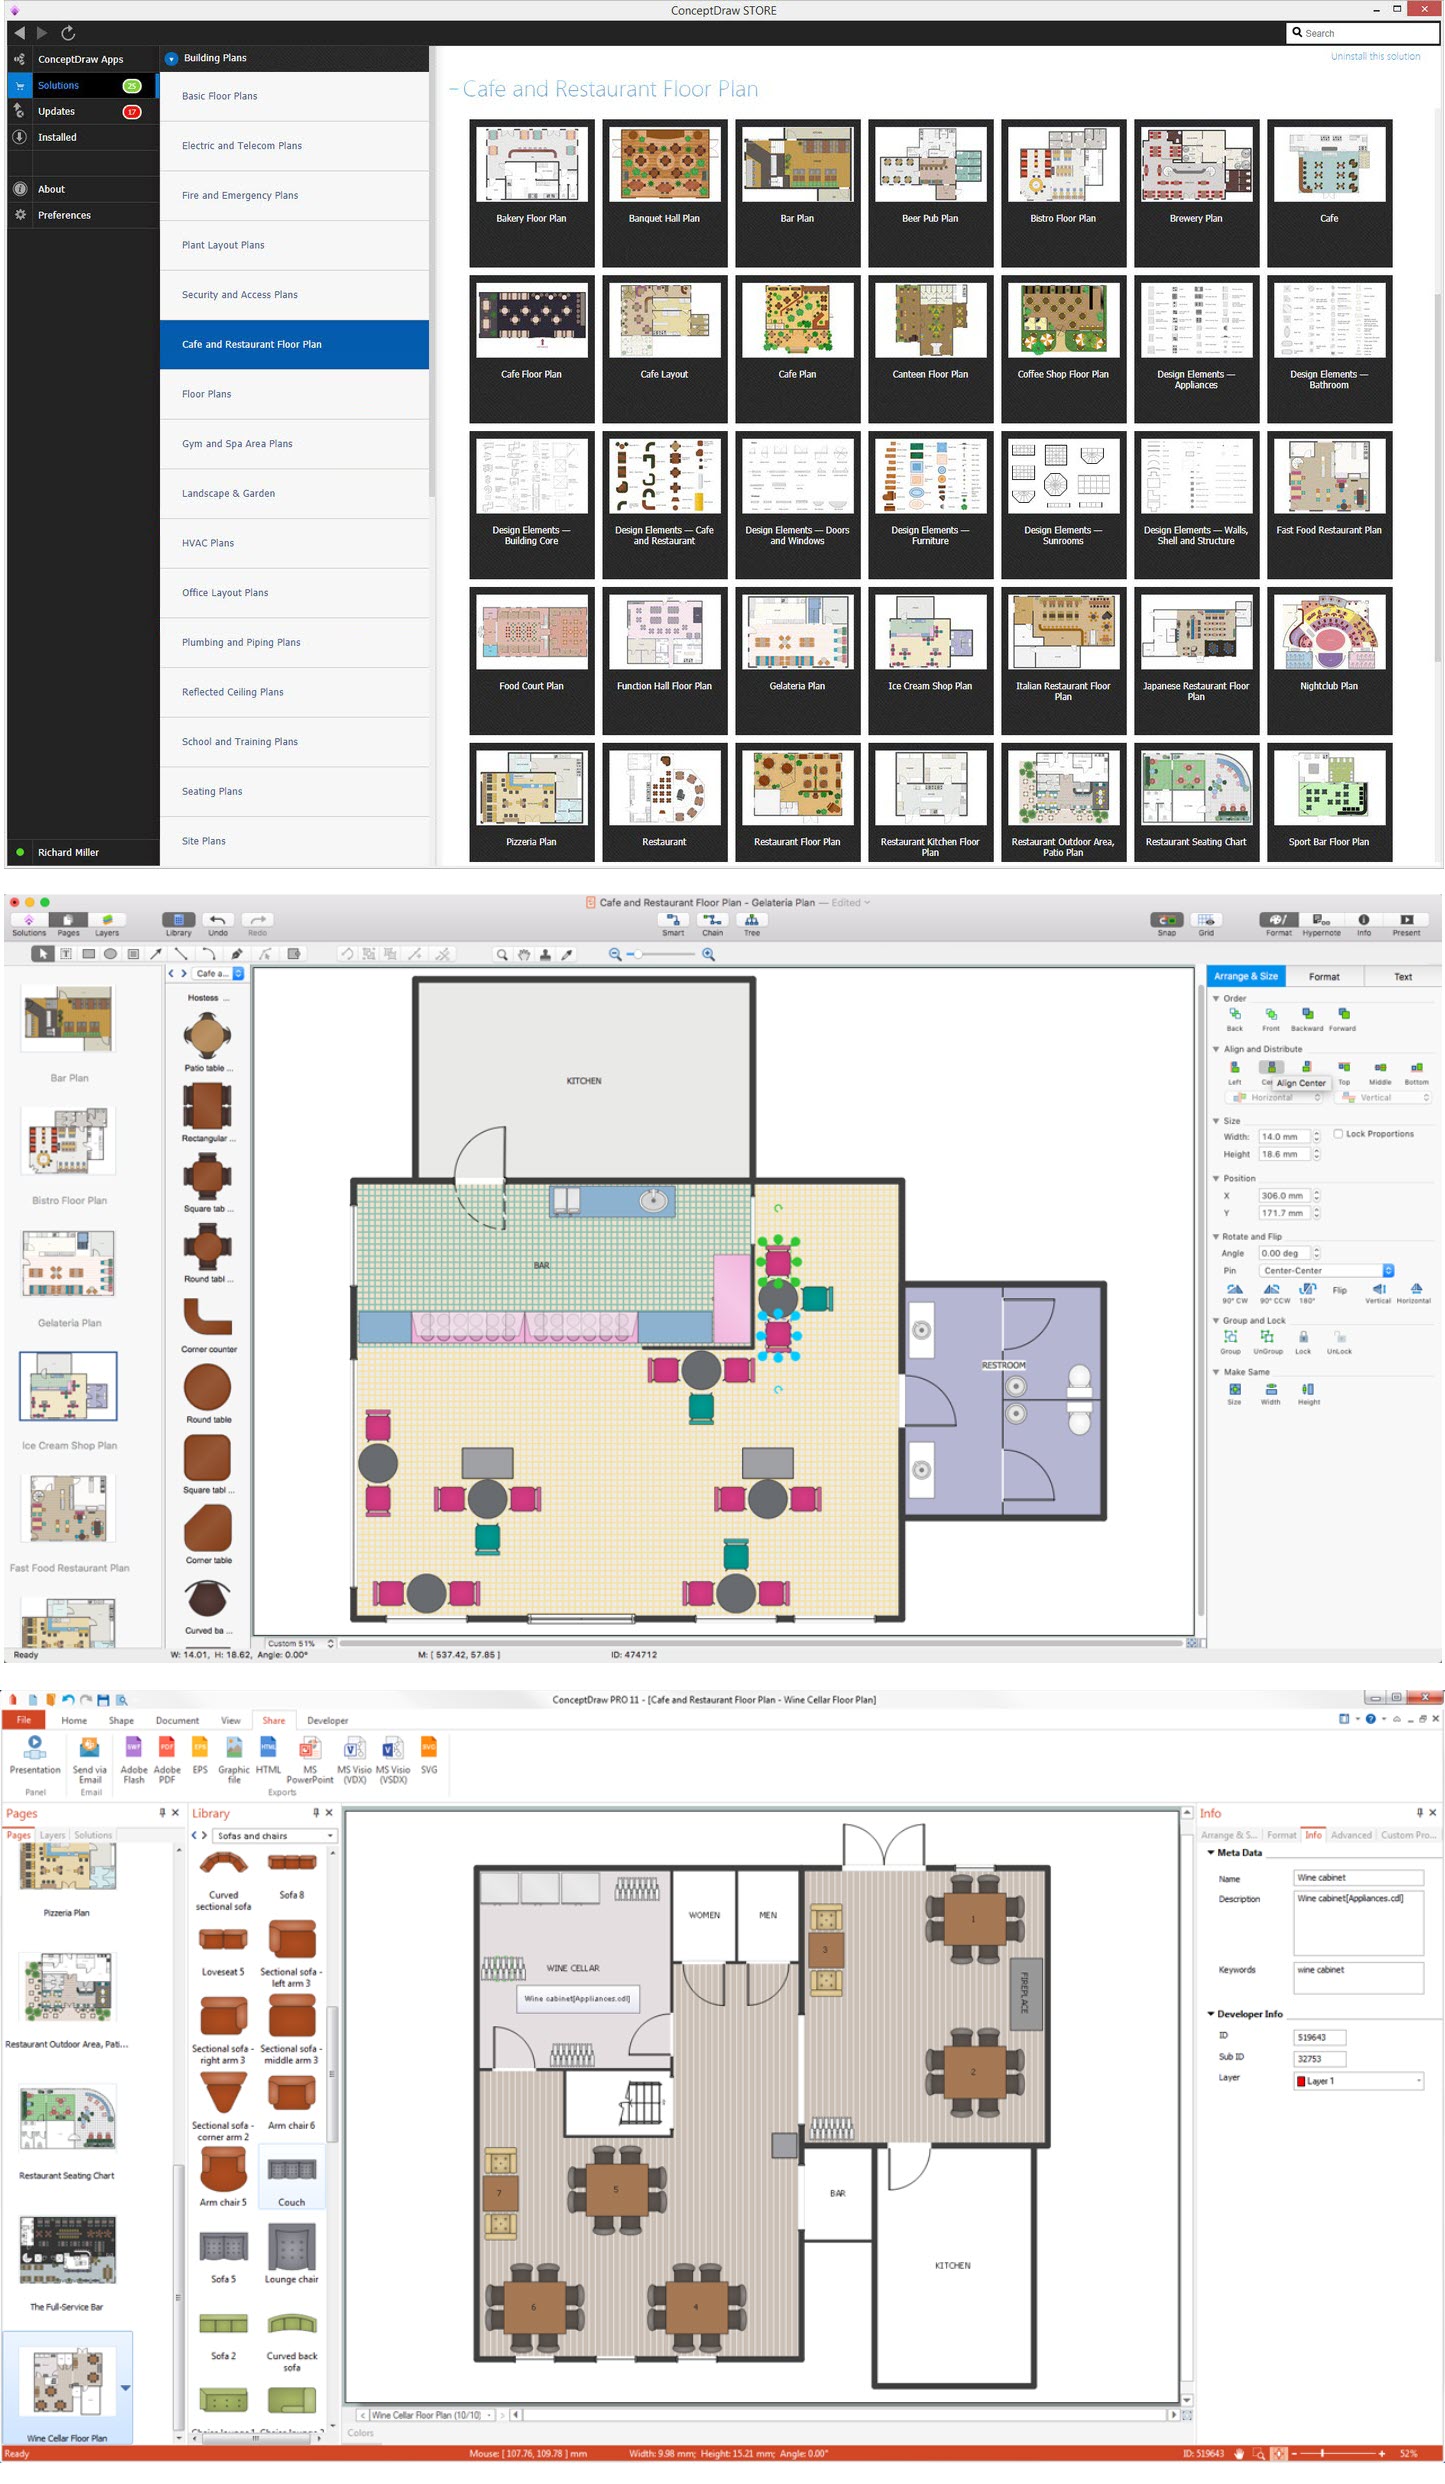
Picture: Café Floor Plan Example
Related Solution:
ConceptDraw DIAGRAM is a powerful intelligent vector graphics tool for drawing flowcharts.
Picture: Basic Diagramming Flowchart Software
Related Solution:
Those triangles within any technical analysis are known to be the chart patterns that can be commonly found in the price charts of the financially traded assets, such as stocks, futures, bonds, etc. The pattern is known to be deriving its name from the fact that it is characterized by some contraction in a price range being the converged trend lines, giving it a triangular shape.
Picture: Pyramid Diagram
Related Solution:
Create with our data flow diagram software perfect data flow diagrams. Download data flow diagram software for FREE. Use hundreds of data flow diagram examples.
Picture: Collaboration in a Project Team
The excellent possibility to create attractive Cross Functional Flowcharts for step-by-step visualization the operations of a business process flow of any degree of detailing is offered by ConceptDraw’s Cross-Functional Flowcharts solution. The extensive selection of commonly used vector cross functional flowchart symbols allow you to demonstrate the document flow in organization, to represent each team member’s responsibilities and how processes get shared or transferred between different teams and departments.
Picture: Cross Functional Flowchart Symbols
Related Solution:
Sales process engineering is a complex and labour-intensive process which requires a lot of time, efforts, and powerful software. We recommend to use the ConceptDraw DIAGRAM software enhanced with Sales Flowcharts solution from the Marketing area of ConceptDraw Solution Park. It gives the possibility to easy illustrate all sales process steps and their results.
Picture: Sales Process Steps
Related Solution:
To see how your business can improve you can try data visualization software solutions that allows you visualize all your sales KPI in one sales dashboard allows you monitor and analyse sales activities.
Picture: Data Visualization Software Solutions
How should diagramming software work? The answer is - Fast and easy.
Tree- mode drawing works like that. Just select objects in your drawing and press Tree or Chain button to connect all of them just in one click.
Your diagram looks professional and it took only a moment to draw.
Picture: ConceptDraw Arrows10 Technology
VSM symbols are the best for a production process designing. The entire Value Stream Mapping method uses a graphical representation of the manufacturing process, factors' pros and cons, that all stakeholders can easily understand. Value Stream Mapping is a graphical technique that provides possibilities to improve analysis of a manufacturing process, at the stage of the transferring information or materials that required to deliver a product or service to the customer.
Picture: Value Stream Mapping Symbols
Related Solution:
The Soccer solution for ConceptDraw DIAGRAM includes also a wide collection of templates and samples to help the soccer specialists and fans to draw any soccer-related diagrams and schemas as quickly as possible.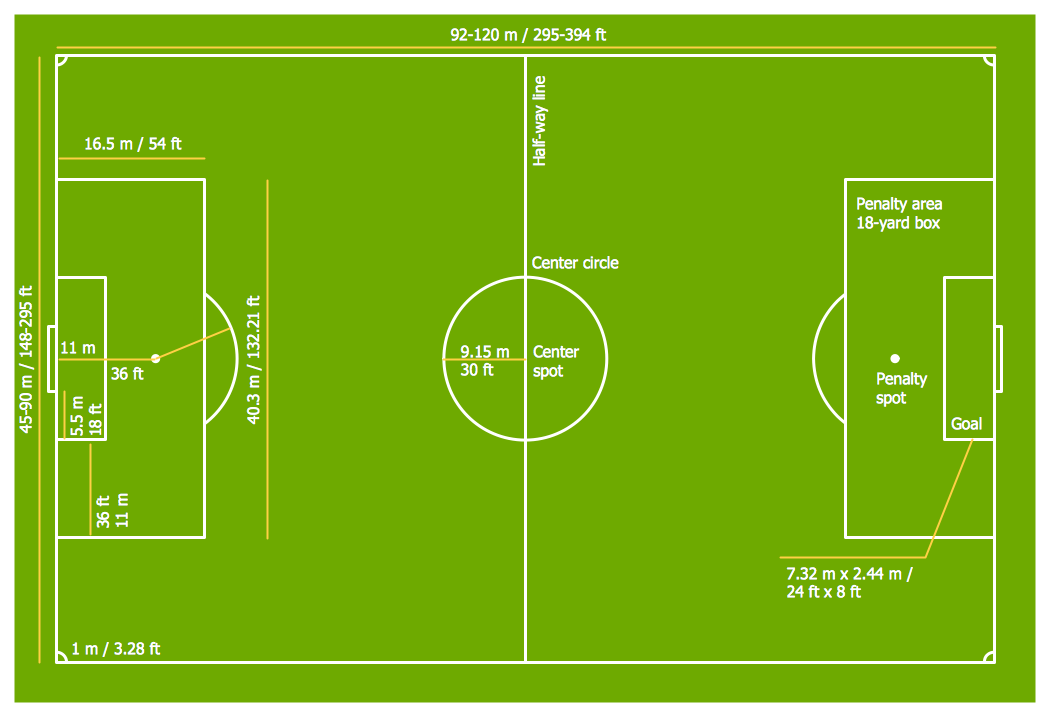
Picture: Soccer (Football) Field Templates
Related Solution:
