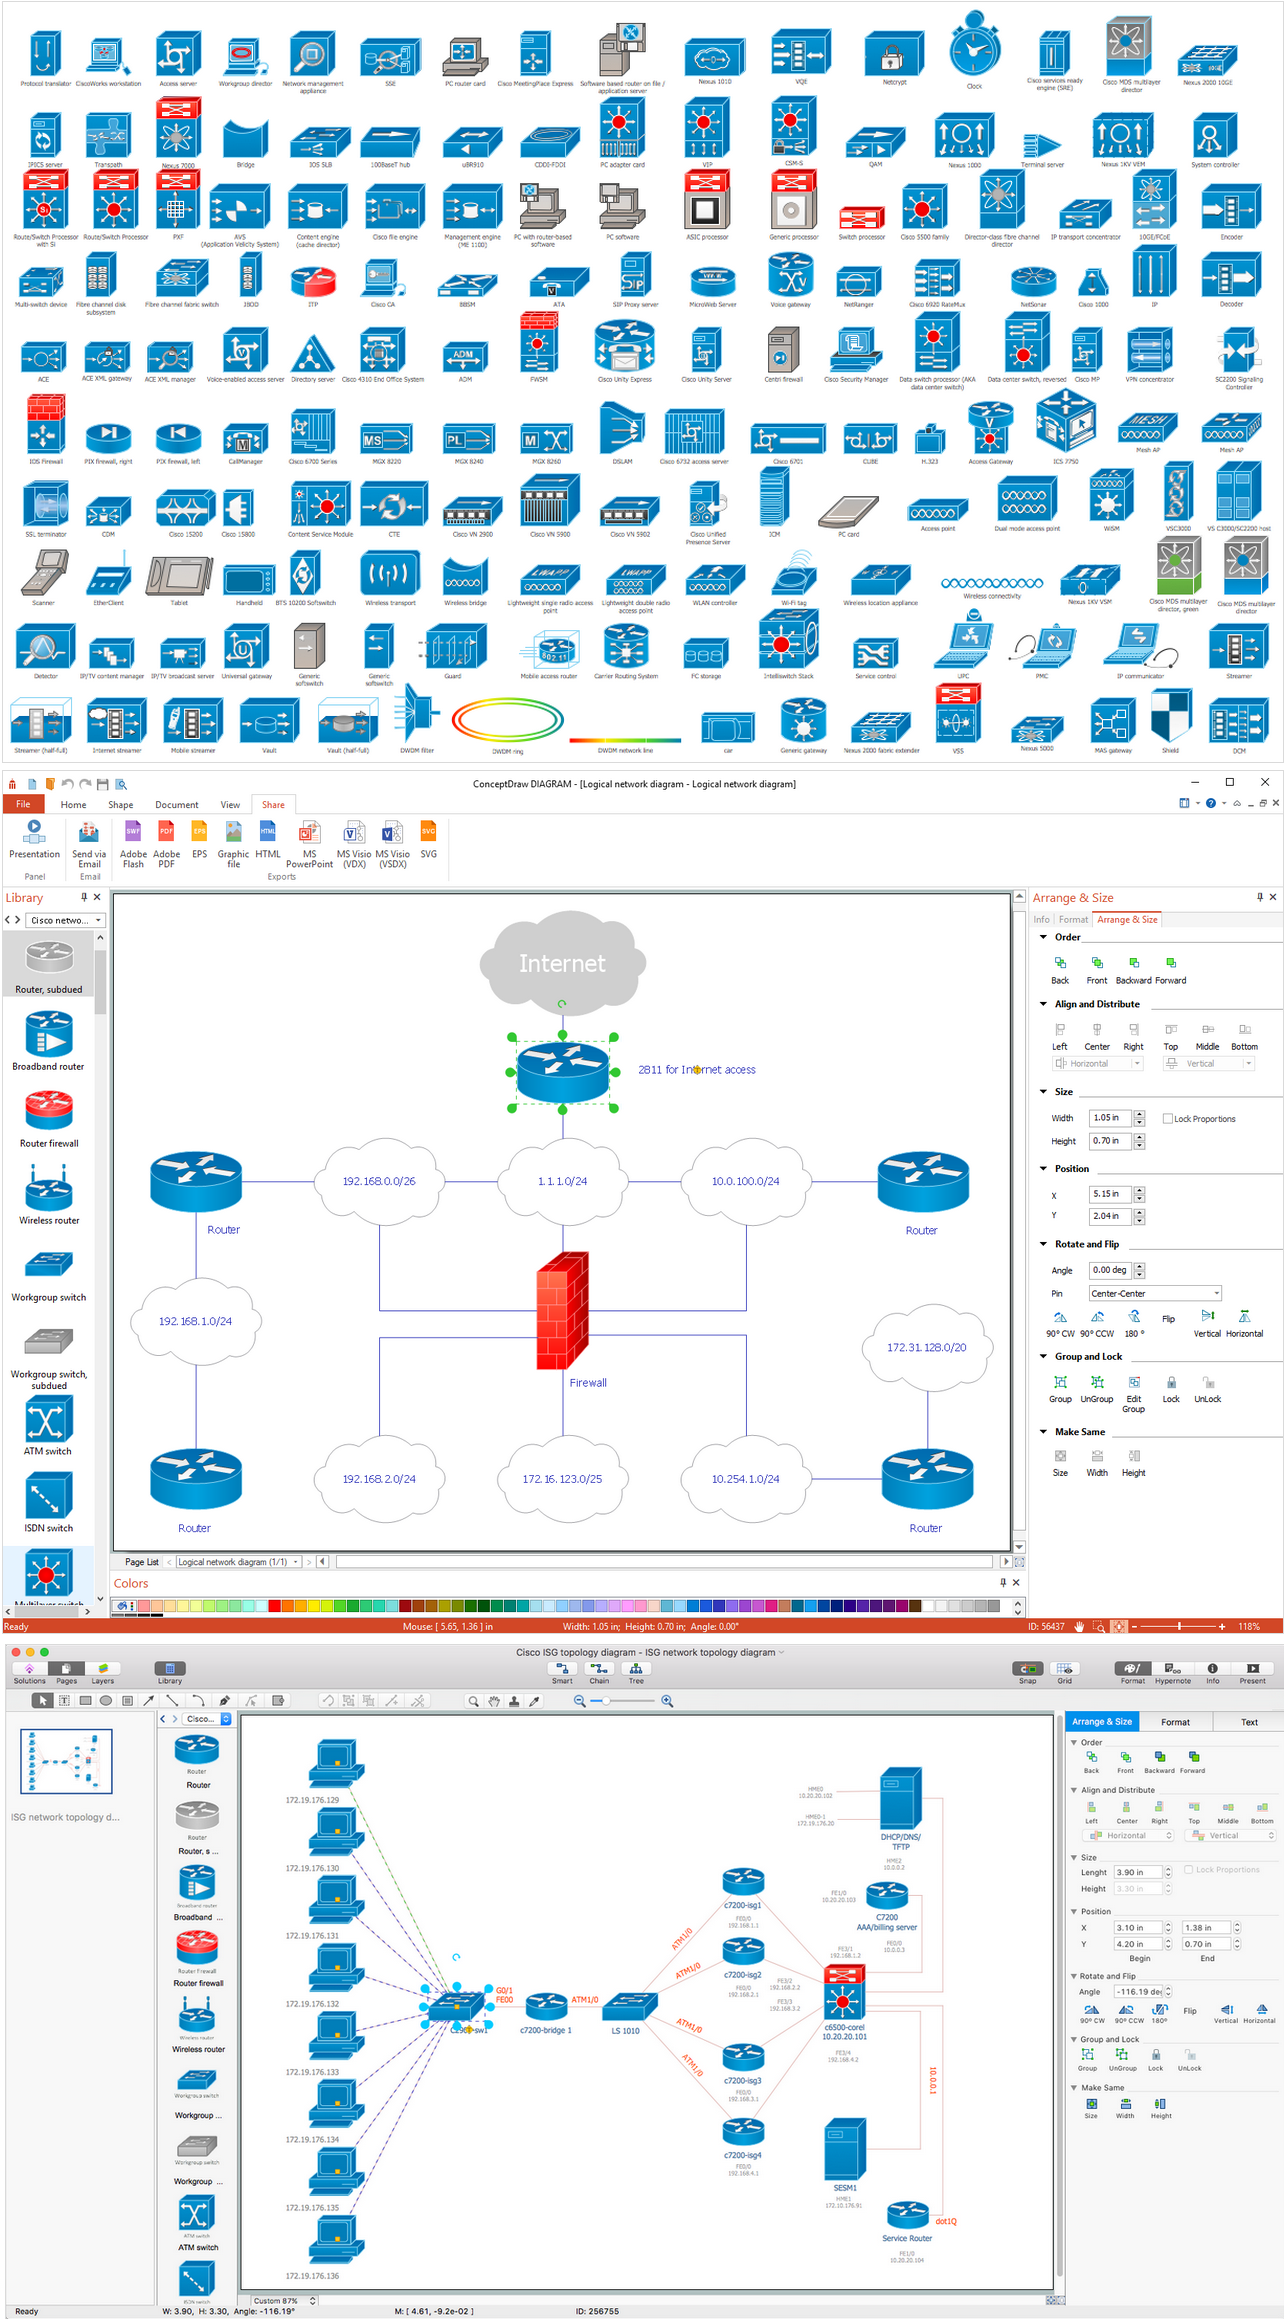
Pic.1. Network Diagramming Software. Cisco Network Diagrams symbols
ConceptDraw Cisco Network Diagrams solution provides 15 libraries containing 508 cisco objects for drawing the Cisco network diagrams:
- Cisco Buildings
- Cisco IBM
- Cisco LAN
- Cisco Media
- Cisco Multimedia, Voice, Phone
- Cisco Network Topology
- Cisco Optical
- Cisco People
- Cisco Products Additional
- Cisco Routers
- Cisco Security
- Cisco Switches and Hubs
- Cisco Telepresence
- Cisco Video Surveillance
- Cisco WAN

Use these libraries of design elements to visualize topology and design of Cisco networks.
Design Cisco Network Diagrams
The example depicts a network topology built using Cisco Express Forwarding (CEF) technology. This switching technology is used in large core networks or over the Internet to enhance the overall network performance.
Pic.2. Cisco Network Topology Diagram
The network topology depicted in this sample was built using the Cisco Intelligent Services Gateway (ISG). Using predesigned Cisco icons from the libraries listed above you can produce complex network diagrams that adhere to the accepted standards of Cisco drawings.
Pic.3. Cisco ISG Topology Diagram
This sample shows a diagram depicting a LAN fault-tolerance system. Using ConceptDraw libraries you can access a wide array of Cisco network icons, so you can quickly prototype a new network or document an existing one.
Pic.4. LAN Fault-Tolerance System Diagram
A network organization chart can be a great start for detailed network documentation, as well as serve as a visual instruction for new IT staff, or as a detailed illustration for a presentation. With ConceptDraw, you can create your own in minutes.
Pic.5. Network Organization Chart
The following features make ConceptDraw DIAGRAM the best Network Diagramming Software:
- You don't need to be an artist to draw professional looking diagrams in a few minutes.
- Large quantity of ready-to-use vector objects makes your drawing diagrams quick and easy.
- Great number of predesigned templates and samples give you the good start for your own diagrams.
- ConceptDraw DIAGRAM provides you the possibility to use the grid, rules and guides. You can easily rotate, group, align, arrange the objects, use different fonts and colors to make your diagram exceptionally looking.
- All ConceptDraw DIAGRAM documents are vector graphic files and are available for reviewing, modifying, and converting to a variety of formats: image, HTML, PDF file, MS PowerPoint Presentation, Adobe Flash, MS Visio.
- Using ConceptDraw STORE you can navigate through ConceptDraw Solution Park, managing downloads and updates. You can access libraries, templates and samples directly from the ConceptDraw STORE.
- If you have any questions, our free of charge support is always ready to come to your aid.
TEN RELATED HOW TO's:
Activity on Node Network Diagramming Tool - Activity Network and Project Evaluation and Review Technique, or PERT, charts are a way of documenting and analyzing the tasks in a project.
This sample shows the Activity on node network diagramming method. It was created in ConceptDraw DIAGRAM diagramming and vector drawing software using the Seven Management and Planning Tools solution from the Management area of ConceptDraw Solution Park.
Picture: Activity on Node Network Diagramming Tool
Related Solution:
ConceptDraw DIAGRAM diagramming and vector drawing software extended with Computer Network Diagrams Solution from the Computer and Networks Area offers a set of useful tools, collection of templates, samples, and libraries of various computer symbols, computer devices icons, computer network icon for fast and easy drawing network computer diagrams and illustrations.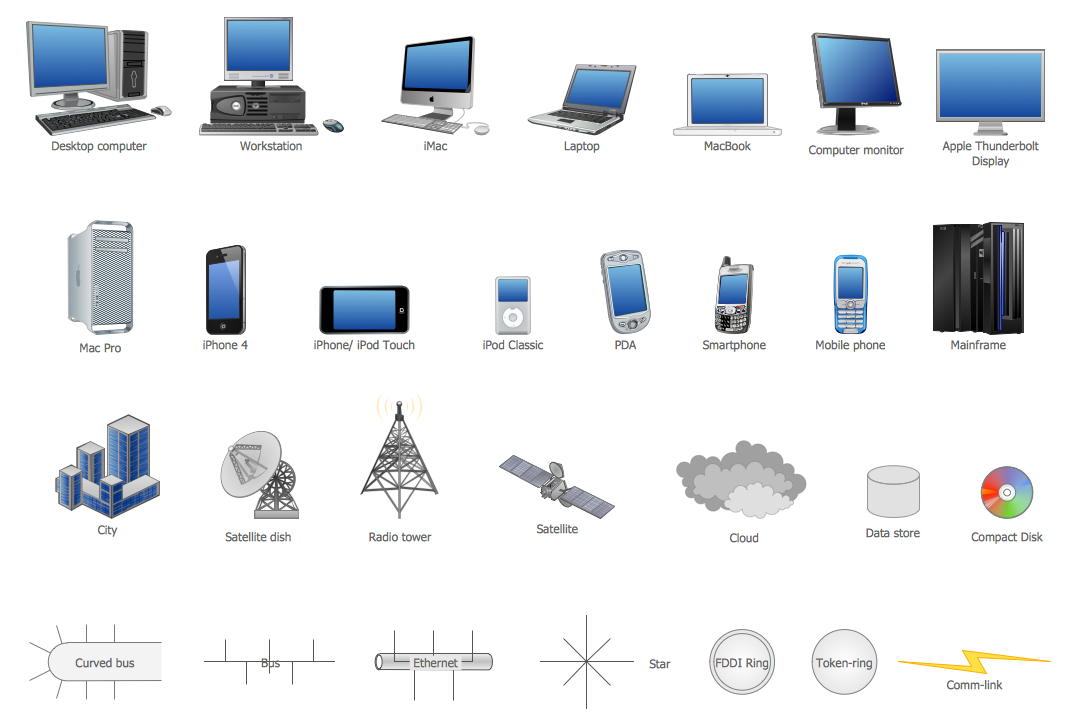
Picture: Network Icon
Related Solution:
The Enhanced Interior Gateway Routing Protocol (EIGRP) is a progressive distance-vector dynamic routing protocol. It was developed by the Cisco Systems and is available as an open standard from 2013.
EIGRP is used to help automate routing decisions and configuration of the computer network. It allows the routers of the same logical area automatically share route information.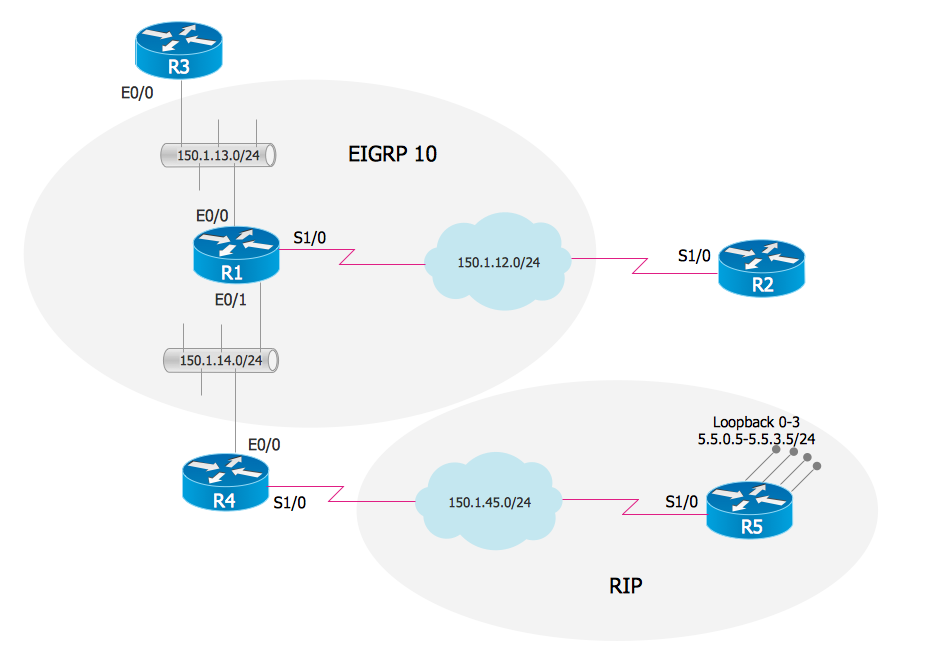
Picture: EIGRP. Computer and Network Examples
Related Solution:
The most easier way of creating the visually engaging and informative Sales Process Flowchart is to create the new ConceptDraw document and to use the predesigned vector symbols offered in 6 libraries of the Sales Flowchart Solution. There are more than six types of sales process flow diagrams, ConceptDraw DIAGRAM software is flowchart maker which include six collections of extended flowchart symbols for effective diagramming. There are main collections of color coded flowchart symbols: Sales Department, Sales Steps, Sales Workflow, Sales Symbols and special set of Sales Arrows and Sales Flowchart.
Picture: Sales Process Flowchart Symbols
Related Solution:
When trying to figure out the nature of the problems occurring within a project, there are many ways to develop such understanding. One of the most common ways to document processes for further improvement is to draw a process flowchart, which depicts the activities of the process arranged in sequential order — this is business process management. ConceptDraw DIAGRAM is business process mapping software with impressive range of productivity features for business process management and classic project management. This business process management software is helpful for many purposes from different payment processes, or manufacturing processes to chemical processes. Business process mapping flowcharts helps clarify the actual workflow of different people engaged in the same process. This samples were made with ConceptDraw DIAGRAM — business process mapping software for flowcharting and used as classic visio alternative because its briefly named "visio for mac" and for windows, this sort of software named the business process management tools.
This flowchart diagram shows a process flow of project management. The diagram that is presented here depicts the project life cycle that is basic for the most of project management methods. Breaking a project into phases allows to track it in the proper manner. Through separation on phases, the total workflow of a project is divided into some foreseeable components, thus making it easier to follow the project status. A project life cycle commonly includes: initiation, definition, design, development and implementation phases. Distinguished method to show parallel and interdependent processes, as well as project life cycle relationships. A flowchart diagram is often used as visual guide to project. For instance, it used by marketing project management software for visualizing stages of marketing activities or as project management workflow tools. Created with ConceptDraw DIAGRAM — business process mapping software which is flowcharting visio alternative or shortly its visio for mac, this sort of software platform often named the business process management tools.
Picture: Process Flowchart: A Step-by-Step Comprehensive Guide
Related Solution:
Use it to make professional looking documents, presentations, and websites illustrated with color scalable vector clipart for geography, weather, and animals.
Picture: How can you illustrate the weather condition
Drawing ISG Network Diagram using ConceptDraw DIAGRAM stencils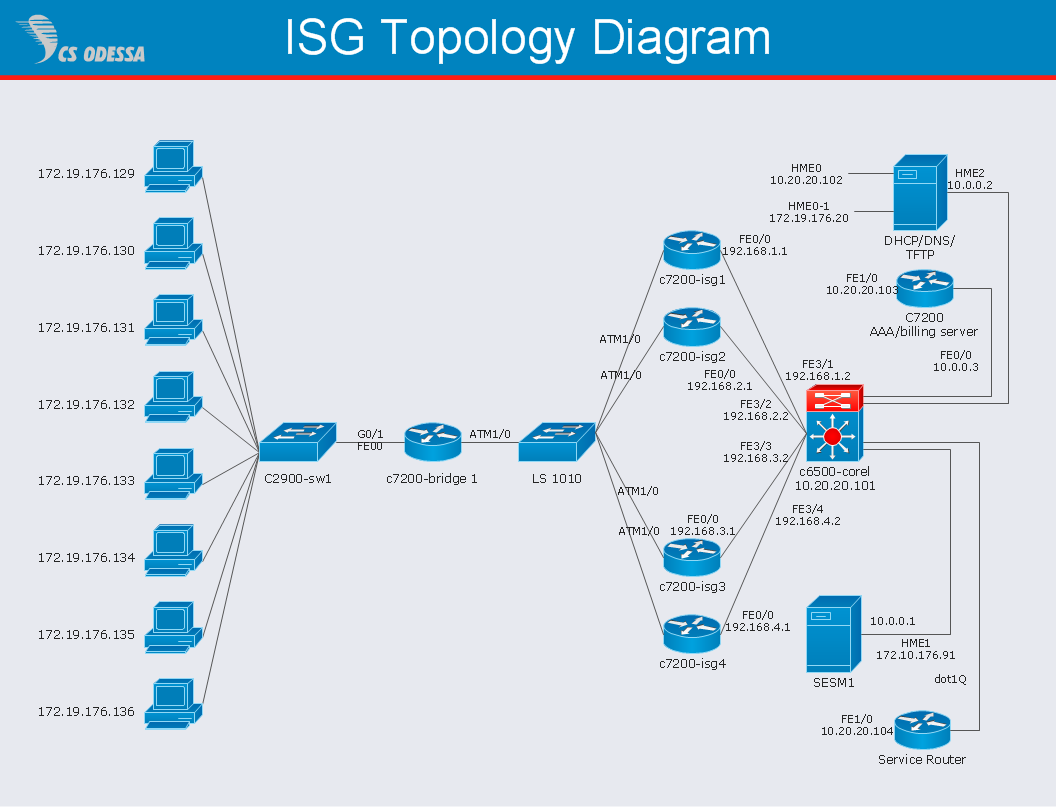
Picture: Network Diagram SoftwareISG Network Diagram
When studying a business process or system involving the transfer of data, it is common to use a Data Flow Diagram (DFD) to visualize how data are processed. Being initially used exclusively in regards to the flow of data through a computer system, now DFDs are employed as the business modeling tools. They are applied to describe the business events and interactions, or physical systems involving data storage and transfer. ConceptDraw DIAGRAM is a powerful Data Flow Diagram software thanks to the Data Flow Diagrams solution from the Software Development area of ConceptDraw Solution Park.
Picture: Data Flow Diagram Software
Related Solution:
Wireless Networks solution from ConceptDraw Solution Park extends ConceptDraw DIAGRAM diagramming and vector drawing software to help network engineers and designers efficiently design, create and illustrate WAN network diagram of any complexity. The ConceptDraw DIAGRAM software helps users to quickly transit from an idea to the implementation of a Wireless Network WAN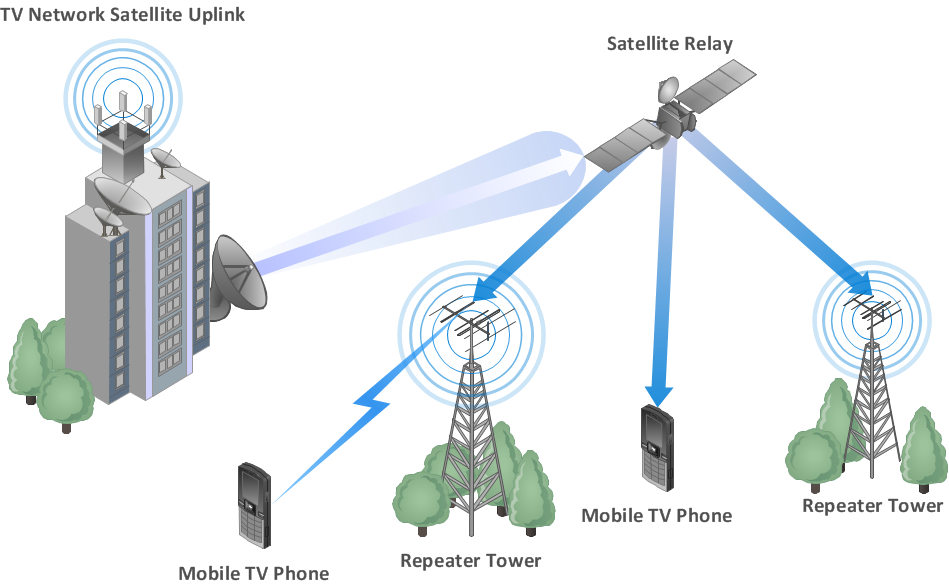
Picture: Wireless Network WAN
Related Solution:
Competitor analysis is a first and obligatory step in elaboration the proper corporate marketing strategy and creating sustainable competitive advantage. Use powerful opportunities of numerous solutions from ConceptDraw Solution Park for designing illustrative diagrams, charts, matrices which are necessary for effective competitor analysis.
Picture: Competitor Analysis
Related Solution:


