Entity-Relationship Diagram (ERD)
with ConceptDraw DIAGRAM
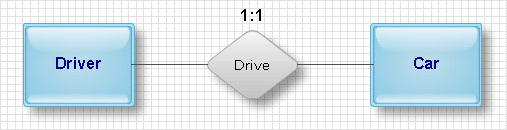
Entity-Relationship Diagram (ERD) serves for detailed description of structures and databases. An ERD represents a diagram made up mainly of rectangular blocks (for entities, or data) linked with relationships. The links between the blocks describe relations between these entities. There are three types of relationships:
- one-to-one,
- one-to-many,
- many-to-many.
For example, "driver drives a car". Here, the entity "driver" relates to the entity "car" by means of a one-to-one relationship "drives". One driver drives one car.
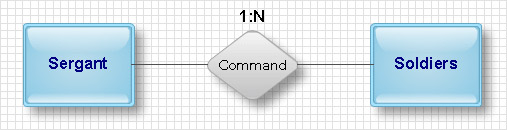
An example of a one-to-many relationship is a sergeant commanding a team of soldiers. Here the entity "sergeant" relates to a number of entities "soldier" by means of a one-to-many relationship.
Since the many-to-many relationship does not adequately represent the nature of interaction between entities, it is rarely used in diagrams, or is used in diagrams with little detail.
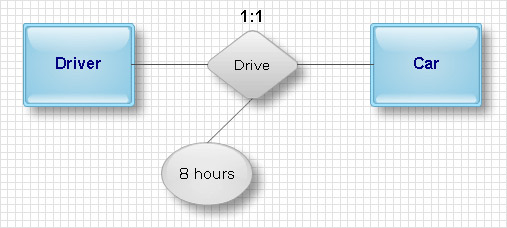
Entities and relationships can both have attributes. Example: a car from the first example has number; the "drives" relation may have quality attributes describing the quality of driving, or time attributes, saying when exactly the driver was driving the car.
ERDs are mainly used to describe database structures, though they might be used as diagrams describing a structure of a company, organization, or some business processes.
ConceptDraw DIAGRAM extended with Entity-Relationship Diagram (ERD) solution from the Software Development Area allows you to draw very complex and detailed ERD. It has a number of libraries with objects used in diagrams, which are included in relevant templates and samples available from ConceptDraw STORE.
 Solution in ConceptDraw STORE")
Example 1. Entity-Relationship Diagram (ERD) Solution in ConceptDraw STORE
In actual practice, ERDs employing the method of P.P. Chen are used most. Choose the Chen ERD template in ConceptDraw STORE. A new document will open along with the library with objects necessary to create a diagram. Drag the vector objects representing entities and relationships, and then just connect them between each other in the required order. Use respective library objects to indicate the types of relationships and their attributes.

Example 2. ERD WordPressFile Reference. Chen's Notation
One of advantages of ERD diagram drawn in ConceptDraw DIAGRAM is that when you move entities on the diagram, they stay connected and you don't need to move relationships too.
Apart from building a diagram manually, ConceptDraw has a built-in tool for drawing an ERD automatically, from a database.

Example 3. Entity Relationship Model Diagram. Crow's Foot Notation
The samples you see on this page were created in ConceptDraw DIAGRAM using the Entity-Relationship Diagram (ERD) Solution and demonstrate some of solution's capabilities and the results you can achieve.
All source documents are vector graphic documents. They are available for reviewing, modifying, or converting to a variety of formats (PDF file, MS PowerPoint, MS Visio, and many other graphic formats) from the ConceptDraw STORE. The Entity-Relationship Diagram (ERD) Solution is available for all ConceptDraw DIAGRAM or later users.
TEN RELATED HOW TO's:
Any business process consists from a number of tasks carrying out the certain business goal. It is useful to diagram business processes to ensure that they are as foolproof, logical and sequential as possible. This business process diagram describes a typical booking process flow by the example of a cab booking process. It can be used as a roadmap for any booking system implementation. Diagramming a business process allows you to look at the entire project and take into account all types of possible scenarios. Business process diagram helps you investigate and clarify the process thoroughly so that you can find out how it can be improved. Business process diagram supports team communications by ensuring that each process element is clear and everyone in the team is on the same page.
Sometimes your company brings you less profit than you expect it to be, and it’s difficult to reveal the causes. Maybe it’s time to learn new technologies, because business diagram are easily developed by means of special software, so you won’t make any extra effort. In return, you will increase your productivity and get more done in a less time.
Picture: Business Diagram Software
Related Solutions:
Interior design is an art of planning and coordinating the space in a building or on a floor to produce a charming and convenient environment for the client. You can ask professionals for help, or you can create floor plans easily with ConceptDraw DIAGRAM , using diverse libraries or altering numerous templates. You don’t need no formal training anymore to be a designer, isn’t it great?
Using a ConceptDraw DIAGRAM floor plan software makes depicting of home or office layout ideas a simple task. It does not require special skills to make detailed and scaled floor plans. Adding furniture to design interior is also a breeze. You can draw and furnish your floor plans with a floor plan software. Moreover, using software for floor planning you gain an opportunity to share your plans and high-resolution images of your designs with clients or stakeholders.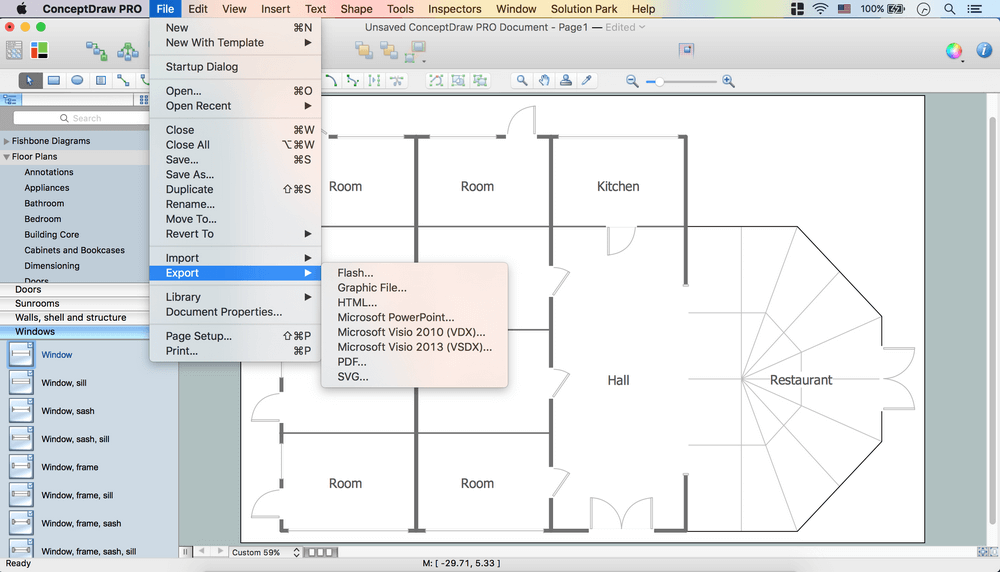
Picture:
Create Floor Plans Easily
with ConceptDraw DIAGRAM Floor Design Software
Related Solution:
Use it to make professional looking documents, presentations, and websites illustrated with color scalable vector clipart for geography, weather, and animals.
Picture: How can you illustrate the weather condition
A competent delegation of responsibilities between workers guarantees business success in most cases. At first sight, it might seem that workflow diagram symbols are quite similar to a regular flowchart. But workflow diagram is a more accurate way to present working processes.
Workflow diagrams are helpful for a working process analyzation, to depict a pathway of process issues, personalize responsibilities and identify resources that will help to optimize a workflow. Generally, Workflow diagram deploys flowchart symbols for displaying work process steps and relationships. But, often it require some additions and improvements to become more professional and illustrative. The Workflow solution for ConceptDraw DIAGRAM provides the user with a big library of symbols that are designed especially for workflow diagrams.
Picture: Workflow Diagram Symbols
Related Solution:
ConceptDraw DIAGRAM software enhanced with Organizational charts solution is an essential tool to ✔️ show the internal structure of an organization, ✔️ outline the hierarchy, ✔️ display key roles or job titles, ✔️ show relationships among employees or departments, ✔️ facilitate communication and cooperation, ✔️ visualize reporting relationships
Picture: Organization Chart Software: A Comprehensive Guide
Related Solution:
This sample shows the Business Report Pie Chart. The Pie Chart visualizes the data as the proportional parts of a whole, illustrates the numerical proportion. Pie Charts are very useful in the business, statistics, analytics, mass media.
Picture: Business Report Pie. Pie Chart Examples
Related Solution:
Jackson System Development (JSD) is a linear method of system development created by Michael A. Jackson and John Cameron in the 1980s. It comprises the whole software life cycle directly or providing a framework for more specialized techniques.
When implementing the Jackson System Development method and designing JSD diagrams, you can succesfully use the powerful and helpful tools of ConceptDraw DIAGRAM software extended with Entity-Relationship Diagram (ERD) solution from the Software Development area of ConceptDraw Solution Park.
Picture: JSD - Jackson system development
Related Solution:
A flowchart can take any process and distil it into a series of actions or decisions; it is a versatile and simple form of diagram that can be used to describe situations in any field, and is easily understood by everyone. They are used frequently in business to document workflows from all areas of a company - they can show accounting purchase orders, human resource recruitment strategy, or a product life cycle.
ConceptDraw DIAGRAM diagramming and vector drawing software extended with Flowcharts Solution from the Diagrams Area of ConceptDraw Solution Park is a perfect powerful tool for extremely easy designing professional looking Flow Diagram.
Picture: Flow Diagram
Related Solution:
Visual navigation through the stages of a response process helps you locate specific actions to be taken via Action Mind Maps. Use ConceptDraw DIAGRAM and ConceptDraw MINDMAP for organize the process of response for interactions occurring in social media.
Picture: Create Response Charts
Related Solution:
A pie chart or a circle graph is a circular chart divided into sectors, illustrating numerical proportion. In a pie chart, the arc length of each sector and consequently its central angle and area, is proportional to the quantity it represents.
Pie chart examples and templates created using ConceptDraw DIAGRAM software helps you get closer with pie charts and find pie chart examples suite your needs.
Picture: Pie Chart Examples and Templates
Related Solution:
 Solution in ConceptDraw STORE")
