"Project status report" mind map sample is created using ConceptDraw MINDMAP mind mapping software. This mind map example helps to learn how to use remote mind map presentation via Skype for online team collaboration in project management.
Use this mindmap example for implementation of Remote Presentation for Skype solution from ConceptDraw Solution Park.
TEN RELATED HOW TO's:
A full-featured project management solution with all the necessary functions right at your fingertips. Generates an extensive variety of reports on project and task statuses.
These videos provide a series of lessons that will enhance the understanding of all our users, from people just starting out with the software, through to expert users.
Picture: Project — Working With Tasks
The best way to visualize the introduction to Cloud computing architecture is to create diagrams and schematics representing what is a cloud computing and how it works. For their design, we recommend to use a powerful ConceptDraw DIAGRAM diagramming and vector drawing software supplied with Cloud Computing Diagrams solution from the Computers and Network area of ConceptDraw Solution Park
Picture: Introduction to Cloud Computing Architecture
Related Solution:
Create flowcharts, organizational charts, bar charts, line graphs, and more with ConceptDraw DIAGRAM.
Picture: Basic Diagramming
Related Solution:
How to design a Bubble Chart? It’s very easy! All that you need is a powerful software. Never before creation of a Bubble Chart wasn’t so easy as now with tools of Business Diagrams Solution from the Management Area for ConceptDraw Solution Park.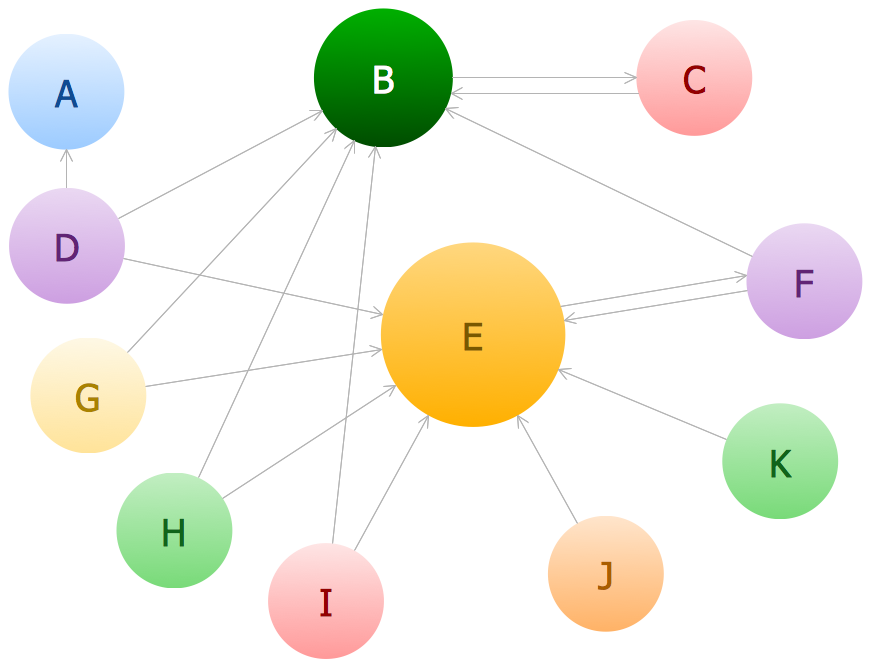
Picture: Bubble Chart
Related Solution:
While creating flowcharts and process flow diagrams, you should use special objects to define different statements, so anyone aware of flowcharts can get your scheme right. There is a short and an extended list of basic flowchart symbols and their meaning. Basic flowchart symbols include terminator objects, rectangles for describing steps of a process, diamonds representing appearing conditions and questions and parallelograms to show incoming data.
This diagram gives a general review of the standard symbols that are used when creating flowcharts and process flow diagrams. The practice of using a set of standard flowchart symbols was admitted in order to make flowcharts and other process flow diagrams created by any person properly understandable by other people. The flowchart symbols depict different kinds of actions and phases in a process. The sequence of the actions, and the relationships between them are shown by special lines and arrows. There are a large number of flowchart symbols. Which of them can be used in the particular diagram depends on its type. For instance, some symbols used in data flow diagrams usually are not used in the process flowcharts. Business process system use exactly these flowchart symbols.
Picture: Flowchart Symbols: Meaning and Examples
Related Solution:
Analyze the root causes of factors that influence the problem. A diagram is constructed separately for each high priority factor.
Identify the root causes for a factor and then list possible corrective action.
The diagram displays the structure of causes for a factor and possible corrective actions.
The Root Cause Tree Diagram is used for further formulation of actions.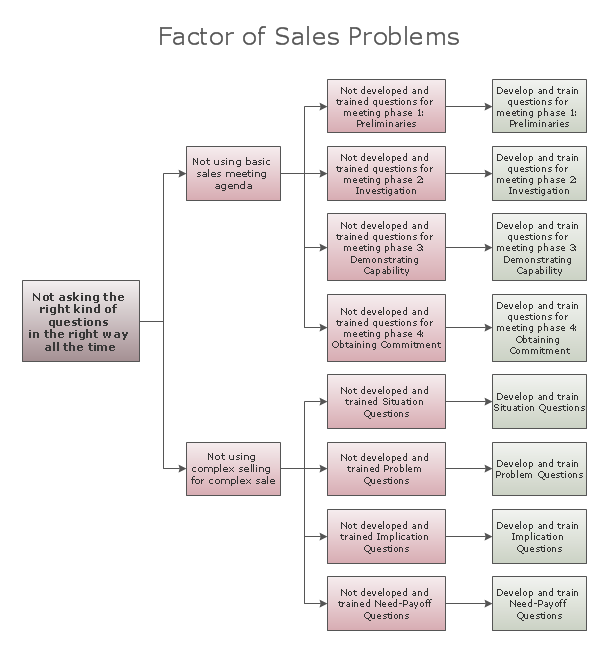
Picture: Root Cause Tree Diagram
Related Solution:
As restaurant industry is growing rapidly nowadays, researches show that almost half of the adults have worked in a restaurant or a cafe. Moreover, many of them dream to start their own someday. Unfortunately, it takes a lot of time to write a business plan and to find a great location, although some know how to create a restaurant floor plan in minutes or how to plan budget effortlessly. Hiring employees can also cause a lot of headache, but this is crucial for further success, because every guest comes to restaurant for a good service and delicious food. It is also worth noting that restaurant concept is also important, because it defines target audience and influences the menu.
This diagram represents the floor plan of an ongoing sports-theme establishment - restaurant, cafe, or other food service. A number of widescreen monitors installed along the perimeter provide visitors the opportunity to follow the course of a match from anywhere in the dining room of restaurant or cafe. The most of sports fans believe that food and alcohol is a big part of any sports show. That is why the dining room takes the most space - almost 60% of the total establishment space. Nearly all sports fans consume beverages while watching sports - beer, soda or water at least. Thus, the restaurant floor plan designers added a large lavatory there. Moreover, project developers considered unnecessary the gender division of such delicate place - perhaps they guess that only men are watching football, or believe that alcohol will eliminate the most of gender differences.
Picture: How To Create Restaurant Floor Plan in Minutes
Related Solution:
Fishbone, Ishikawa or Cause and Effect diagram helps understand the reasons of completed or potential actions by structuring their causes in smaller categories. Also, one can use it to see how the contributing factors are related to each other. In everyday company routine, a Cause and Effect diagram is helpful with a number of regular activities like brainstorming, project management, and problem solving.
How to Construct a Fishbone Diagram? Construction a Fishbone diagram in professional diagramming software ConceptDraw DIAGRAM is more easy than you think. Just use the predesigned vector elements from the Fishbone Diagrams library for Fishbone Diagrams solution or one of plenty Fishbone templates and examples, and you will get a Cause and Effect diagram in minutes.
Picture: How to Construct a Fishbone Diagram
Related Solution:
ConceptDraw DIAGRAM is a powerful business and technical diagramming software tool that enables you to design professional-looking graphics, diagrams, flowcharts, floor plans and much more in just minutes. Maintain business processes performance with clear visual documentation. Effectively present and communicate information in a clear and concise manner with ConceptDraw DIAGRAM.
Picture: ConceptDraw DIAGRAM
All Gantt charts were made using ConceptDraw PROJECT. ConceptDraw PROJECT works both on Windows and Mac OS X. It allows to schedule a voluntary number of projects in a single Workspace document and lets easily share tasks and resources among them. ConceptDraw PROJECT shares files among Windows and Mac OS X.
Picture: Gantt chart examples
