
Example 1. SWOT Analysis - Athletic Shoe Company
SWOT analysis is a method of strategic planning which identifies the factors internal and external environment of the firm and divides them into 4 categories:
- Strengths are company's resources and capabilities that can be used as a basis for developing a competitive advantage.
- Weaknesses are the competitive capabilities absence may be viewed as a weakness.
- Opportunities are the external environment may reveal certain new opportunities for profit and growth.
- Threats are changes in the external environmental also may present threats to the firm.

Example 2. SWOT Analysis
The SWOT and TOWS Matrix Diagrams Solution contains easy-to-use templates, samples and examples that help identify Strengths, Weaknesses, Opportunities, and Threats using ConceptDraw DIAGRAM software.
Use SWOT and TOWS analysis to plan strategic actions for your company, department, team, project, process, marketing campaign, or even self-improvement with help of ConceptDraw DIAGRAM

Example 3. SWOT Analysis Positioning Matrix
The samples you see on this page were created in ConceptDraw DIAGRAM using the tools of SWOT and TOWS Matrix Diagrams Solution. These TOWS matrices successfully demonstrate solution's capabilities and professional results you can achieve. An experienced user spent 10 minutes creating every of these samples.
All source documents are vector graphic documents. They are available for reviewing, modifying, or converting to a variety of formats (PDF file, MS PowerPoint, MS Visio, and many other graphic formats) from the ConceptDraw STORE. The SWOT and TOWS Matrix Diagrams Solution is available for all ConceptDraw DIAGRAM or later users.
TEN RELATED HOW TO's:
ConceptDraw DIAGRAM diagramming and vector drawing software as a sequence diagram tool provides the Rapid UML Solution from the Software Development Area that contains the UML Sequence library.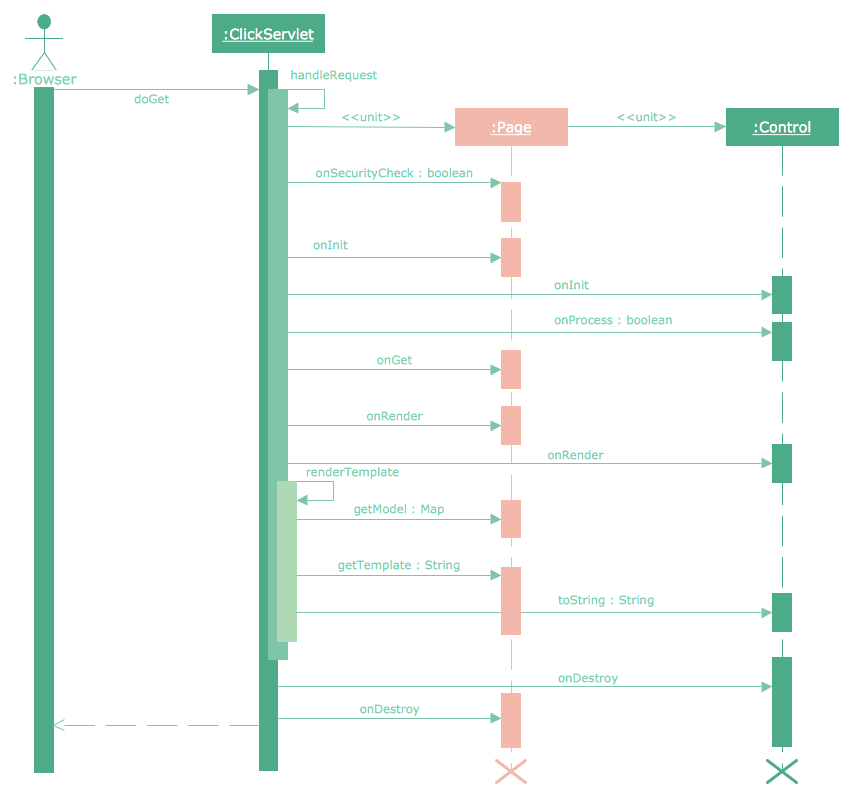
Picture: Sequence Diagram Tool
Related Solution:
Problem Solving - ConceptDraw OFFICT suite is a software for the problem solving. The Seven Management and Planning Tools solution is a set of such tools for investigating complex problems.
These tools are exemplary at organizing research, parsing complex problems, providing a structure for the details, helping managers make decisions, and organizing effective communications in a visual manner that keeps everyone involved.
Picture: Problem solving
The ConceptDraw Home Design Software extended with Floor Plans solution from the Building Plans area of ConceptDraw Solution Park offers the powerful tools which will help you in easy developing vivid and professional-looking: Building plans, Home plans, House designs, Floor plans, Home interior designs, Furniture and equipment layouts.
Picture: Home Design Software
Related Solution:
ConceptDraw DIAGRAM is a vector-based network diagramming software. Now it has powerful tools to draw 3D Network Diagrams.
Use more than 2 000 pre-designed 3D network elements for customizing your network diagrams. Computer & Networks solution allows you for design 3D LAN and WAN, schematic and wiring drawings.
Picture: 3D Network Diagram Software
Related Solution:
A pie chart or a circle graph is a circular chart divided into sectors, illustrating numerical proportion. In a pie chart, the arc length of each sector and consequently its central angle and area, is proportional to the quantity it represents.
Pie chart examples and templates created using ConceptDraw DIAGRAM software helps you get closer with pie charts and find pie chart examples suite your needs.
Picture: Pie Chart Examples and Templates
Related Solution:
ConceptDraw DIAGRAM software extended with the Ice Hockey Solution allows you to draw professional looking ice hockey diagrams in minutes. You can easily customize existing samples or produce you own ones.
Picture: Ice Hockey Diagram — Entering Offensive Zone Drill
Related Solution:
In the case of origin of an emergency is very important to have a correct, clear and comprehensible action plan which will help you to react quicker and to make right decisions. ConceptDraw DIAGRAM software extended with Fire and Emergency Plans solution from the Building Plans Area of ConceptDraw Solution Park provides extensive drawing tools for quick and easy creating fire and emergency plans, and also a set of various templates and samples, among them the Emergency Action Plan Template.
Picture: Emergency Action Plan Template
Related Solution:
ER-modeling nowadays is a very popular approach for database design. If you are tired of looking for a good entity relationship diagram Software for Mac, then your search is almost over. ConceptDraw DIAGRAM is a great tool for creating diagrams of any complexity with tons of editable samples and templates.
This diagram represents the vector library of the Chen’s and Crow’s Foot notation icons for drawing ERD (entity-relationships diagram). ConceptDraw Entity Relationship Diagram solution delivers the ability to visualize databases structure on both Mac and PC. The "bricks" entity-relationships models are the entity, and the relation. An entity is represented by a rectangle comprising the entity name. It means an object, information about which should be available and stored. A relation is intended to show a relations between two entities. There are several types of relations between entities. To show there are a number of different symbols for the types of relationships.
Picture: Entity Relationship Diagram Software for Mac
Related Solution:
Venn diagrams are illustrations used in the branch of mathematics known as set theory.
Use ConceptDraw DIAGRAM to quick and easy design your own Venn Diagram of any complexity.
Picture: Venn Diagram
Related Solution:
All Gantt charts were made using ConceptDraw PROJECT. ConceptDraw PROJECT works both on Windows and Mac OS X. It allows to schedule a voluntary number of projects in a single Workspace document and lets easily share tasks and resources among them. ConceptDraw PROJECT shares files among Windows and Mac OS X.
Picture: Gantt chart examples

