Metropolitan area networks (MAN). Computer and Network Examples
A Metropolitan Area Network (MAN) is a large computer network on the large geographical area that include several buildings or even the entire city (metropolis). The geographical area of the MAN is larger than LAN, but smaller than WAN. MAN includes many communicating devices and provides the Internet connectivity for the LANs in the metropolitan area.
MAN is used to combine into a network group located in different buildings into a single network. The diameter of such a network can range from 5 to 50 kilometers. As a rule, MAN does not belong to any particular organization, in most cases, a group of users or a provider who takes charge for the service own its connecting elements and other equipment. Level of service is agreed in advance and some warranties are discussed. MAN often acts as a high-speed network to allow sharing regional resources (like a big LAN). It is also often used to provide public available connection to other networks using a WAN connection. There are many ways of classifying networks. The main criterion for classification is considering the administration method. That is, depending on how the network is organized and how it is controlled, it can be attributed to local or distributed, metropolitan or WAN. or her A network administrator manages a network or it’s segment. Administration team activities are logged, and their rights and responsibilities are strictly divided if the network is complex. Computers can be connected using a variety of media access controllers: a twisted pair, optical conductors (optical cables) and via radio (wireless technology). Wired optical connections are usually established via Ethernet, wireless - through Wi-Fi, Bluetooth, GPRS and other protocols. Private LAN may be linked to other local area networks through gateways, as well as being part of a global computer network (eg, the Internet), or have a connection to it.
Computer and Networks Area for ConceptDraw DIAGRAM provides professional looking examples, the libraries with ready-to-use predesigned vector stencils to help you create anyone computer network diagrams quick, easy and effective.

Example 1. Metropolitan area networks (MAN). Computer and Network Examples
This example was created in ConceptDraw DIAGRAM using the Computer and Networks Solution of ConceptDraw Solution Park and shows the Metropolitan Area Network.

Example 2. Computer and Networks solution. Computer and Network examples
The MAN can be used to provide services including telecoms, Internet access, television and CCTV to businesses and citizens in these metropolitan areas.
The diagrams designed with ConceptDraw DIAGRAM are vector graphic documents and are available for reviewing, modifying, and converting to a variety of formats (image, HTML, PDF file, MS PowerPoint Presentation, Adobe Flash or MS Visio).
See also Samples:
TEN RELATED HOW TO's:
A Virtual network is a computer network that consists of virtual network links, i.e. between the computing devices there isn't a physical connection.
Well known forms of network virtualization are virtual networks based on the virtual devices (for example the network based on the virtual devices inside a hypervisor), protocol-based virtual networks (VLAN, VPN, VPLS, Virtual Wireless network, etc.) and their combinations.
This example was created in ConceptDraw DIAGRAM using the Computer and Networks Area of ConceptDraw Solution Park and shows the Virtual network.
Picture: Virtual networks. Computer and Network Examples
Related Solution:
ConceptDraw MINDMAP - an excellent tool for exporting mind maps to PowerPoint to visualize and presenting your project. You can simply generate, change, update your mindmap and then make a presentation in PowerPoint.
Picture: How To Do A Mind Map In PowerPoint
Related Solution:
A network diagram represents the set of computers and network devices and the connections among them. This scheme can be developed for any institution or establishment. To illustrate this concept let’s take for example, a hotel network topology diagram or a school network diagram. These diagrams depict access points, servers, workstations, firewalls and another equipment needed to provide a network.
On this masterpiece drawing one will see a simple scheme a of connecting computers together. Such form of connecting can be applied for a hotel, guest house, bungalow, hut or something else. This diagram shows the images of the real LAN components. So, it represents a physical category of a network construction. It looks similar to a star - so this network configuration is named a star topology. The typical feature of this construction is a center point - usually it is hub, or router. The rays of this star means network connections. Computers, peripherals and other network details are placed on the ends of the star rays.
Picture: Hotel Network Topology Diagram
Related Solution:
For documenting the Cloud Computing Architecture with a goal to facilitate the communication between stakeholders are successfully used the Cloud Computing Architecture diagrams. It is convenient and easy to draw various Cloud Computing Architecture diagrams in ConceptDraw DIAGRAM software with help of tools of the Cloud Computing Diagrams Solution from the Computer and Networks Area of ConceptDraw Solution Park.
Picture: Cloud Computing Architecture Diagrams
Related Solution:
A Venn diagram, sometimes referred to as a set diagram, is a diagramming style used to show all the possible logical relations between a finite amount of sets. Having ConceptDraw DIAGRAM software one allows anyone who cares for their drawings to look not only nice but also smart and professional.
Picture:
Venn Diagram Examples for Problem Solving
Computer Science. Chomsky Hierarchy
Related Solution:
ConceptDraw DIAGRAM is the best software for illustration the network topologies. It's very easy and quickly to design the network topology diagrams of any kinds and complexity in ConceptDraw DIAGRAM diagramming and vector drawing software using the Computer and Networks solution from Computer and Networks area of ConceptDraw Solution Park.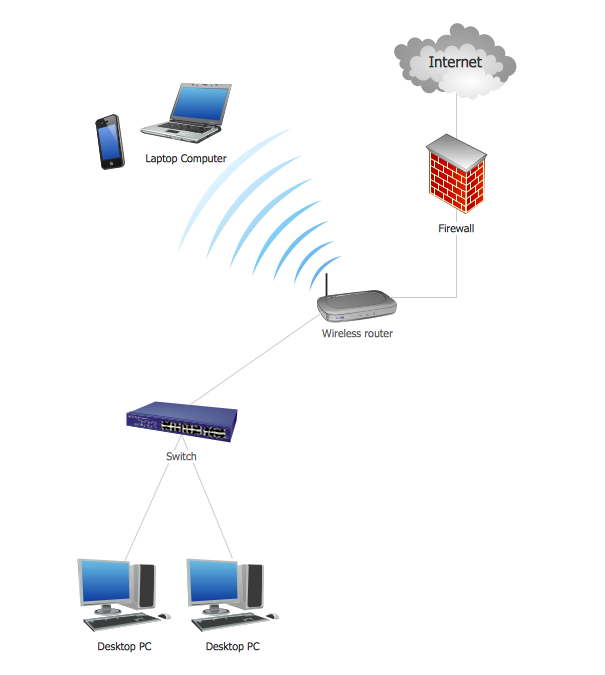
Picture: Network Topology Illustration
Related Solution:
ConceptDraw DIAGRAM is perfect for software designers and software developers who need to draw Computer&Network Diagrams.
ConceptDraw has 1004 vector stencils in the 40 libraries that helps you to start using software for designing own Network Diagrams. You can use the appropriate stencils from Computer and Network Diagrams library with 56 objects..png)
Picture: Design Element: Computer and Networkfor Network Diagrams
Related Solution:
This sample was created in ConceptDraw DIAGRAM diagramming and vector drawing software using the Computer and Networks solution from Computer and Networks area of ConceptDraw Solution Park.
This sample shows the Point-to-point network topology.
Network topology is the topological structure of the computer network.
Point-to-point network topology is a simple topology that displays the network of exactly two hosts (computers, servers, switches or routers) connected with a cable. Point-to-point topology is widely used in the computer networking and computer architecture.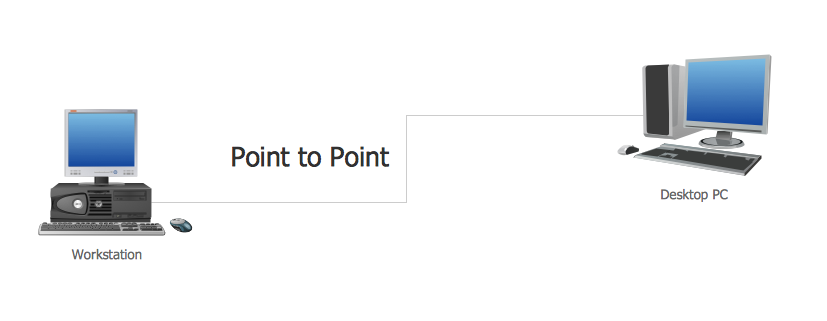
Picture: Point to Point Network Topology
Related Solution:
When trying to figure out the nature of the problems occurring within a project, there are many ways to develop such understanding. One of the most common ways to document processes for further improvement is to draw a process flowchart, which depicts the activities of the process arranged in sequential order — this is business process management. ConceptDraw DIAGRAM is business process mapping software with impressive range of productivity features for business process management and classic project management. This business process management software is helpful for many purposes from different payment processes, or manufacturing processes to chemical processes. Business process mapping flowcharts helps clarify the actual workflow of different people engaged in the same process. This samples were made with ConceptDraw DIAGRAM — business process mapping software for flowcharting and used as classic visio alternative because its briefly named "visio for mac" and for windows, this sort of software named the business process management tools.
This flowchart diagram shows a process flow of project management. The diagram that is presented here depicts the project life cycle that is basic for the most of project management methods. Breaking a project into phases allows to track it in the proper manner. Through separation on phases, the total workflow of a project is divided into some foreseeable components, thus making it easier to follow the project status. A project life cycle commonly includes: initiation, definition, design, development and implementation phases. Distinguished method to show parallel and interdependent processes, as well as project life cycle relationships. A flowchart diagram is often used as visual guide to project. For instance, it used by marketing project management software for visualizing stages of marketing activities or as project management workflow tools. Created with ConceptDraw DIAGRAM — business process mapping software which is flowcharting visio alternative or shortly its visio for mac, this sort of software platform often named the business process management tools.
Picture: Process Flowchart: A Step-by-Step Comprehensive Guide
Related Solution:
The Ishikawa diagram, Cause and Effect diagram, Fishbone diagram — all they are the names of one and the same visual method for working with causal connections. Originally invented by Kaoru Ishikawa to control the process quality, the Ishikawa diagram is well proven in other fields of management and personal scheduling, events planning, time management. It is a chart in the form of a fish, whose head is a problem, the fins are variants for its causes.
To design easily the Fishbone diagram, you can use a special ConceptDraw DIAGRAM vector graphic and diagramming software which contains the powerful tools for Fishbone diagram problem solving offered by Fishbone Diagrams solution for the Management area of ConceptDraw Solution Park.
Picture: Fishbone Diagram Problem Solving
Related Solution: