Virtual networks.
Computer and Network Examples
A Virtual network is a computer network that consists of virtual network links, i.e. between the computing devices there isn't a physical connection.
Well known forms of network virtualization are virtual networks based on the virtual devices (for example the network based on the virtual devices inside a hypervisor), protocol-based virtual networks (VLAN, VPN, VPLS, Virtual Wireless network, etc.) and their combinations.
VLAN (Virtual LAN) is a logical LAN (local area network) based on the physical LAN that is divided on a multiple logical LANs using a VLAN ID.
VLAN can be on a VPN (virtual private network). VPN consists of several remote end-points (such as routers, VPN gateways of software clients) that are connected by the tunnel over another network. Two connected end points form the PTP VPN (Point to Point Virtual Private Network), more than two end points form a Multipoint VPN.
VPLS (Virtual Private LAN Service) is a specific type of Multipoint VPN. They can be Transparent LAN Services (TLS) that provides geographic separation and Ethernet Virtual Connection Services (EVCS) that provides geographic separation and VLAN subnetting.
Virtual Wireless network is a set of Wireless Access Points that behaves as one.
Computer and Networks Area for ConceptDraw DIAGRAM provides professional looking examples, the libraries with ready-to-use predesigned vector stencils to help you create the Virtual Networks quick, easy and effective.

Example 1. Virtual network.
This example was created in ConceptDraw DIAGRAM using the Computer and Networks Area of ConceptDraw Solution Park and shows the Virtual network.
The diagrams designed with ConceptDraw DIAGRAM are vector graphic documents and are available for reviewing, modifying, and converting to a variety of formats (image, HTML, PDF file, MS PowerPoint Presentation, Adobe Flash or MS Visio).
See also Samples:
TEN RELATED HOW TO's:
ConceptDraw DIAGRAM diagramming and vector drawing software is a powerful network mapper thanks to the extensive drawing tools of Network Layout Floor Plans Solution from the Computer and Networks Area.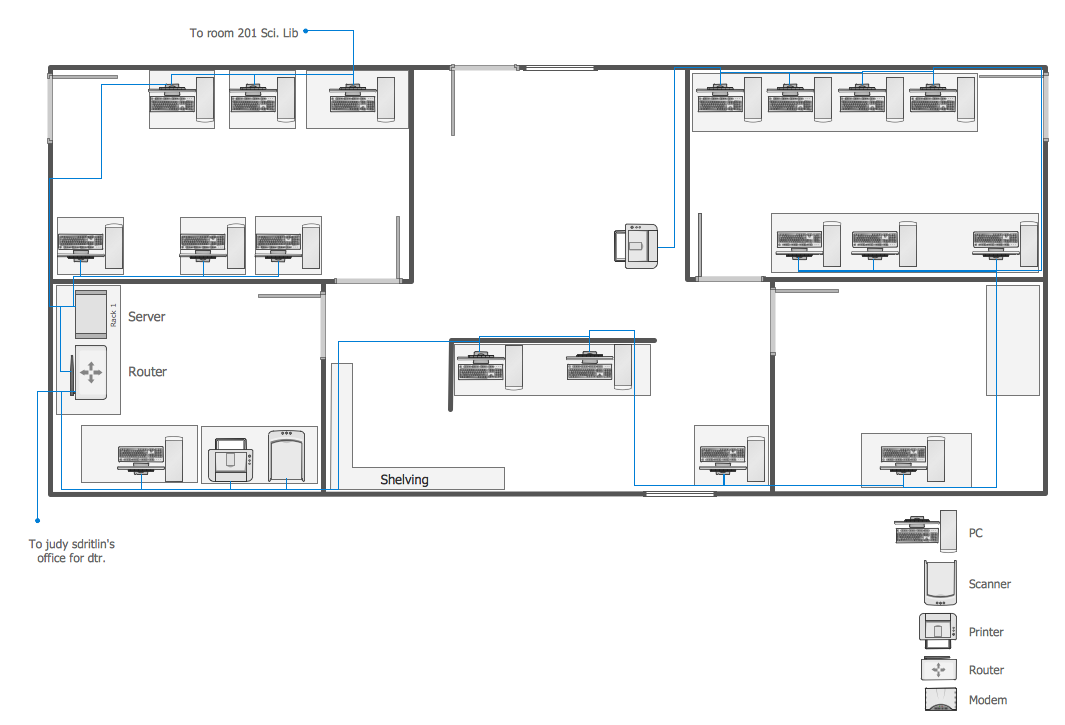
Picture: Network Mapper
Related Solution:
This sample was created in ConceptDraw DIAGRAM diagramming and vector drawing software using the Computer and Networks solution from Computer and Networks area of ConceptDraw Solution Park.
A complete (fully connected) topology is a network topology in which there is a direct link between all pairs of nodes. In a fully connected network with n nodes, there are n(n-1)/2 direct links. Networks designed with this topology are usually very expensive to set up, but provide a high degree of reliability due to the multiple paths for data that are provided by the large number of redundant links between nodes.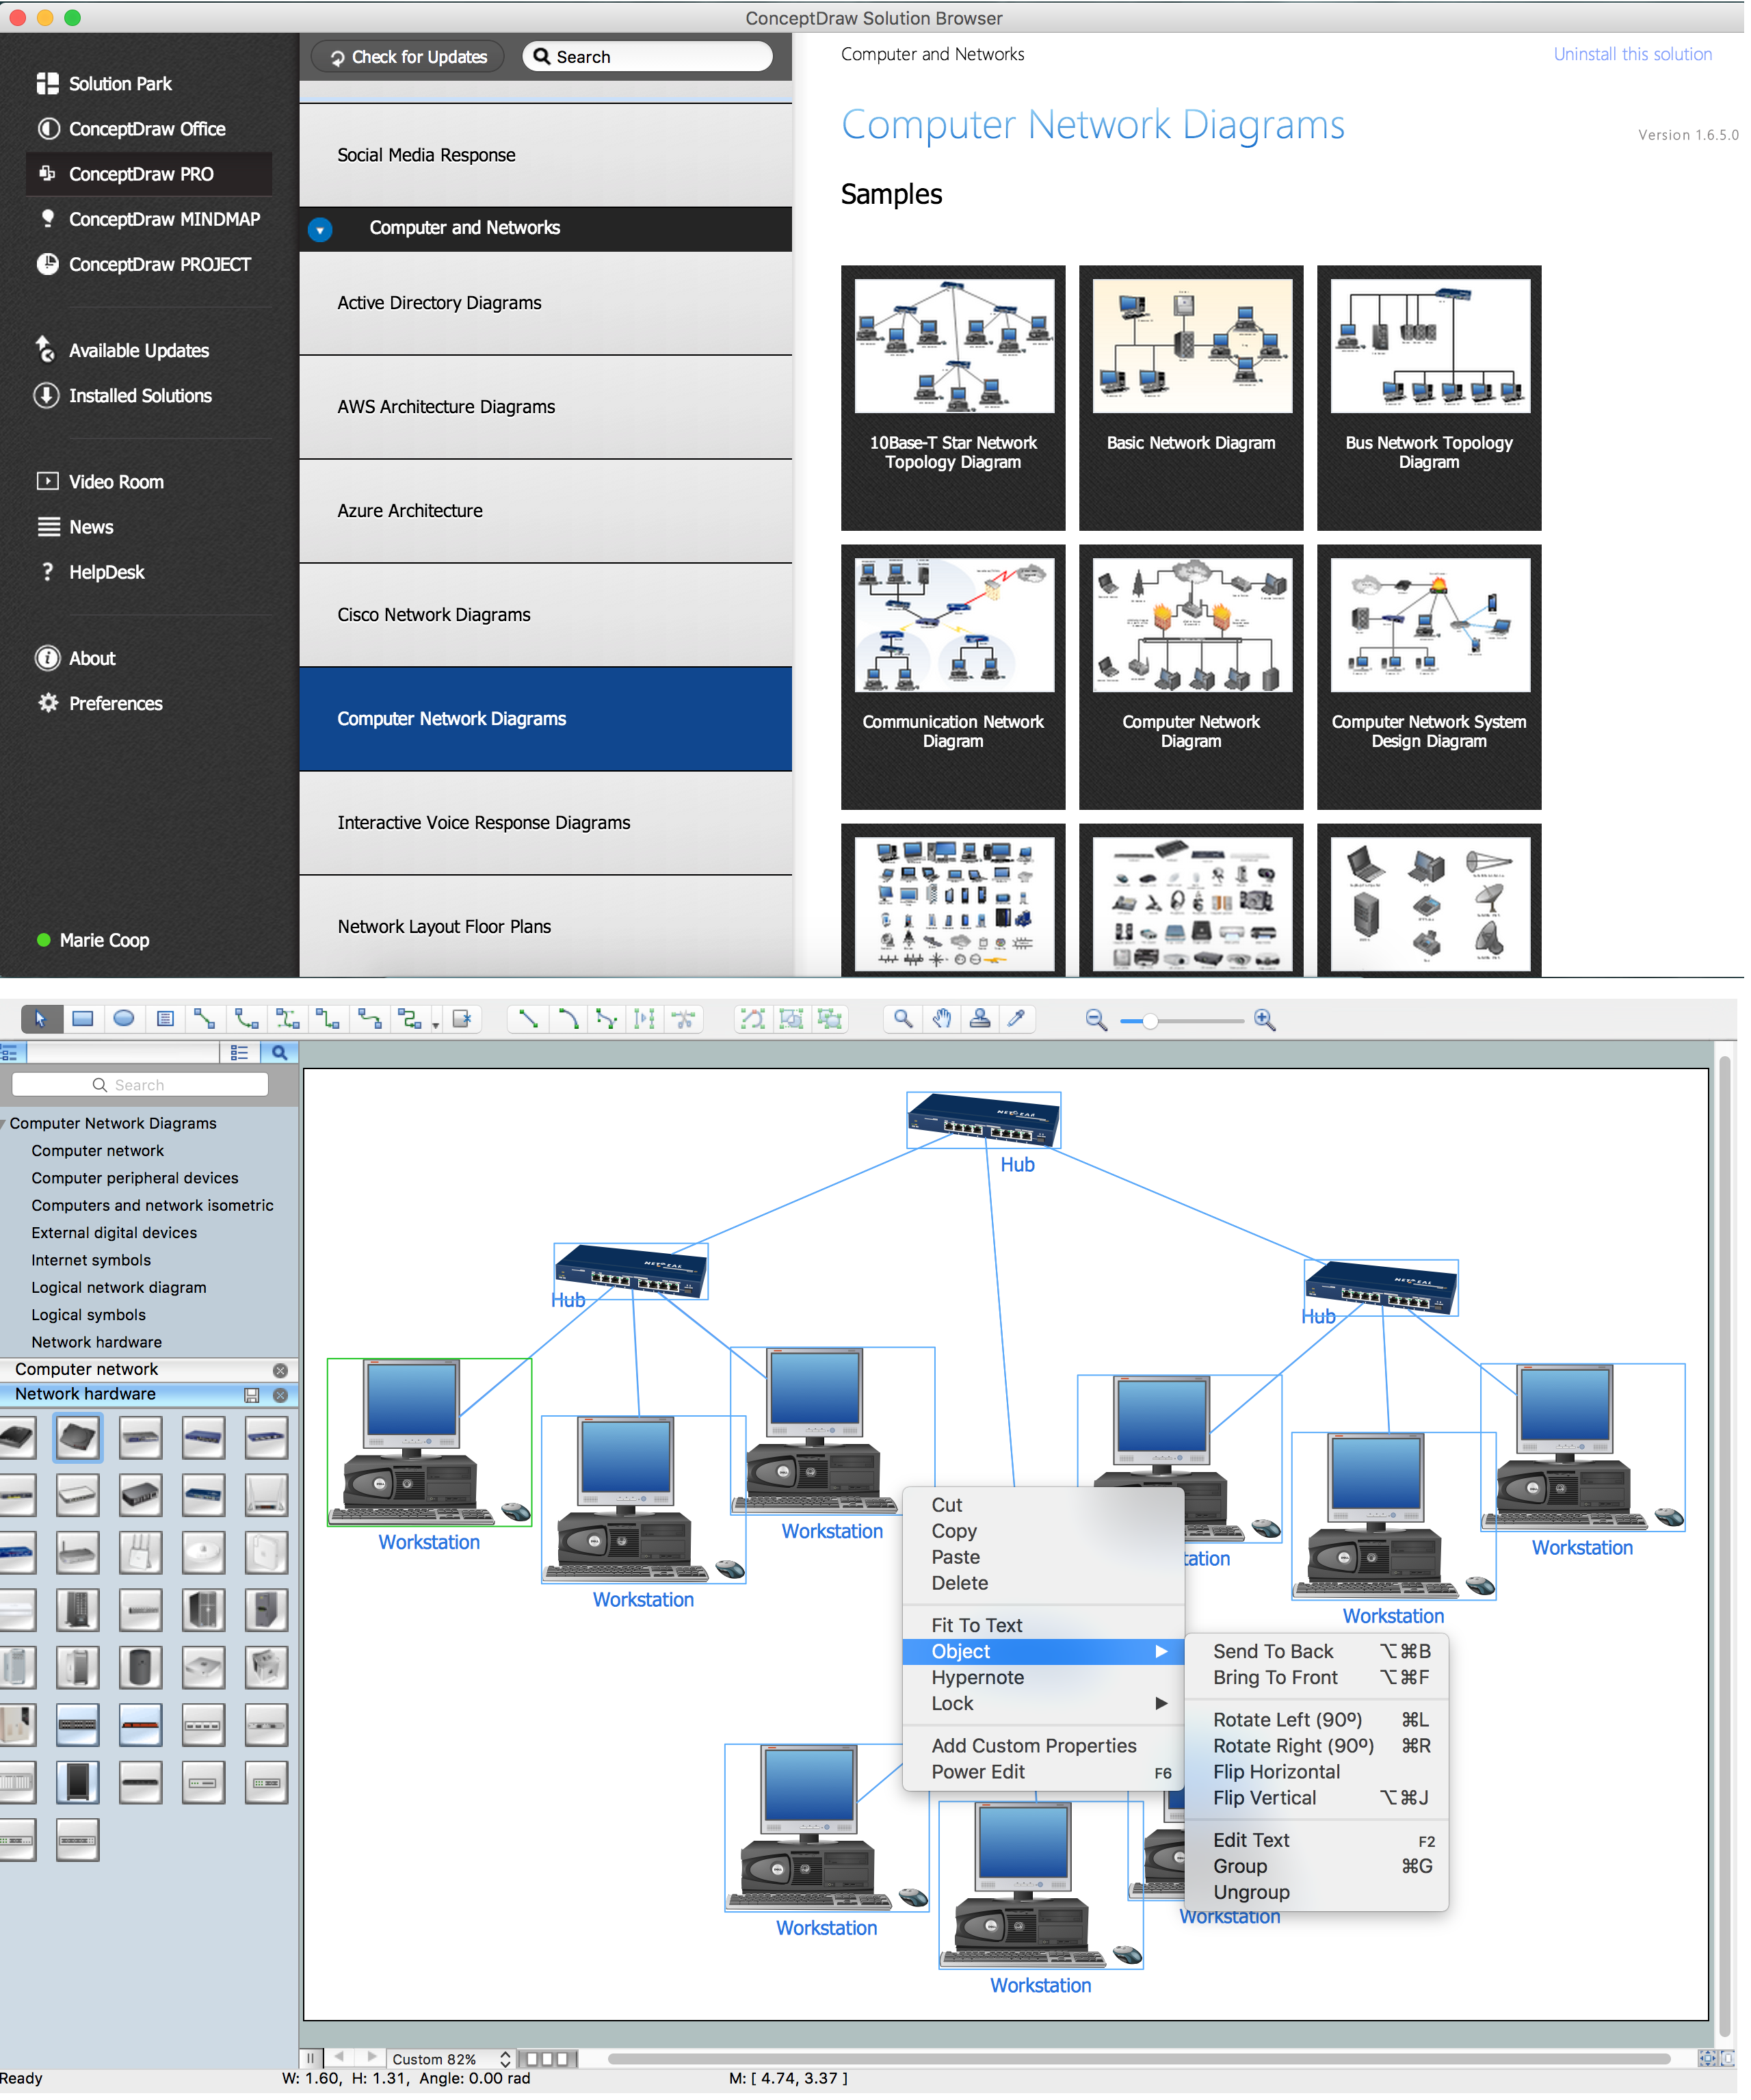
Picture: Complete Network Topology
Related Solution:
To create an Audit Process FlowChart you only need Conceptdaw Software.
Picture: Basic Audit Flowchart. Flowchart Examples
Related Solution:
Create flowcharts, org charts, floor plans, business diagrams and more with ConceptDraw DIAGRAM.
Picture: Simple Diagramming
Related Solution:
The ConceptDraw vector stencils library Cisco WAN contains equipment symbols for drawing the computer wide area network diagrams.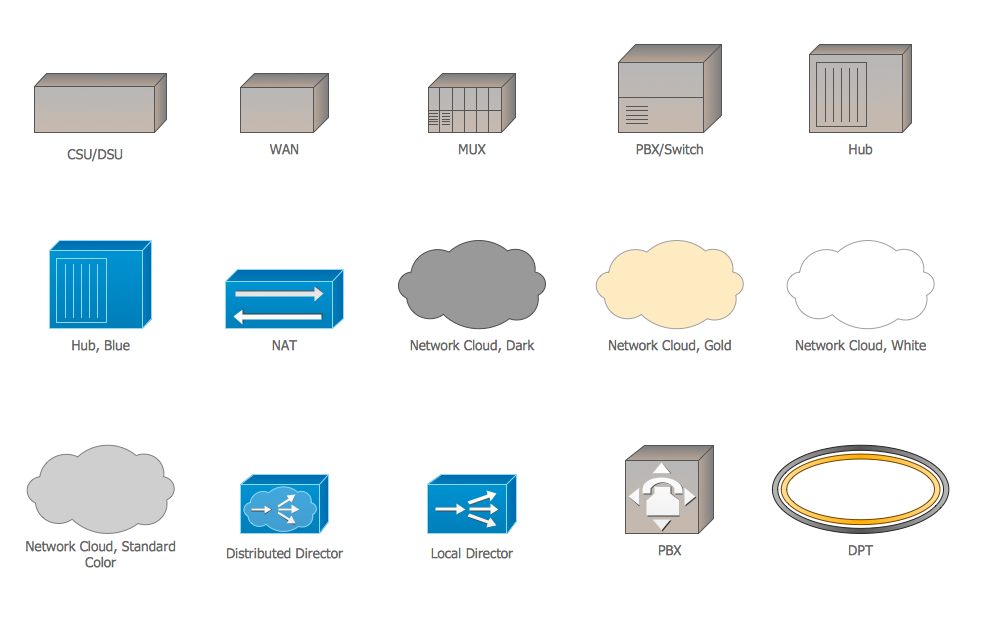
Picture: Cisco WAN. Cisco icons, shapes, stencils and symbols
Related Solution:
Azure is a cloud computing platform developed by Microsoft which offers the extensive infrastructure and wide set of integrated Azure services useful for effective computing, storage, analytics, databases, networking, application development and deployment.
ConceptDraw DIAGRAM extended with Azure Architecture Solution from the Computer and Networks area is a powerful diagramming and vector drawing software with extensive set of useful drawing tools for easy creating Azure Architecture Diagrams and documenting Azure services.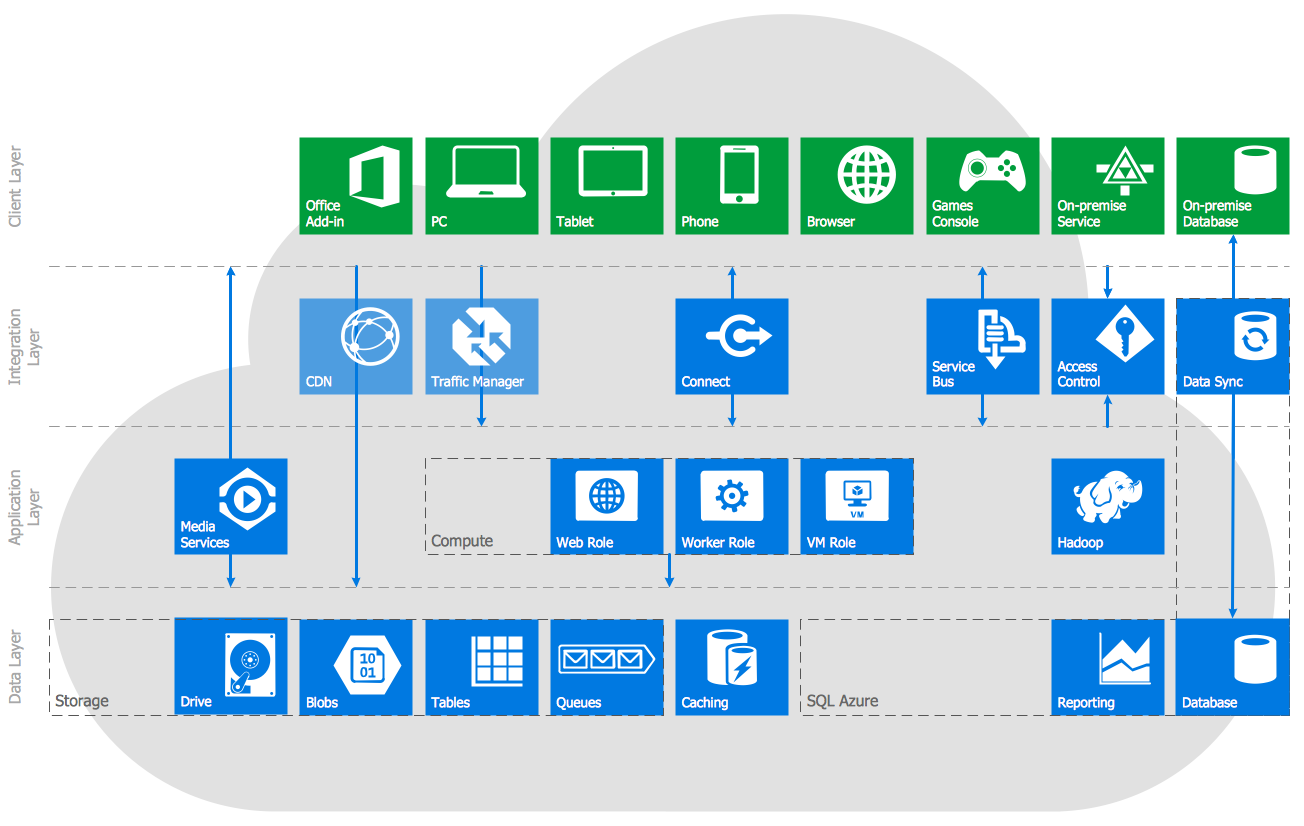
Picture: Azure Services
Related Solution:
Computer and Networks solution provides examples, templates and vector stencils library with symbols of local area network (LAN) and wireless LAN (WLAN) equipment.
This example shows the computer network diagram of the guesthouse connection to the Internet. You can see the needed equipment on the diagram and how it must be arranged to get the Internet in any point of the guesthouse.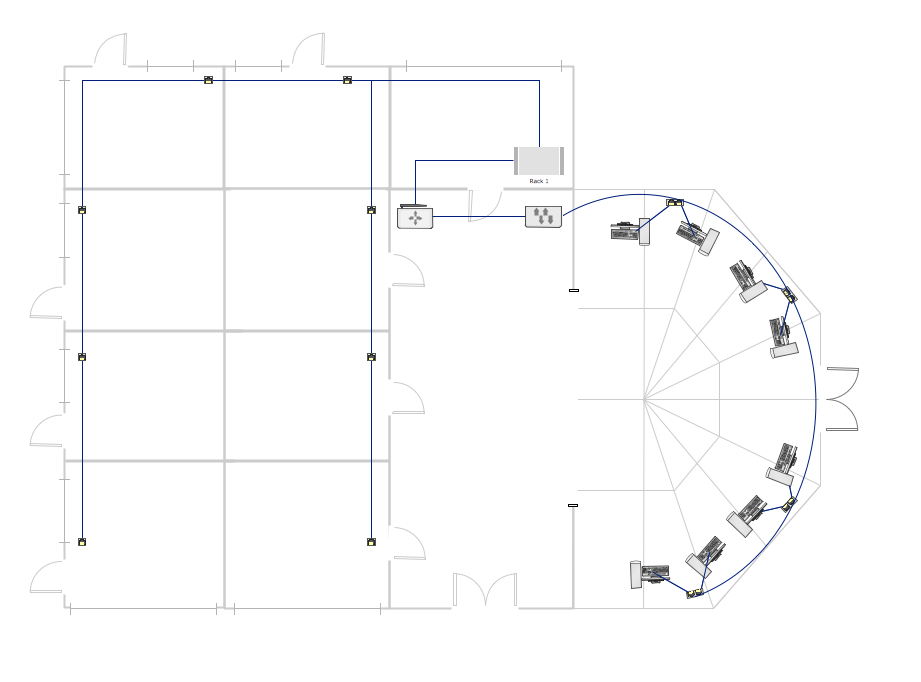
Picture: Guesthouse Network. How to get Internet in guest house
Related Solutions:
Electrical plan is a document that is developed during the first stage of the building design. This scheme is composed of conventional images or symbols of components that operate by means of electric energy. To simplify the creation of these schemes you can use house electrical plan software, which will not require a long additional training to understand how to use it. You only need to install the necessary software ant it’s libraries and you’ll have one less problem during the building projection.
Any building contains a number of electrical systems, including switches, fixtures, outlets and other lightening equipment. All these should be depicted in a building electrical plans and included to general building documentation. This home electrical plan displays electrical and telecommunication devices placed to a home floor plan. On the plan, each electrical device is referenced with the proper symbol. Electrical symbols are used for universal recognition of the building plan by different persons who will be working on the construction. Not all possible electric symbols used on a certain plan, so the symbols used in the current home plan are included to a legend. The electrical home plan may be added as a separate document to a complete set of building plans.
Picture: How To use House Electrical Plan Software
Related Solution:
Collaboration software for small and medium business allows communicate with partners around the globe via Skype.
Picture: How to Collaborate in Business via Skype
Related Solution:
Draw detailed Computer Network Diagrams, Designs, Schematics, and Network Maps with ConceptDraw DIAGRAM in no time! Pre-drawn shapes representing computers, network devices plus smart connectors help create accurate diagrams and documentation.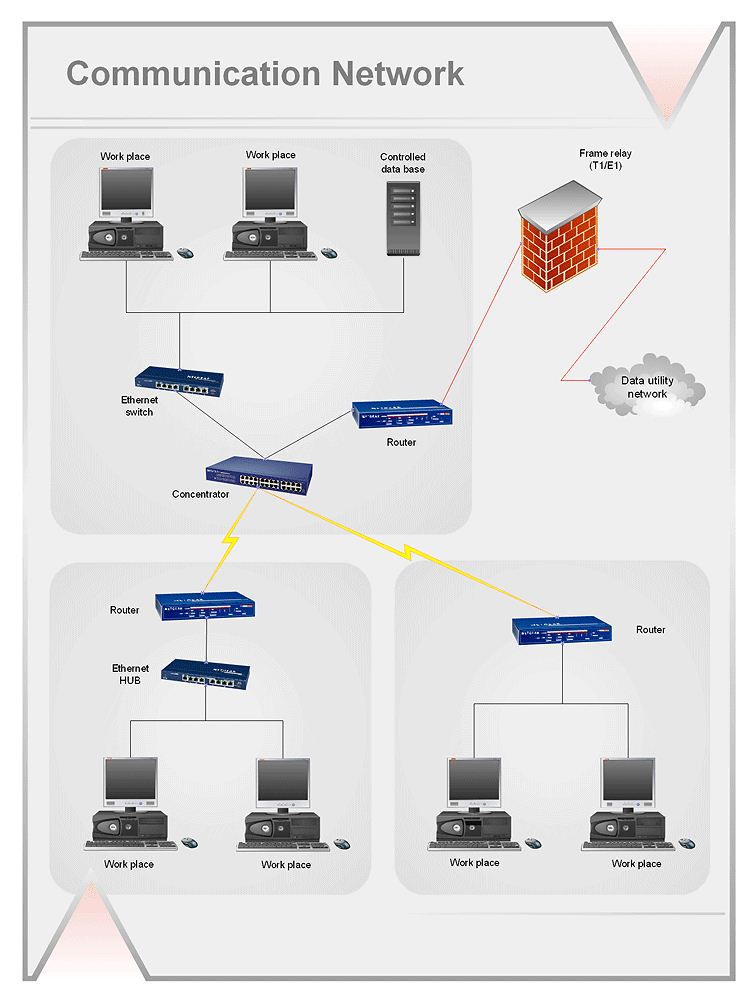
Picture: Network Diagramming with ConceptDraw DIAGRAM