Example 1. Cafe Design
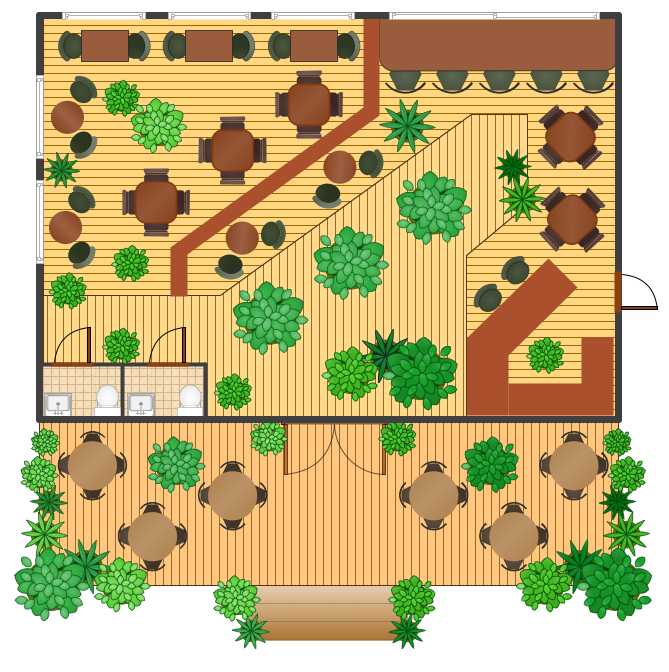
Cafe and Restaurant library from the Cafe and Restaurant Floor Plan solution contains 22 vector objects that you can use for quick drawing great-looking Cafe Design. This can be any cafe that you desire - small or large with a few halls, and even with banquet hall, with open area, etc.

Example 2. Cafe and Restaurant Library Design Elements
Cafe and Restaurant Floor Plan Solution provides also large quantity of samples and templates allowing anyone create Cafe Design Plan of any complexity in a few minutes.

Example 3. Sport Cafe Design
The Cafe Design samples you see on this page were created in ConceptDraw DIAGRAM using the tools of Cafe and Restaurant Floor Plan solution. An experienced user spent 15 minutes creating every of these samples. These samples were included in Cafe and Restaurant Floor Plan solution and are available from ConceptDraw STORE.
All source documents are vector graphic documents. They are available for reviewing, modifying, or converting to a variety of formats (PDF file, MS PowerPoint, MS Visio, and many other graphic formats) from the ConceptDraw STORE. The Cafe and Restaurant Floor Plan Solution is available for all ConceptDraw DIAGRAM or later users.
TEN RELATED HOW TO's:
Website wireframes are convenient and widely used by developers, visual designers, business analysts, and many other people related with projection, development and promotion websites. Usually website wireframes look lacking of brilliance, but they effectively reflect website functionality, content and visually represent its skeletal framework.
ConceptDraw DIAGRAM software offers a unique Website Wireframe solution from the Software Development area with all needed tools for fast and easy drawing professional looking website wireframe with attractive interface design.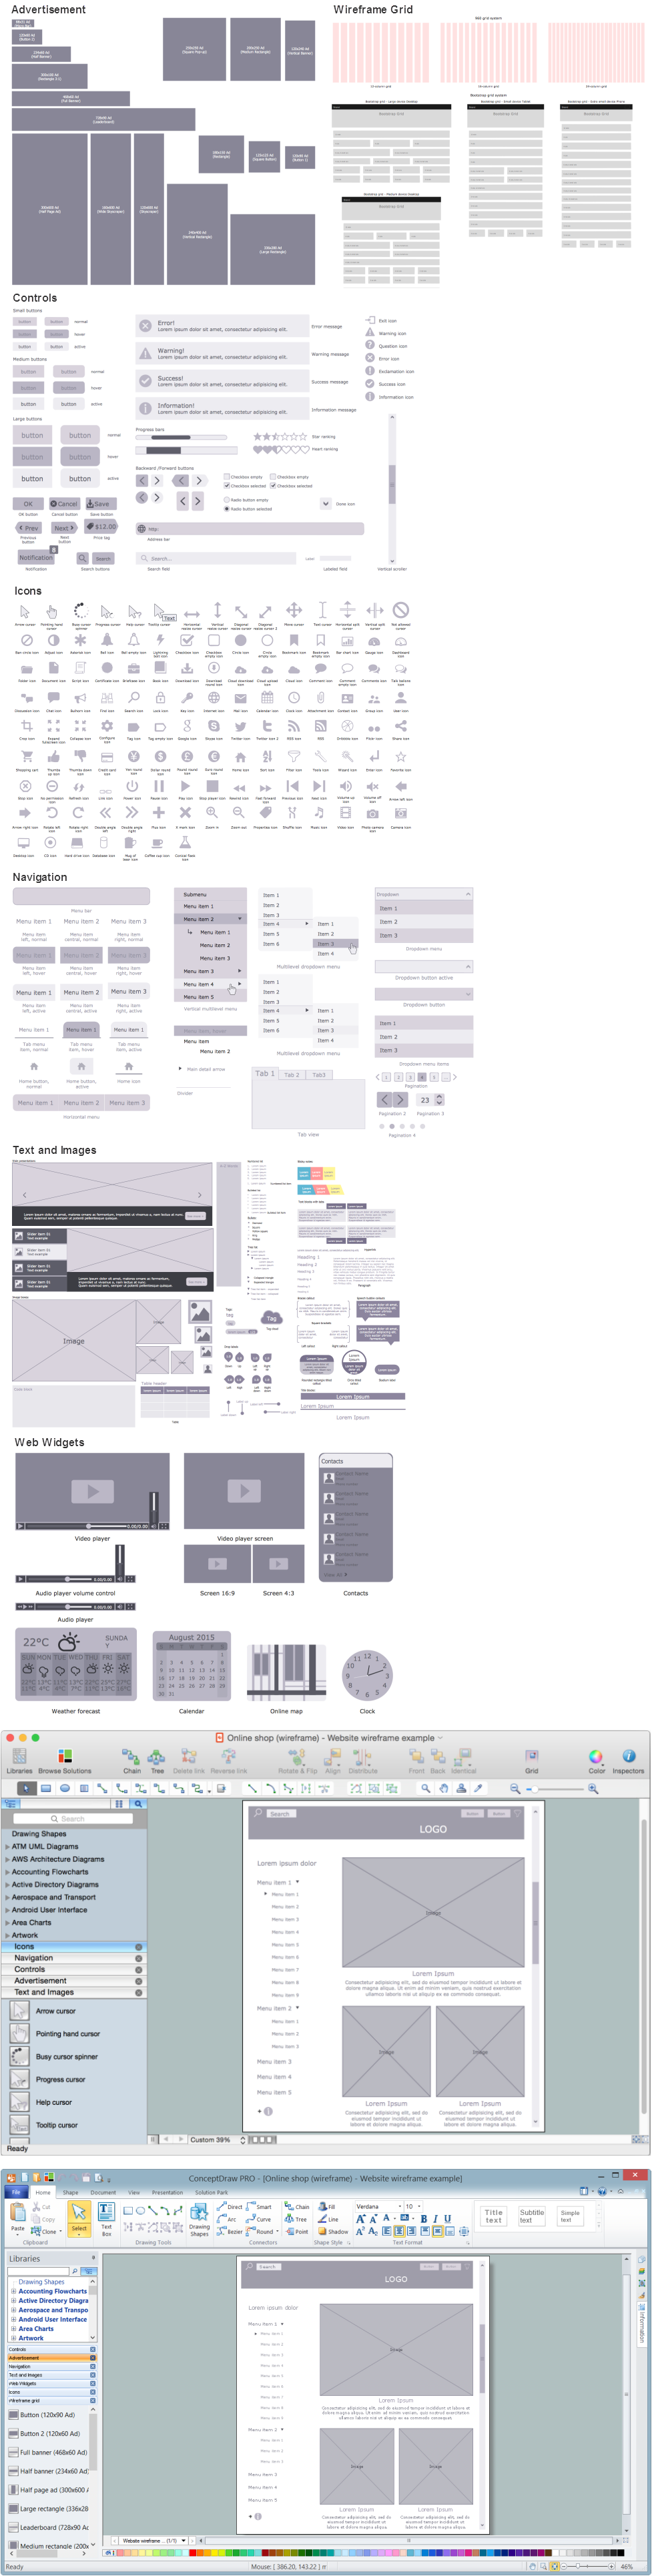
Picture: Interface Design
Related Solution:
There are numerous articles about the advantages of flowcharting, creating business graphics and developing different charts. Nevertheless, these articles are almost useless without the main component - the examples of flowcharts, org charts and without a fine example, it is difficult to get all the conveniences of creating diagrams. You can find tons of templates and vivid examples on Solution Park.
This illustration shows a variety of business diagrams that can be created using ConceptDraw DIAGRAM. It comprises a different fields of business activities: management, marketing, networking, software and database development along with design of infographics and business illustrations. ConceptDraw DIAGRAM provides a huge set of sample drawings including business process modeling diagrams,, network diagrams, UML diagrams, orgcharts, DFD, flowcharts, ERD, geographical maps and more.
Picture: Examples of Flowcharts, Org Charts and More
Related Solution:
You want create a professional room plan quick and easy? ConceptDraw DIAGRAM diagramming and vector drawing software will help you. It’s very simple and convenient design the room plans with Floor Plans Solution from the Building Plans area of ConceptDraw Solution Park.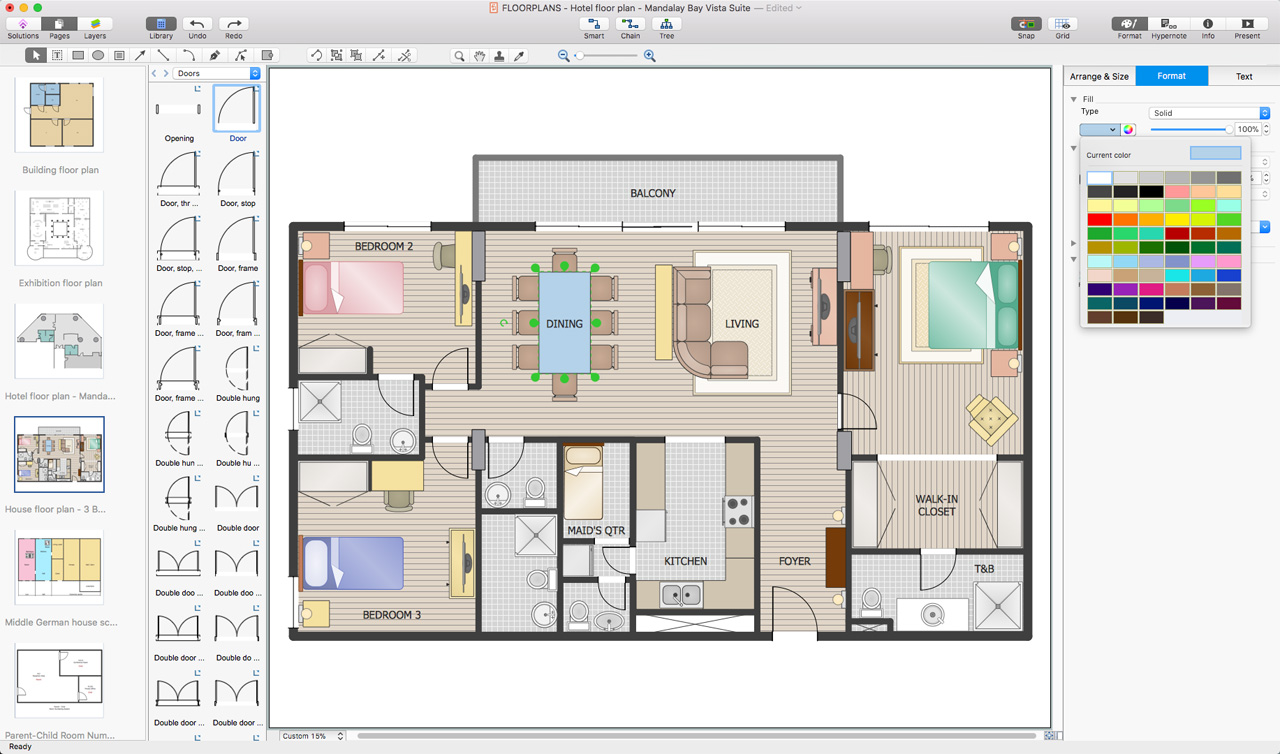
Picture: Room Planning Software
Related Solution:
Nowadays, more and more attention is paid to the comfort in the workplace, so that employees might be more motivated. Thus, it can be said with full confidence that office layout plays an important role for employees and influences company reputation. Many worldwide known companies have headquarter offices resembling more of a campus than of an office building.
Every organization has its own unique office design ideas, needs and requirements. Each of office position requires a certain type of person who has his own requirements, needs and habits. Office layout should be designed to facilitate its business function. The well-organized office space plays an important role in a workflow enhancement and productivity improvement. This office layout diagram demonstrates a typical cubical office layout. This diagram can be use as a template for cubicle office layout organization. This visual example can help shape ideas and design your office layout conception. You can start with adding your requested office furniture objects into your office floor plan. Plants help to create a healthy indoor environment. You can design an office space that totally fits your needs.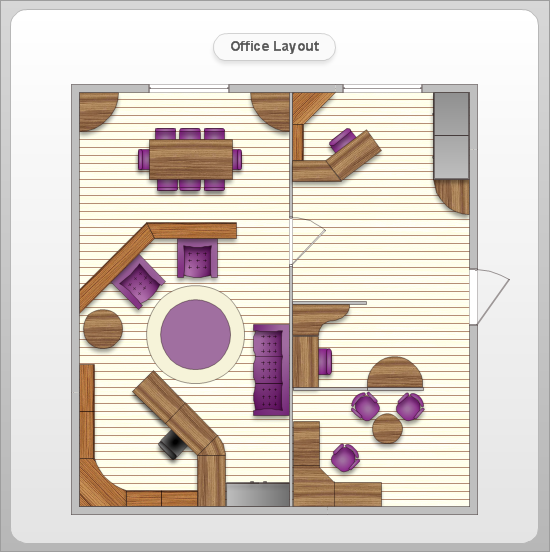
Picture: Office Layout
Related Solution:
Still concerned about fire safety in your establishment? Be sure that all the necessary elements like registers, drills and diffusers are present on your plan. Otherwise, you have to put them on it immediately.
Here you can see the Registers, Drills and Diffusers library that contains vector graphical objects depicting various, drills, diffusers and registers that are used in HVAC systems and reflected ceilings. ConceptDraw had solutions designed to support both. You can use it to create effortlessly Reflected Ceiling plans, HVAC plans and other interior design and building plans related issues. ConceptDraw DIAGRAM provides a complete set of tools for creating graphical documents in compliance with all requirements of modern design of technical documentation.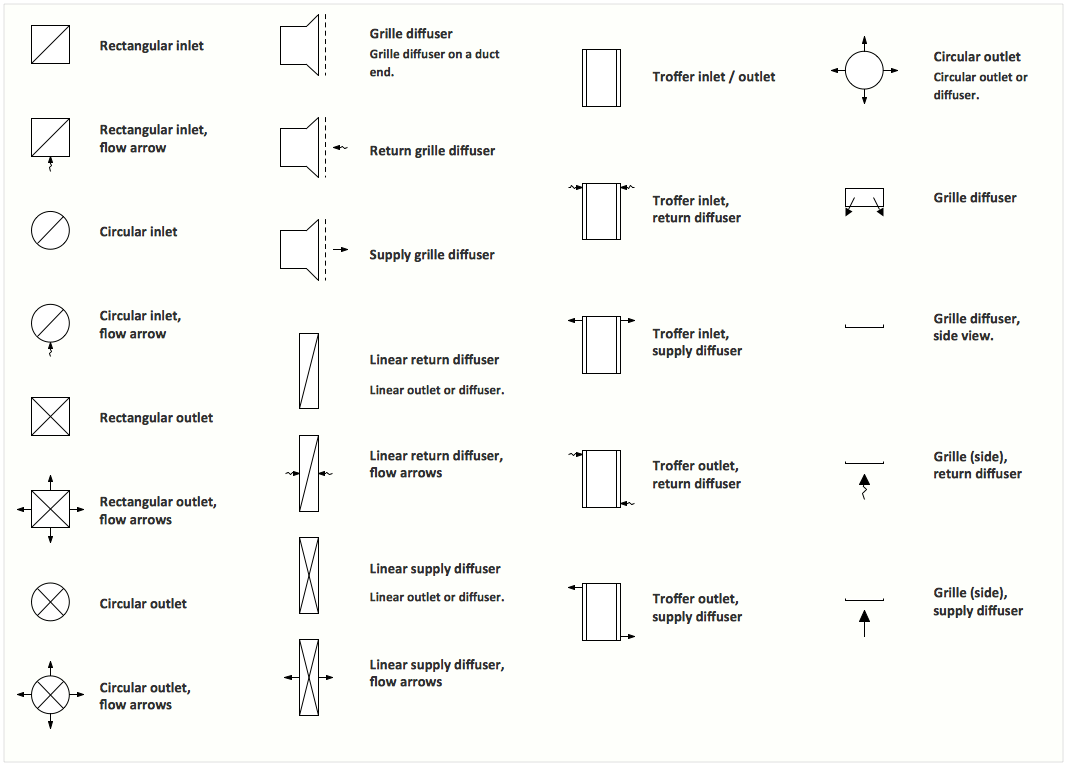
Picture: Interior Design. Registers, Drills and Diffusers — Design Elements
Related Solution:
Cafes and restaurants are the places for relax and recreation, so the most important is their design and atmosphere of comfort, harmony, and uniqueness. So Cafe Design requires great creativity and efforts from the designers. ConceptDraw DIAGRAM software extended with Cafe and Restaurant Floor Plan solution from the Building Plans area of ConceptDraw Solution Park is the most simple way of displaying your Cafe Design ideas and plans first on the computer screen, and then on the paper.Picture: Cafe Design
Related Solution:
This sample illustrates the Floor Plan of mini hotel representing the arrangement of hotel rooms, dining hall, and other premises all of them furnished. This is necessary for construction a hotel and is helpful for booking rooms for accommodation.
This sample was created in ConceptDraw DIAGRAM diagramming and vector drawing software using the Floor Plans Solution from the Building Plans area of ConceptDraw Solution Park.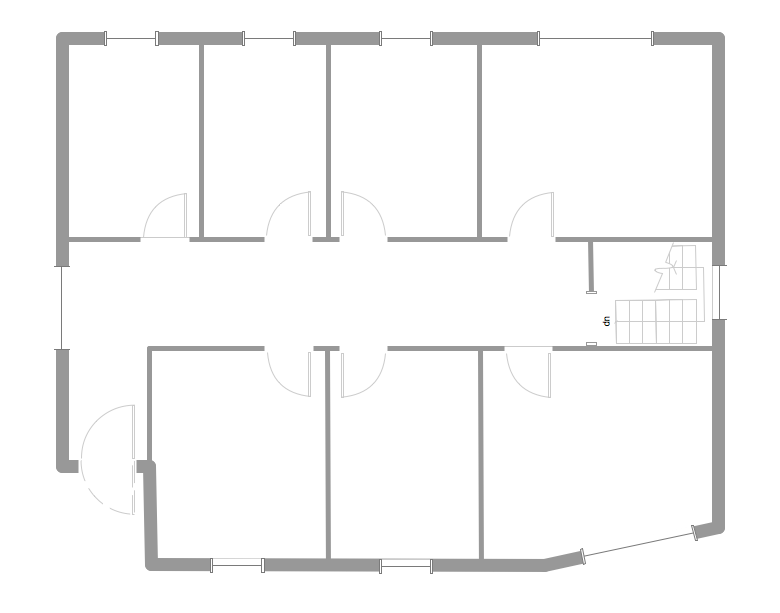
Picture: Hotel Floorplan
Related Solution:
Architectural drawing allows to show the location of a building or ensemble of buildings on the ground, indicating the cardinal points. For centuries, people had been studying architecture in universities to learn how to draw building plans and now everyone can do it easily just using appropriate software. While developing the building plan, its graphic part, you can display the part of the floor or the entire floor of a building with an indication of the exact location of the drawn premise.
Small-sized apartments does not restrict the advanced interior design opportunities. Here is a detailed and precise floor plan of a pretty small apartment. A furniture objects are added to show possible interior of this home. This plan can be used to help somebody with a floor layout and furniture arrangement. Having this floor plan in a pocket while shopping would be useful to check if there is enough rooms for a new furniture.
Picture: How To Draw Building Plans
Related Solution:
The Rapid UML solution provides diagram examples, templates and vector stencils libraries for quick and easy drawing all types of UML 2.x and 1.x diagrams
Picture: UML Business Process
Related Solution:
A pie chart is a circular diagram showing a set of data divided into proportional slices. There are several variations of this chart such as donut chart, exploded pie chart, multi-level pie charts. Although it is not very informative when a ring chart or circle chart has many sections, so choosing a low number of data points is quite important for a useful pie chart.
ConceptDraw DIAGRAM software with Pie Charts solution helps to create pie and donut charts for effective displaying proportions in statistics, business and mass media for composition comparison, i.e. for visualization of part percentage inside one total.
Picture: Pie Chart Software
Related Solution:

