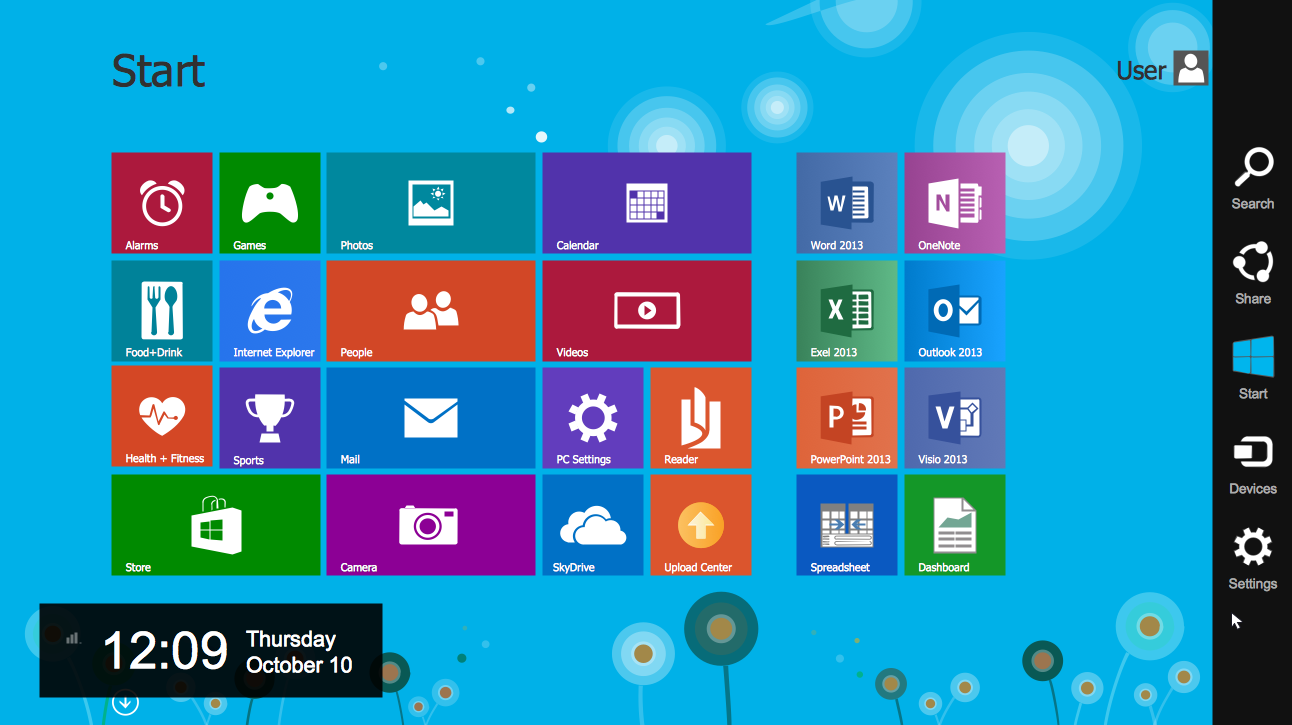
Example 1. User Interface Design Examples - Windows 8 Charm Bar
Windows 8 User Interface Design examples, templates and samples were developed in ConceptDraw DIAGRAM specially for Windows 8 User Interface Solution and are available for ConceptDraw DIAGRAM users from ConceptDraw STORE.

Example 2. User Interface Design Examples - Windows 8 Search Apps
Any desired sample or template that you will find in ConceptDraw STORE, can be opened, filled and changed according to the user's needs. Try and make sure that it's very simple and convenient.

Example 3. User Interface Design Examples - Windows 8 App
The user interface design examples you see on this page were created in ConceptDraw DIAGRAM using the vector objects from the Windows 8 User Interface Solution for ConceptDraw DIAGRAM These samples demonstrate the solution's capabilities and the professional results you can achieve. An experienced user spent 10 minutes creating every of these samples.
All source documents are vector graphic documents. They are available for reviewing, modifying, or converting to a variety of formats (PDF file, MS PowerPoint, MS Visio, and many other graphic formats) from the ConceptDraw STORE. The Windows 8 User Interface Solution is available for all ConceptDraw DIAGRAM or later users.
NINE RELATED HOW TO's:
Data base diagrams describes inter-related data and tables. It describes roles and relationships, internal and external dependencies, data exchange conventions and structures of knowledge domain.
ConceptDraw Software provides number of data-base chart libraries including major 49 vector symbols. Use these DFD flowchart symbol libraries to design data-base structure and models, use it to design data base process-oriented models, or simple data-oriented models. The are special drawing tools for making data flowcharts, data process diagrams, structured analysis diagrams, and information flow diagrams.
Picture: Database Flowchart Symbols
Related Solution:
A wireframe is a scheme of a future web page. Wireframe illustrates the web page structure, location and size of the main elements, as well as their interaction with the user. With such scheme designer defines the functionality of the page, not its appearance.
Picture: Wireframe Tools
Related Solution:
This sample shows the UML Class Diagram that was created in ConceptDraw DIAGRAM on the Mac and then was opened for editing in MS Visio.
Using the 13 libraries of the Rapid UML Solution for ConceptDraw DIAGRAM you can create your own visual vector UML diagrams quick and easy.
Picture: UML Diagram Visio
Related Solution:
ConceptDraw DIAGRAM diagramming and vector drawing software extended with Windows 8 User Interface Solution is a powerful GUI Software. Designing of professional looking Windows 8 and Windows 8.1 user interfaces, and Windows 8 UI design patterns never been easier than now with convenient and useful tools of Windows 8 User Interface Solution from the Software Development area.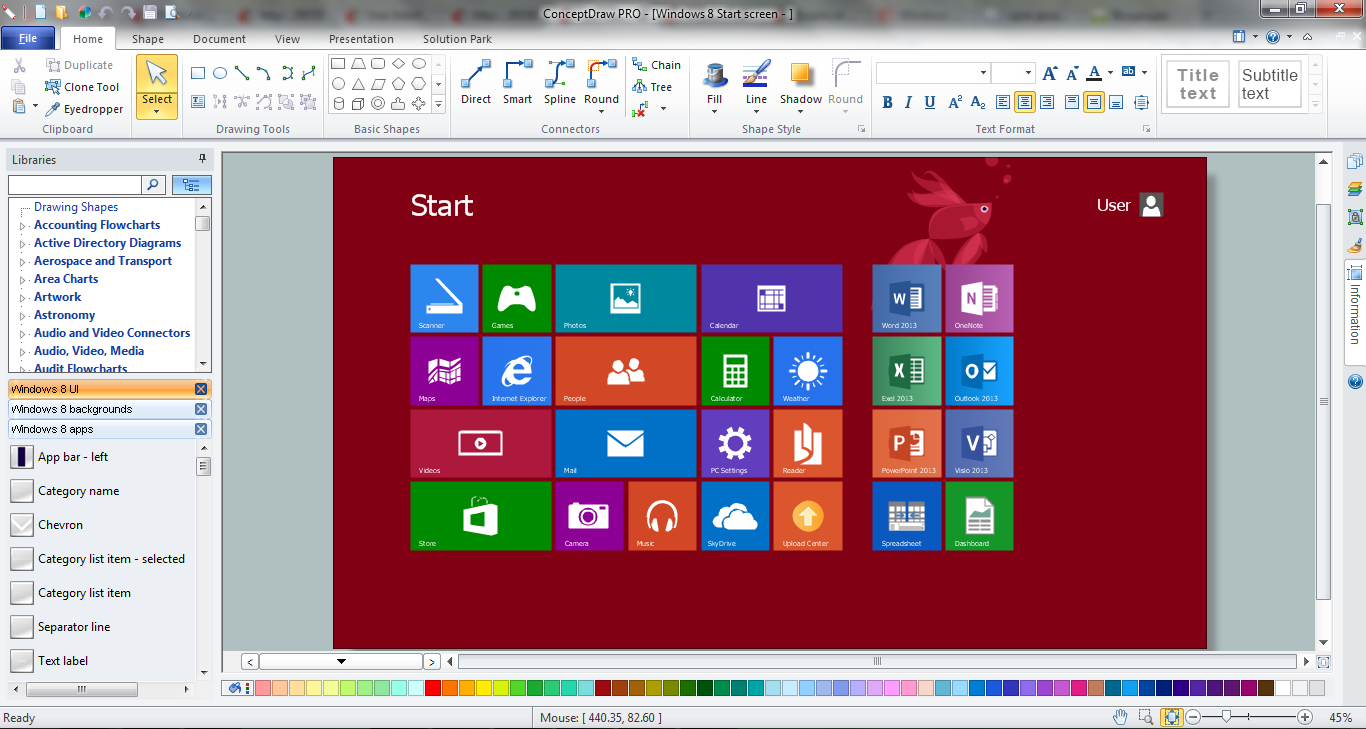
Picture: GUI Software
Related Solution:
Computer networks nowadays are spread all across the world. The large number of parameters, such as geographic scale or communication protocols, can divide networks. One of the most common types of networks is called local area network (LAN). It convenient to represent network examples by means of diagrams.
This local area network (LAN) diagram provides an easy way to see the way the devices in a local network are interacted. The diagram uses a library containing specific symbols to represent network equipment , media and the end-user devices such as computers (PC, mac, laptop) , network printer, hubs, server and finally a modem. There are two types of network topologies: physical and logical. The current diagram represents precisely a physical type of LAN topology because it refers to the physical layout of a local network equipment.
Picture:
What is a Local Area Network?
Examples of LAN Diagrams
Related Solution:
Timeline is a type of diagram which illustrates the series of events in a chronological order on a linear timescale. How to make a timeline? It is convenient to use a modern powerful software. ConceptDraw DIAGRAM diagramming and vector drawing software extended with Timeline Diagrams solution from the Management area is exactly what you need.
Picture: How to Make a Timeline
Related Solution:
Take a look on an example of Cross-Functional-Flowchart, showing the software service cross-function process flowcharts among the different departments. It presents a simple flowchart among the customer, sales, technical support, tester and development.
Try now Flowchart Software and Cross-Functional library with 2 libraries and 45 vector shapes of the Cross-Functional Flowcharts solution. Then you can use built-in templates to create and present your software service cross-function process flowcharts.
Picture: Cross Functional Flowchart Examples
This sample is a UML Class Diagram that shows the banking system. The classes represented as boxes with attributes and are connected with dependency and synchronous message associations. The associations are indicated with the multiplicity 1..*. This sample can be used by the banks, by financial enterprises.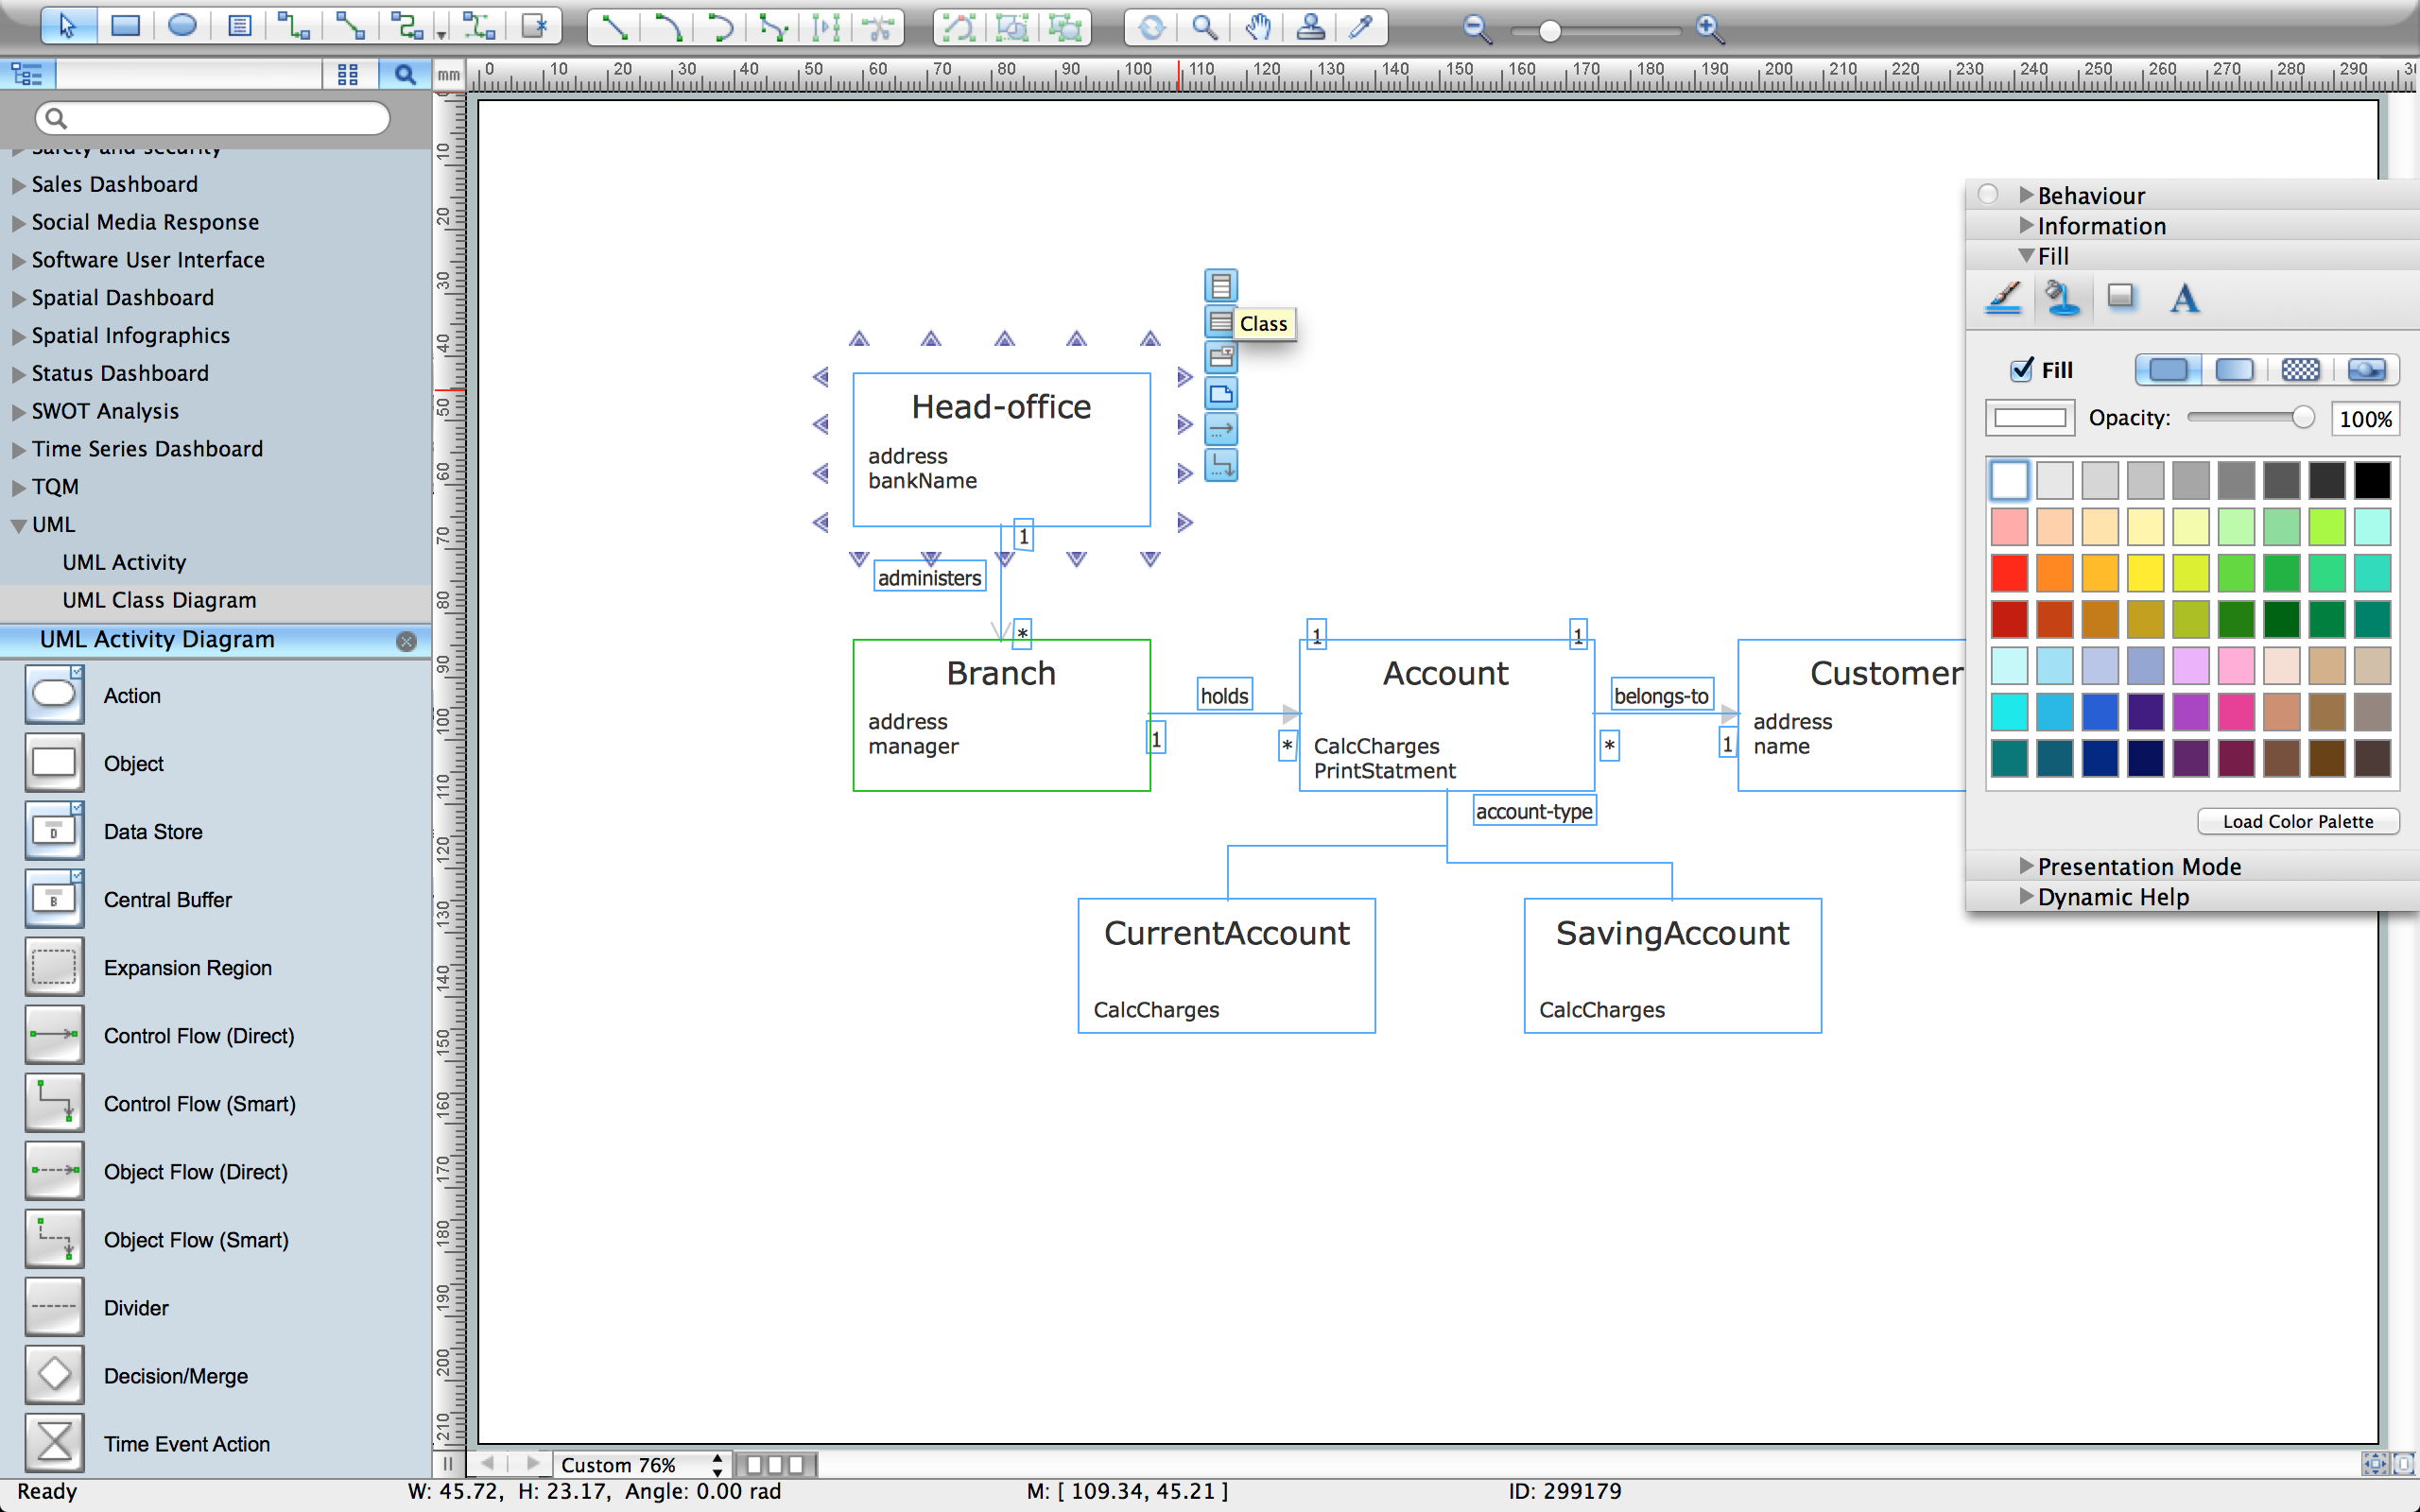
Picture: Create UML Diagram
Related Solution:
ConceptDraw MINDMAP an Alternative to MindJet MindManager - The power, economy, and versatility of ConceptDraw MINDMAP takes personnel and team productivity to another level. Discover today what this means to you.
Picture: Why People Select ConceptDraw MINDMAP
Related Solution:

