Flowchart Examples and Templates
Flowchart Basics: What You Need to Know
Flowcharting provides a simple way of organizing and representing data so that even complex and detailed processes become clear. Visual information is easier to perceive. Working in business, analytics, science, manufacturing, marketing, governmental organization, doing politics, architecture, engineering, administration, working as a designer, builder, IT specialist, you still might need to do your best in order to succeed even if you are high experienced and qualified professional. A Flowchart, which is a graphical representation of a process or an algorithm made of special symbols, will help you in your work.
Flowcharts can be fun, it’s not about business processes or programming algorithms. You can teach even a child to make diagrams with a good example of a Flowchart that would be interesting for it. Making a Flowchart diagram is the best way to represent a process as a sequence of steps. And using a flowchart software tool is proven to be an ideal for structuring and sharing information on process workflow structure.
If you wonder how to draw a very simple diagram, chart, flowchart, plan, scheme, or some engineering drawing, the best option we can offer will be to download a unique, very smart, and sophisticated professional tool for that, which is ConceptDraw DIAGRAM software. It allows making any of mentioned above and more structures in order to illustrate any needed process.
Flowchart Examples
 Binary tree sort
 Efi Simple Flowchart
 Steps to Partnership Flowchart

 Flowchart of Nixtamalization process
 Flowchart types of risks in banking
 VQuad-HD Flowchart
 Nixtamalization process
 Samples of Flowcharting
 Flowchart on Bank
 Flowchart Marketing Process
 Flowchart of Products
 Basic Flowchart Images
 Flowchart of Products
 Ordering Process Flowchar
 What is Flowchart
 Example Basic Flowchart
 Basic Flowchart
Flowchart Templates and Visual Examples
ConceptDraw DIAGRAM software with Flowcharts solution can help to make any desired Flowchart having only one tool which is the application itself. Please choose any Flow diagram examples you are interested in, alternatively download them for free; you will need to install ConceptDraw DIAGRAM to view them.
As you will see, ConceptDraw DIAGRAM flowchart software is very powerful, you can use more than 10000 symbols, examples, and many pre-drawn templates, to create your own spectacular Flowcharts, business diagrams, and lots more, effortlessly, and in no time at all.
ConceptDraw DIAGRAM vector diagramming software and ConceptDraw Solution Park provide a wide variety of diagrams, organizational charts, business charts, and examples of flow charts, templates, and samples. You are free to choose any example or Flow diagram template you are interested in from the ConceptDraw STORE, then use it to simplify your work at designing professional-looking Flowcharts and diagrams.
As for Flowcharts, turn your attention to the Flowcharts solution from the Diagrams area of ConceptDraw Solution Park, Process Flowcharts and Cross-Functional Flowcharts solutions from the Business Processes area, Accounting Flowcharts and Audit Flowcharts solutions from the Finance and Accounting area, which are completely devoted to Flowcharts creation and provide an enormous collection of helpful flowchart templates and samples. Each of them is specially developed, well thought-out, dedicated to a certain thematic, and carries a specific purpose. You need only to determine with your needs and decide which one corresponds them the best and suits you.
If you want to create Flowchart and you are still thinking about which one can be the most suitable for your circumstances, then we can provide you with all of the needed detailed information about the types of Flowcharts and their specifications. You can find lots of information, following the links, about Binary Tree Sort Flowchart, Efi Simple Flowchart, Steps to Partnership Flowchart, Credit Approval Process Flowchart, EPC Diagram, Swim Lane Process Diagram, Flowchart of Nixtamalization process, Flowchart types of risks in banking, VQuad-HD Flowchart, and other on this site.

Example 1. Flowchart Template in ConceptDraw DIAGRAM (MacOS)
ConceptDraw DIAGRAM: Guide to Streamline Flowcharting Process
Flowchart diagrams can be simply created in ConceptDraw DIAGRAM flowcharting and vector diagramming software using the Flowcharts solution from ConceptDraw Solution Park within only a couple of minutes for the professional user. But even if you are not a big expert in creating such drawings then you can always use the pre-made Flowchart examples and templates in our solutions.
You can make any needed diagram that will illustrate the structure and basic components of any organization you want, including your own company. While creating your Flowchart using ConceptDraw DIAGRAM software we recommend you take into consideration and use the following objects:
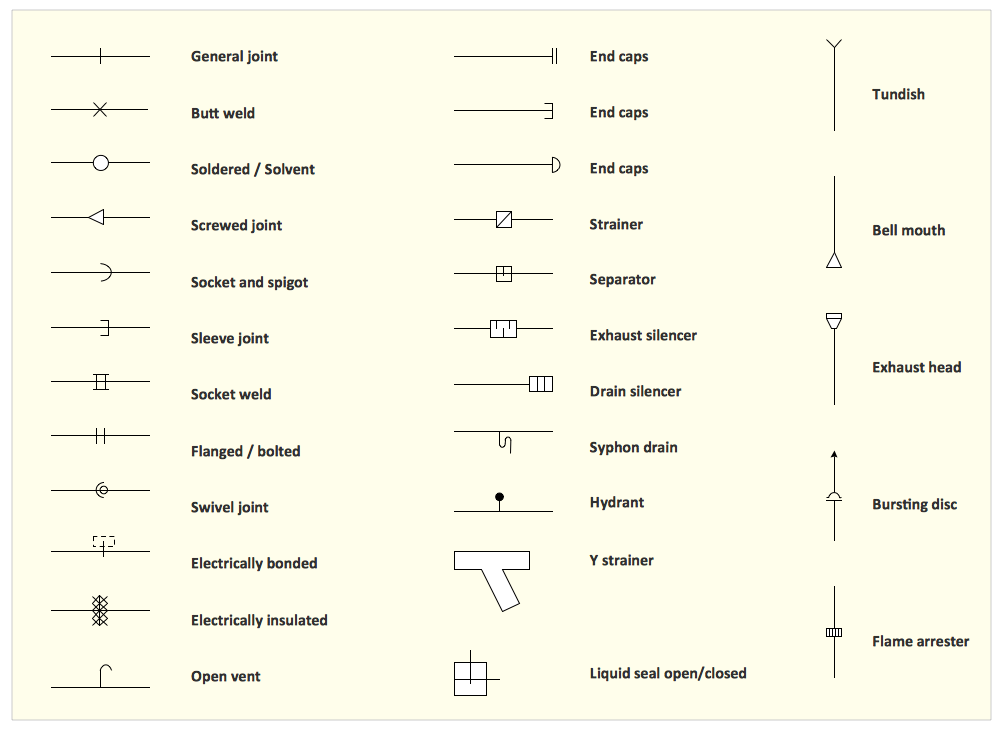
- rectangle or box is a most often used symbol, it represents an activity or a step;
- rounded box or oval usually contains the word "Start" or "End";
- diamond is used to represent the decision point, it usually involves the branching yes/no;
- circle is used to represent the point of connection the Flowchart to another process;
- parallelogram represents the Input/Output.
Knowing and noting this information will help you to plan your drawings in advance and so to have the final result looking truly smart and professional.
Create Your Own Flowchart: Examples and Templates Included
You can start with any Flow chart sample or Flowchart diagram template and change it for your needs or just draw the new Flowchart using the ready-to-use vector stencils from the Flowcharts library.

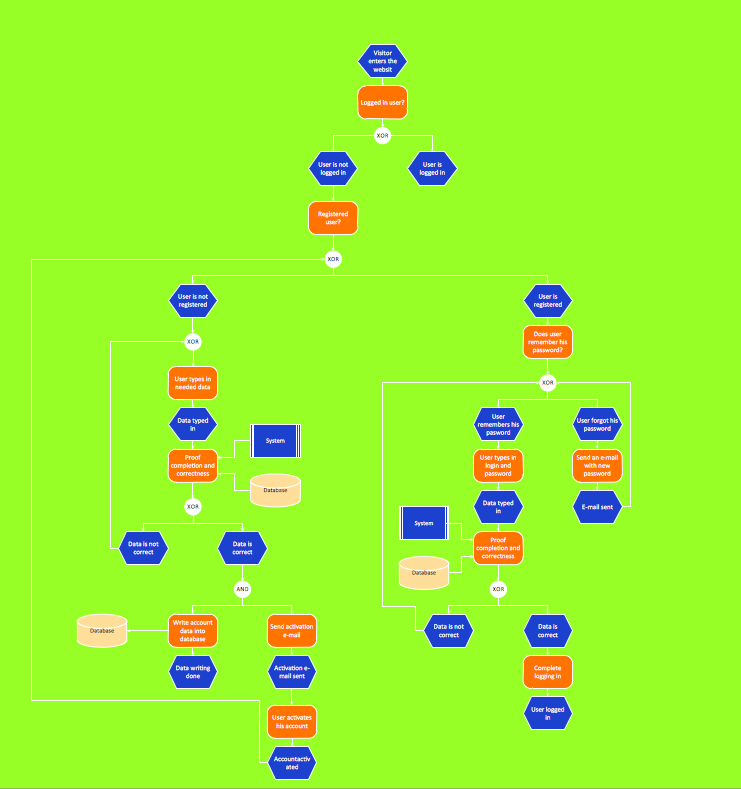
Example 2. Structure and Basic Components of the Austrian Electronic Health Records (ELGA)
This Flowchart diagram was created in ConceptDraw DIAGRAM and vector drawing software using the Flowcharts solution from ConceptDraw Solution Park. This diagram based on the simple Flowchart template illustrates the structure and basic components of the Austrian Electronic Health Records (ELGA). An electronic health record (EHR) is a systematic accumulation of information about the health of an individual patient or population in electronic form. Such a system captures all the health information of the patient at all times.
Conclusion
ConceptDraw DIAGRAM is a business graphics and diagramming tool that will make short work of your professional drawing needs. ConceptDraw DIAGRAM is compatible with Microsoft Visio file format. Use the Flowcharts solution for ConceptDraw DIAGRAM flowcharting application to create your own professional-looking Flowchart Diagrams quickly and easily from the blank sheet or using basic Flow chart template or any of included samples or examples.