What Is an Action Mind Map
Using the ConceptDraw Social Media Response solution improves quality of content in social media and helps build an active customer community. It allows companies to be more effective in timely messaging thanks to the ability for rapid response to a customer′s post in social media. This saves budget for companies who use social media for promoting and as a lead generation tool.
The Social Media Response solution creates interactive social media flow charts and action mind maps. The solution includes a video tutorial and a number of samples helping social media teams refine and organize their response process. There are materials to help trainers and consultants develop a social media strategy and provide training for social media groups on how to effectively accomplish their daily work.
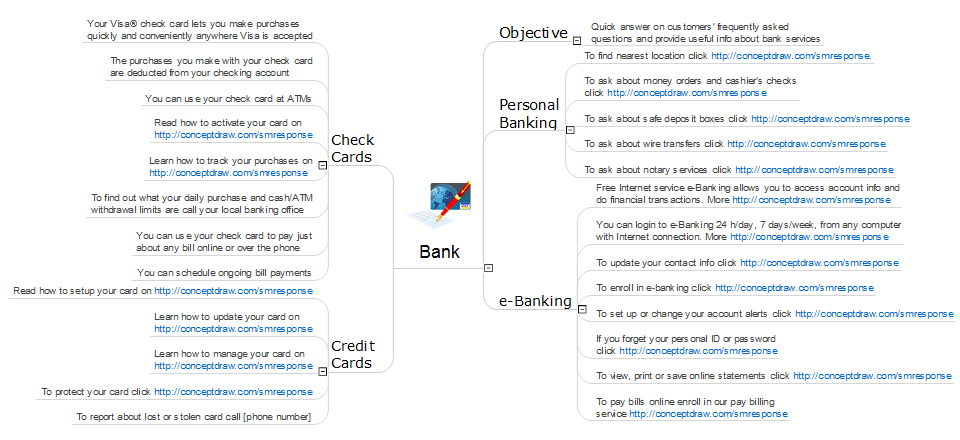
Sample 1. Bank Detailed Answers
See also Samples:
-
Mind Maps
-
Idea Communication
-
Marketing — Social Media
TEN RELATED HOW TO's:ConceptDraw MINDMAP is a powerful business and personal productivity software application that provides visual organization and access to information for individuals and organizations. Picture: ConceptDraw MINDMAP :Brainstorming, Mind Mapping for macOS and WindowsConceptDraw DIAGRAM is a professional software for creating great looking flowcharts. The samples included in this set of software allows users to draw any type of flowchart.
 Picture: Flowchart Process ExampleRelated Solution:Flowcharts can be used in designing and documenting both simple and complex processes or programs and, similar to the other types of diagrams, they can help visualize what happens and so help understand some definite process, and, as a result, find flaws, bottlenecks and other features within it.
 Picture: Flowchart Programming Project. Flowchart ExamplesRelated Solution:ConceptDraw MINDMAP an Alternative to MindJet MindManager - The power, economy, and versatility of ConceptDraw MINDMAP takes personnel and team productivity to another level. Discover today what this means to you.
 Picture: Why People Select ConceptDraw MINDMAPRelated Solution:It is convenient to represent various routes, directions, roads on the directional maps and navigation schemes. ConceptDraw DIAGRAM diagramming and vector drawing software supplied with Directional Maps Solution from the Maps Area of ConceptDraw Solution Park is effective for drawing Directions Maps.
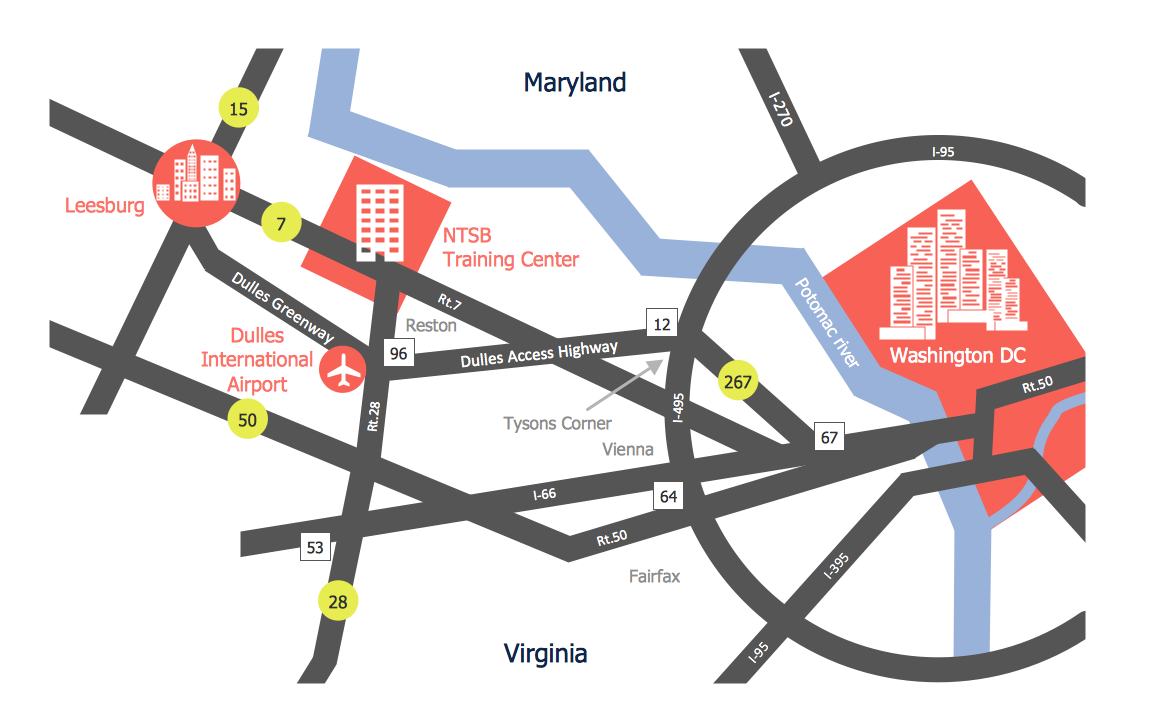 Picture: Directions MapsRelated Solution:When developing the Classroom Seating Chart it is necessary to take into account the characteristics of the taken premises. Each seating place must to be comfortable and each pupil must to see good the teacher and the chalkboard. Let's design the Classroom Seating Chart in ConceptDraw DIAGRAM software extended with School and Training Plans Solution from the Building Plans Area.
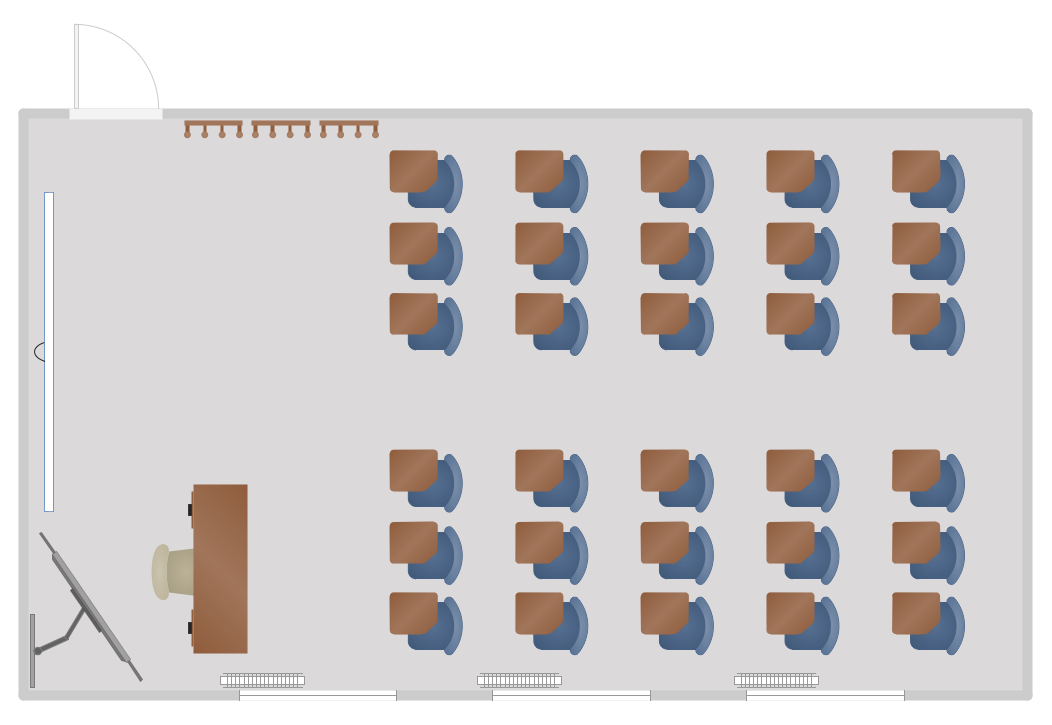 Picture: Classroom Seating ChartRelated Solution:A waterfall model describes software development process as a sequence of phases that flow downwards. SSADM is one of the implementations of waterfall method. It’s easier to learn about structured systems analysis and design method (SSADM) with ConceptDraw DIAGRAM because this software has appropriate tools for creating data flow diagrams. You can use all the three main techniques of SSADM method with special tools and predesigned templates. This data flow diagram illustrates the Structured Systems Analysis and Design Method. This method method considers analysis, projecting and documenting of information systems. Data flow models are the most important elements of SSADM and data flow diagrams are usually used for their description. It includes the analysis and description of a system as well as visualization of possible issues.
 Picture: Structured Systems Analysis and Design Method. SSADM with ConceptDraw DIAGRAMRelated Solution:Use case diagrams are used at the development of software and systems for definition of functional system requirements or system of systems. Use case diagram presents the consecution of object’s actions (user’s or system’s) which are executed for reaching the definite result.
 Picture: Use Case Diagrams technology with ConceptDraw DIAGRAMIt’s very simple and quick to create the UML Diagrams using the Rapid UML Solution for ConceptDraw DIAGRAM. This sample was created in 10 minutes. This sample describes the credit card processing system. It’s a UML Class Diagram with generalization sets. This sample can be used by the banks, business and financial companies, exchanges.
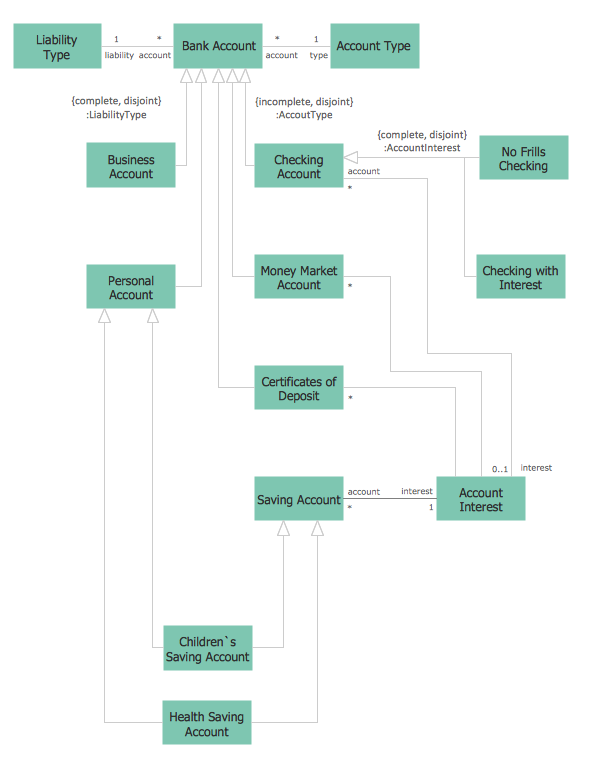 Picture: UML in 10 minsRelated Solution:ConceptDraw is your tool for driving social integration and managing change across and streamline social media processes of your organisation.This tool keeps the entire team on the same page allowing you to realize your social media strategy, improve the quality of your answers, and minimize the time it takes to respond.
 Picture: Social Media Response Management DFD Charts - software toolsRelated Solution:ConceptDrawDIAGRAM 18