How to Present a Social Media Response Plan DFD to Your Team
Using the ConceptDraw Social Media Response solution improves quality of content in social media and helps build an active customer community. It allows companies to be more effective in timely messaging thanks to the ability for rapid response to a customer′s post in social media. This saves budget for companies who use social media for promoting and as a lead generation tool.
The Social Media Response solution creates interactive social media flow charts and action mind maps. The solution includes a video tutorial and a number of samples helping social media teams refine and organize their response process. There are materials to help trainers and consultants develop a social media strategy and provide training for social media groups on how to effectively accomplish their daily work.

Sample 1. Response to a Question
See also Samples:
-
Mind Maps
-
Idea Communication
-
Marketing — Social Media
TEN RELATED HOW TO's:It is so simple making the drawing process easier and faster, you just need to choose the right ConceptDraw DIAGRAM drawing software. Picture: Design Diagrams the Fast and Easy WayConceptDraw DIAGRAM diagramming and vector drawing software extended with Gym and Spa Area Plans solution from Building Plans area of ConceptDraw Solution Park contains a set of examples, templates and design elements libraries for drawing Gym Workout Plan, Gym Floor Plan, Gym Layout Plan, Spa Floor Plan, Fitness Plan, etc.
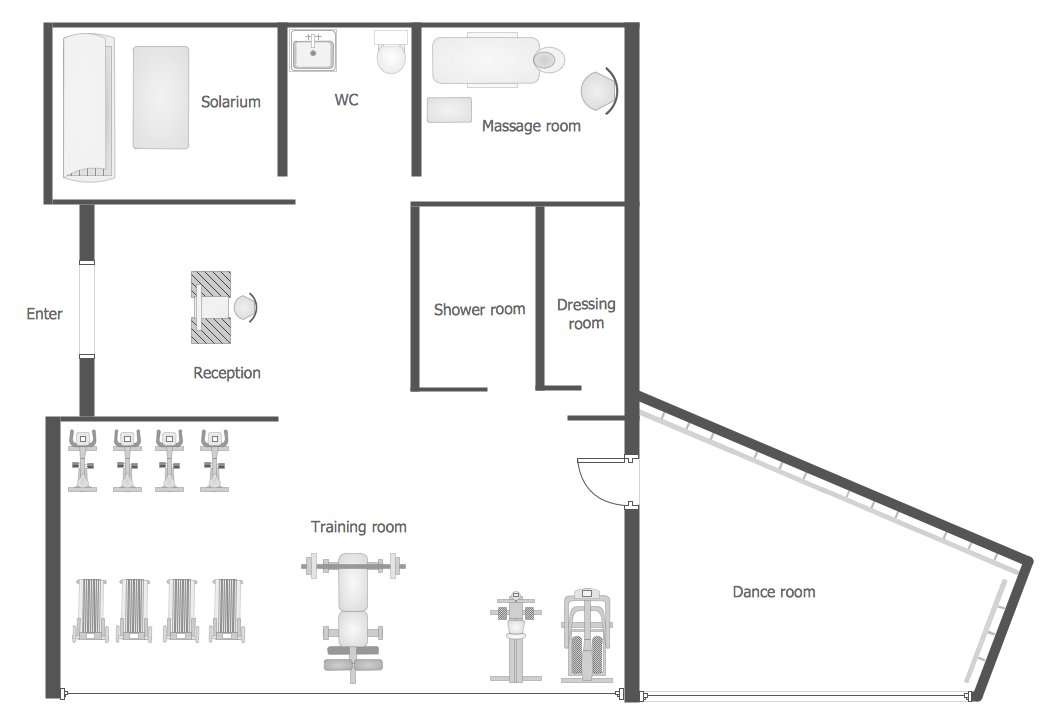 Picture: Gym Workout PlanRelated Solution:There are a lot of structured analysis and design technique methodologies used to describe systems and data sources. To visualize data structures, data flow diagrams can be used for various purposes in the area of software engineering. Nowadays these diagrams are also used in the area of business analysis and information system analysis. This data flow diagram depicts an account processing system of a typical account department of a small manufacturing enterprise. It shows the data transmission through the order processing to shipping verification. This data flow diagram was created according to standard of Yourdon and Coad notation. The vector graphic objects of Yourdon/Coad notation symbols was delivered by ConceptDraw Data Flow Diagrams solution. The current DFD can be employed as an example of a business process model, representing the set of business events and interactions commonly engaged in a accounts receivable process.
 Picture: Data Flow DiagramsRelated Solution:Value Stream Mapping for the lean office is a tool that uses a flow diagram to document in great detail every step of a manufacturing process.
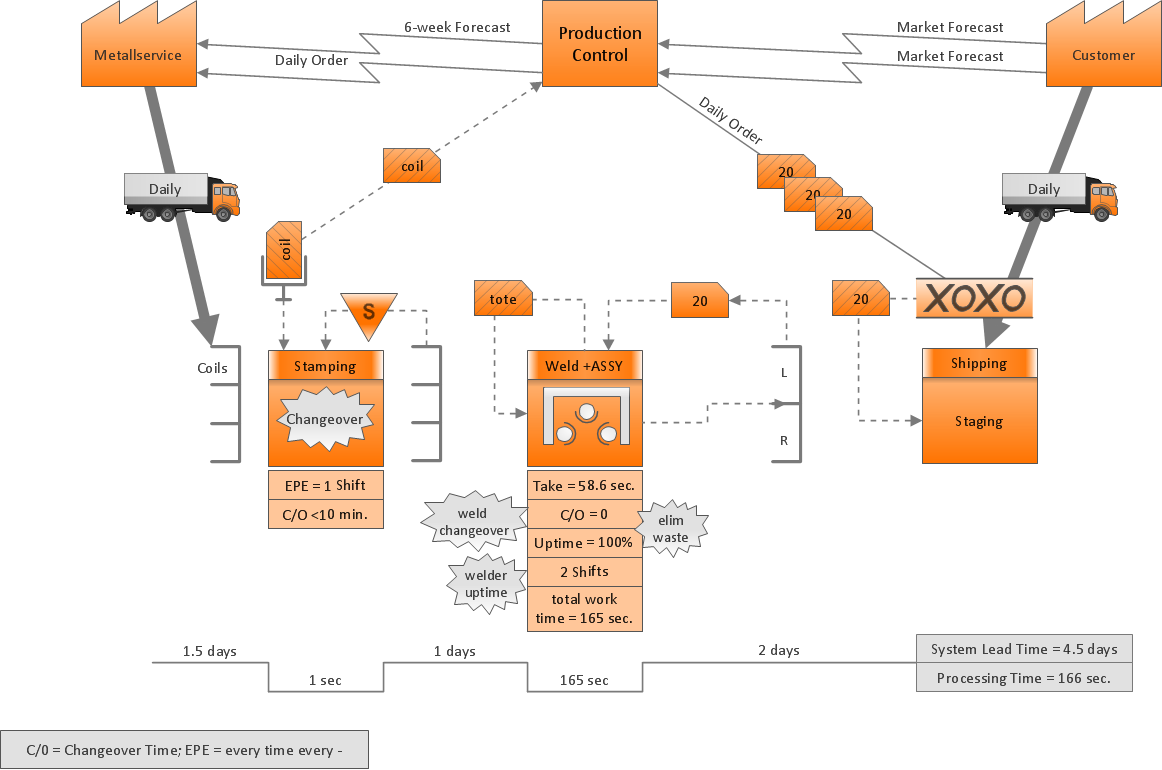 Picture: Value Stream Mapping for the Lean OfficeRelated Solution:Use ConceptDraw DIAGRAM business diagramming and business graphics software for general diagramming purposes, it inludes tousands colored professional flowchart symbols, examples and samples which saves time when you prepare documents, professional presentations or make an explanation of process flow diagram.
 Picture: Flow Chart Design — How to Design a Good FlowchartRelated Solution:UML Diagrams Social Networking Sites Project. This sample was created in ConceptDraw DIAGRAM diagramming and vector drawing software using the UML Use Case Diagram library of the Rapid UML Solution from the Software Development area of ConceptDraw Solution Park. This sample shows the Facebook Socio-health system and is used at the projection and creating of the social networking sites.
 Picture: UML Use Case Diagram Example. Social Networking Sites ProjectRelated Solution:For those who want to know what is a cross functional flowchart and how to draw it, we preared a special library and professional looking templates. Take all the advantage of your drawing software to learn and create such a well-designed flowcharts. Watch the HowTo video to learn more.
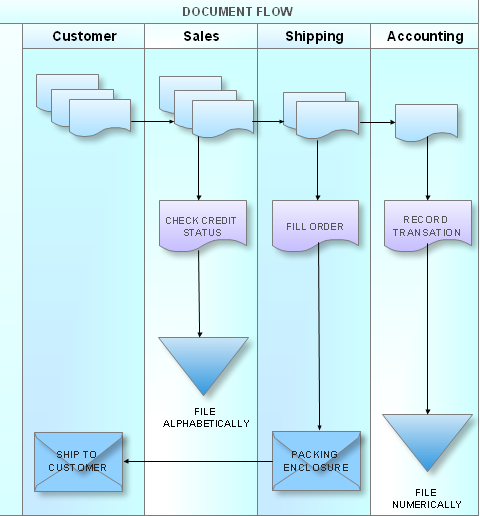 Picture: What is a Cross Functional Flow Chart?A landscape plan depicts all the features of a future garden including buildings, plants, lawns or a patio. Such plan is a very important part of site adjustment because it gives a complete picture of future project.
 Picture: Landscape PlanRelated Solution:Online collaboration tool for workgroups that extends Skype conference call possibilities. This professional solution makes meetings more powerful and discussions more lively. Great way to engage your audience.
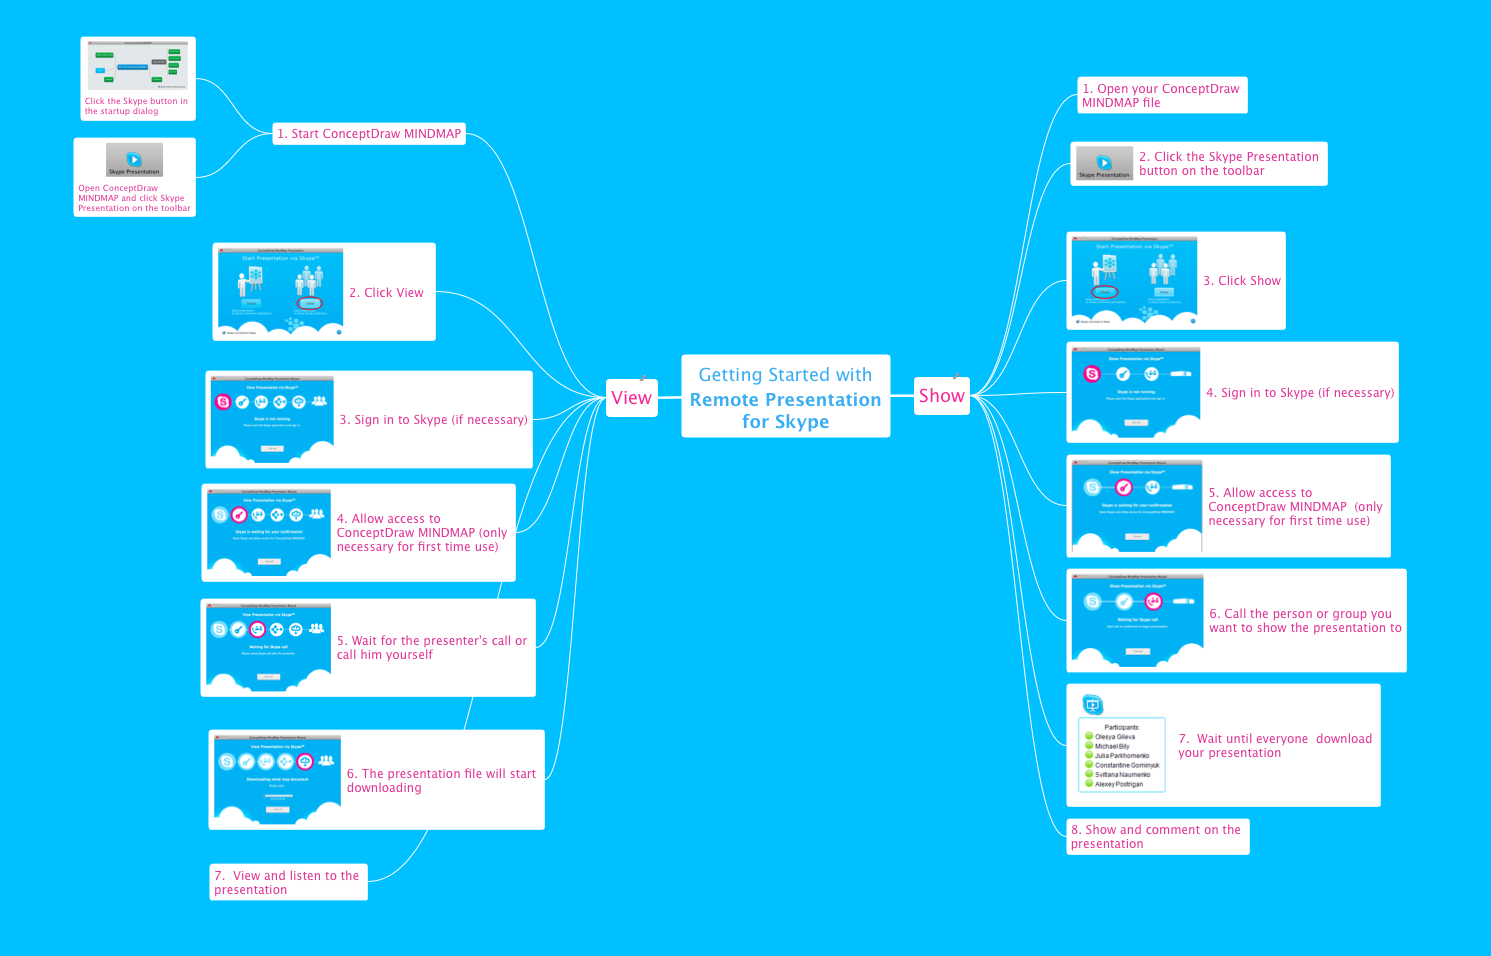 Picture: How To Collaborate via SkypeRelated Solution:Sales process engineering is a complex and labour-intensive process which requires a lot of time, efforts, and powerful software. We recommend to use the ConceptDraw DIAGRAM software enhanced with Sales Flowcharts solution from the Marketing area of ConceptDraw Solution Park. It gives the possibility to easy illustrate all sales process steps and their results.
 Picture: Sales Process StepsRelated Solution:ConceptDrawDIAGRAM 18