
Sample 1. Organization chart - Food bank.
ConceptDraw DIAGRAM diagramming software provides vector shapes and connector tools for quick and easy drawing diagrams for business, technology, science and education.
Use ConceptDraw DIAGRAM enhanced with solutions from ConceptDraw Solution Park to create diagrams to present and explain structures, process flows, logical relationships, networks, design schemes and other visually organized information and knowledge.
TEN RELATED HOW TO's:
Diagramming is an astonishing way to visualize business processes. The list of the most common business process flowchart symbols is quite long starting from basic flowcharts, continuing with SIPOC diagrams. Business process modeling was never easier than now, with special ConceptDraw Business Process Mapping solution.
To carry out all professional standard requirements for business processes mapping, it is necessarily to follow the special graphical notations. ConceptDraw Business Process Mapping solution offers an exhaustive suite of tools to aid business process mapping. There are three vector libraries SIPOC Diagrams, Business Process Flowcharts, and Swim Lanes that contains totally more than 50 symbols of standard BPM notations. This is all that professionals need to effectively evaluate and manage quality in business processes.
Picture: Business Process Flowchart Symbols
Related Solution:
Visual navigation through the stages of a response process helps you locate specific actions to be taken via Action Mind Maps. Use ConceptDraw DIAGRAM and ConceptDraw MINDMAP for organize the process of response for interactions occurring in social media.
Picture: Create Response Charts
Related Solution:
ConceptDraw DIAGRAM es una conocida y popular aplicación de gráficos de negocios y diagramas para Windows y Macintosh. Contiene potentes herramientas de dibujo vectorial, bibliotecas de gráficos con cientos de formas pre-dibujados, soporte para importación y exportación de numerosos formatos de archivos y muchas otras características profesionales.
Picture: Creando Diagramas
You can use many tools to create a representation of a system behavior or a scheme of objects relationships. Some of them are quite abstract and useless, and some, like UML tools help clarifying both the structure and the behavior of a system. There are various types of uml diagrams and tons of examples explaining the difference between them.
UML 2.2 specification has many kinds of diagrams. They are divided into two groups( structure and behavior diagrams). This class diagram shows the hierarchical structure of UML 2.2 specification. Class diagram - the most suitable tool for this task because it is designed to describe basic structure of a system. This diagram can be use as a visual aid for learning UML.
Picture: UML Tool & UML Diagram Examples
Related Solution:
When you are connecting existing objects you can control the diagram structure by changing selection order.
This is how diagramming software should work. You are able to draw a diagram as quickly as the ideas come to you.
Picture: ConceptDraw Arrows10 Technology
If neither of 45 vector shapes of the Cross-Functional Flowcharts solution don't fit your needs, you will want to learn How to create a unique Cross-Functional flowchart.
ConceptDraw Arrows10 Technology - This is more than enough versatility to draw any type of diagram with any degree of complexity.
Drawing software lets you to make horizontal and vertical, audit, opportunity and many more flowcharts.
Picture: How to Create a Cross Functional Flow Chart
Extending ConceptDraw DIAGRAM software with the Baseball solution you receive a complete set of libraries, templates and samples allowing to draw baseball diagrams in seconds. You can start from a template, change positions and get ready diagram in some clicks.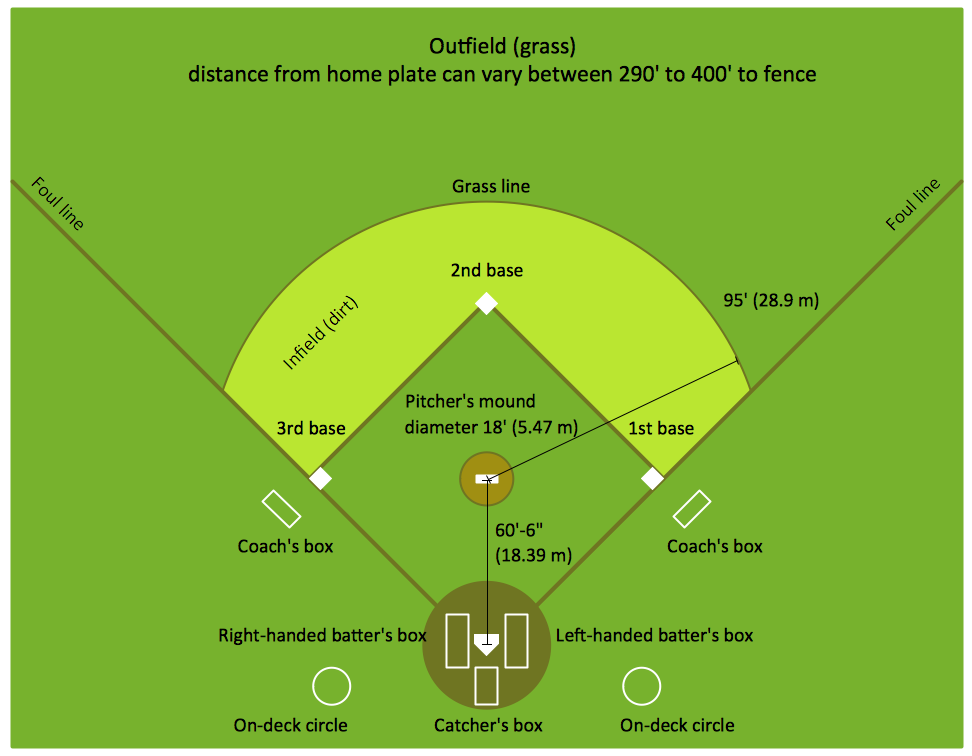
Picture: Baseball Diagram – Colored Baseball Field
Related Solution:
UML Diagrams Social Networking Sites Project. This sample was created in ConceptDraw DIAGRAM diagramming and vector drawing software using the UML Class Diagram library of the Rapid UML Solution from the Software Development area of ConceptDraw Solution Park.
This sample shows the structure of the popular social networking site Linkedin and is used in the business field, in IT, at the projection and creating of the social networking sites.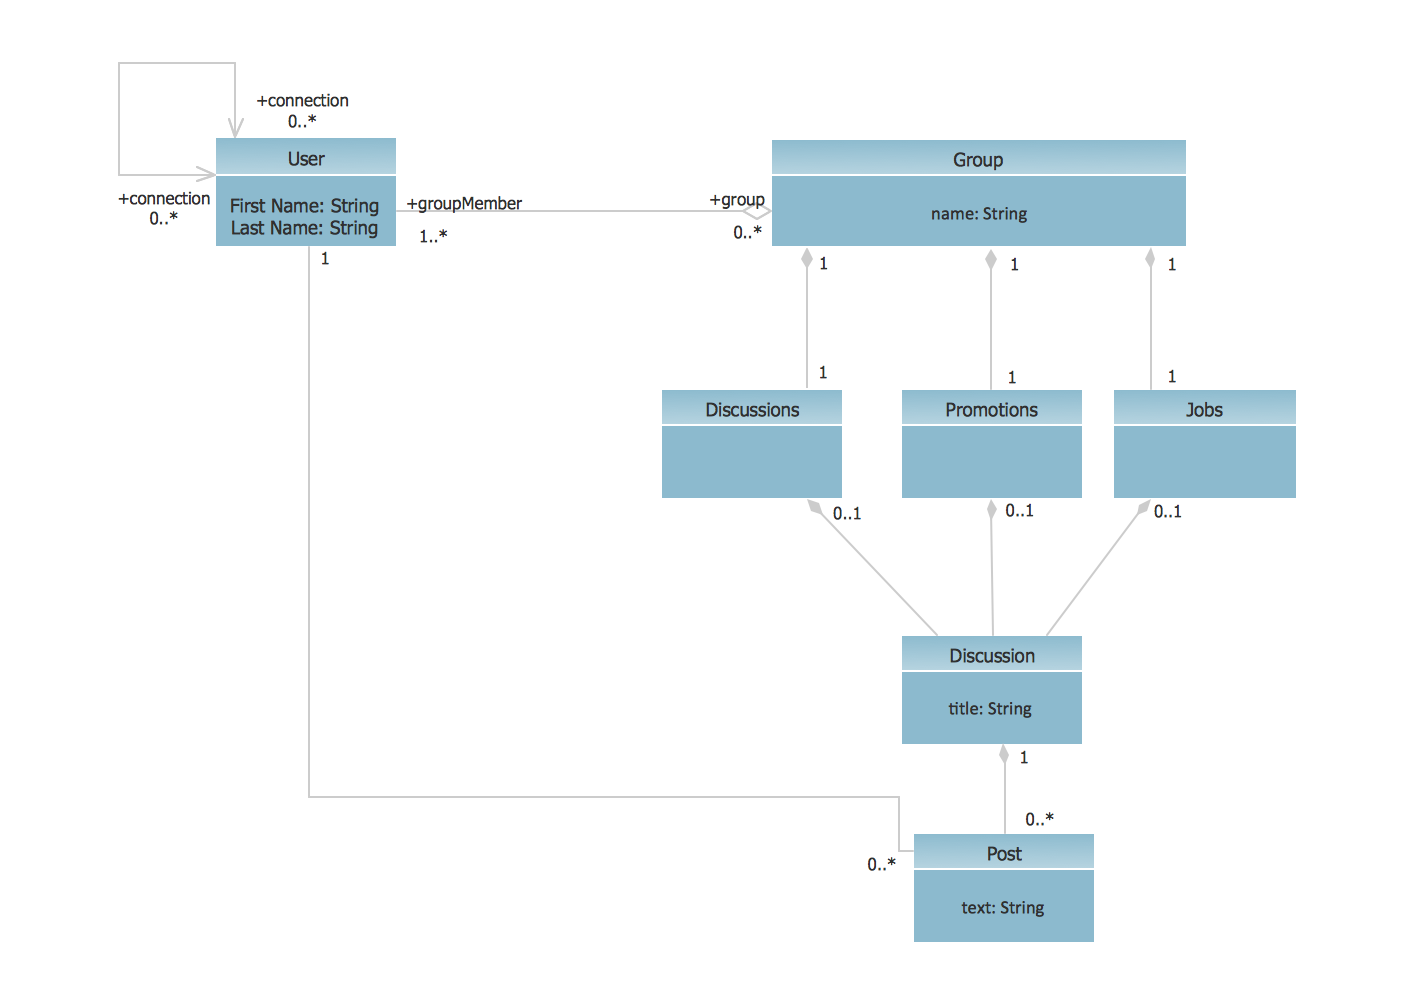
Picture: UML Class Diagram Example - Social Networking Site
Related Solution:
SIPOC is a tool that summarizes the inputs and outputs of one or more processes in table form.
You need to draw professional looking SIPOC Diagram quick and easy? Pay please your attention on ConceptDraw DIAGRAM diagramming and vector drawing software. Extended with Business Process Mapping Solution from the Business Processes Area of ConceptDraw Solution Park, it suits ideal for this.
Picture: SIPOC Diagram
Related Solution:
ConceptDraw is your tool for driving social integration and managing change across and streamline social media processes of your organisation.This tool keeps the entire team on the same page allowing you to realize your social media strategy, improve the quality of your answers, and minimize the time it takes to respond.
Picture: Social Media Response Management DFD Charts - software tools
Related Solution: