Lean Six Sigma Diagram Software
Lean Six Sigma (LSS) is a well-known in all over the world methodology of quality improvement and business perfection. It includes a set of empirical and statistical methods, techniques and tools for processes improvement, and focuses on the development and creation of perfect products and services. At this, the Six Sigma method measures how far a given process recedes from the perfection, lets identify the defects and remove them.
Lean Six Sigma is aimed at the transformation of business performance by improving quality, reducing costs, elimination of waste in processes and creating new opportunities, it allows to generate new markets and higher income and profits.
Lean Six Sigma is a leading method for business success, because continuous efforts to achieve stable and predictable process results have a vital importance for business. This technology includes usually five phase: define, measure, analyze, improve and control and is widely used in all kinds of manufacturing and services, retail, public sector, education, military, municipal sector, catering sector and many other fields.
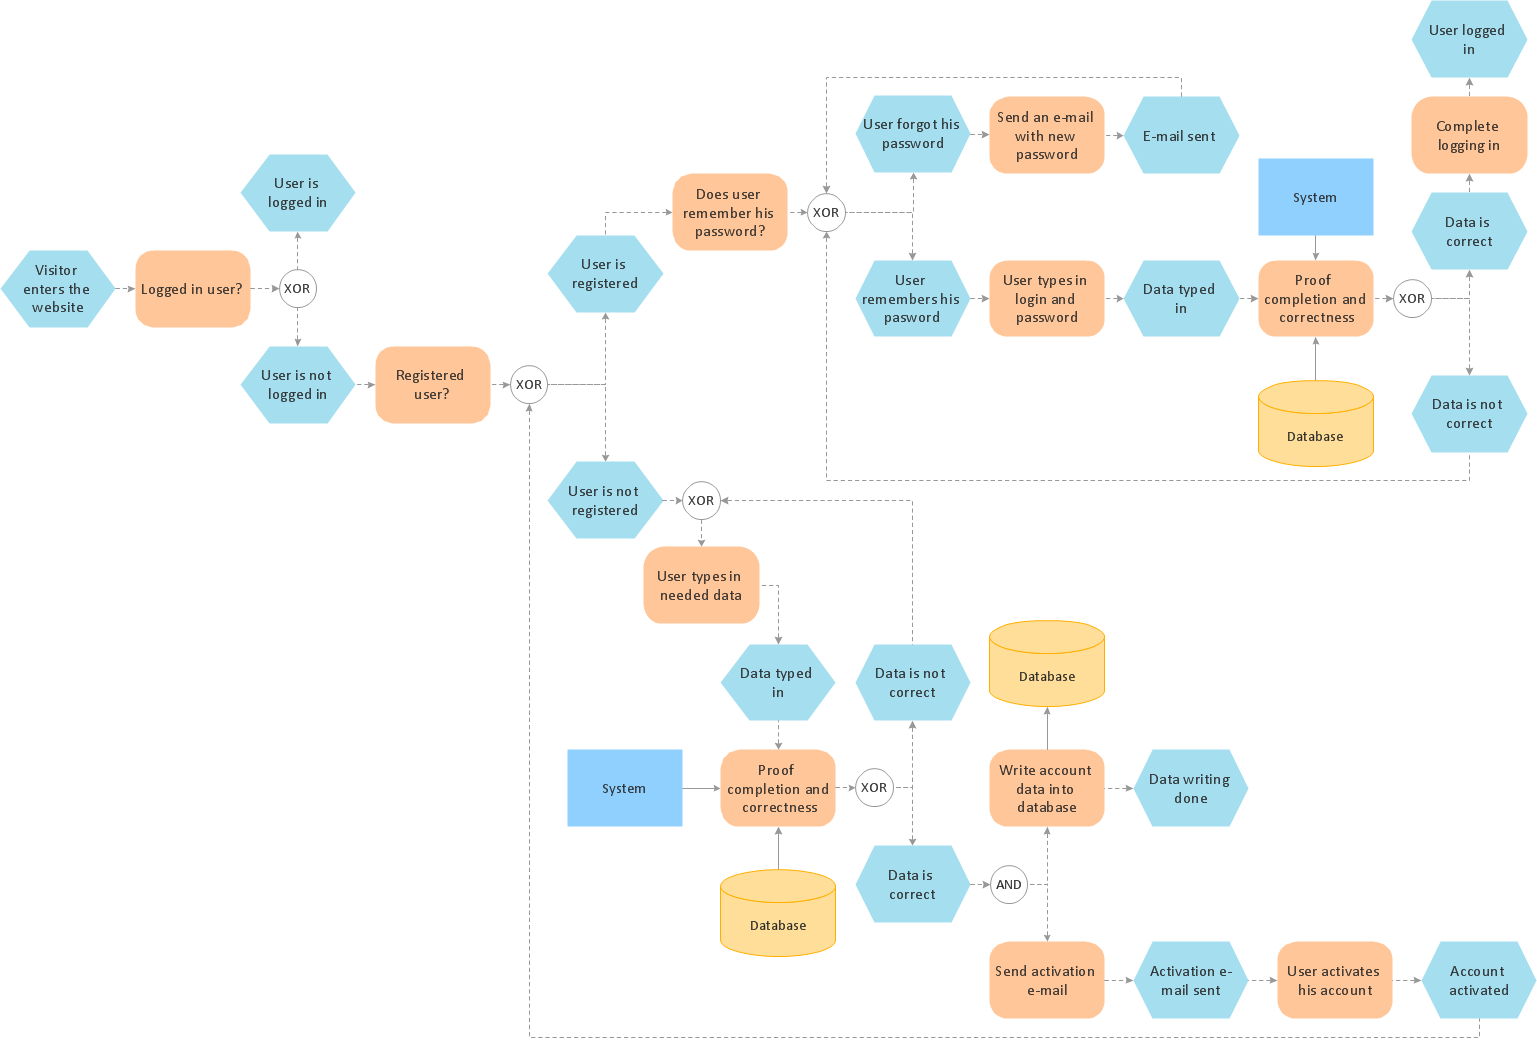
ConceptDraw DIAGRAM diagramming and vector drawing software is a powerful Lean Six Sigma Diagram Software thanks to the included Value Stream Mapping solution from the Quality Management Area of ConceptDraw Solution Park. It is the best for effective drawing the Lean Six Sigma Diagrams, for visualizing the process of manufacturing materials and information flow required to deliver a product/service to customers, for analyzing and identifying the process improvement opportunities.
Pic 1. Lean Six Sigma Diagram Software
The Value Stream Mapping solution offers wide opportunities for ConceptDraw users for easy drawing the Lean Six Sigma Diagrams, among them the Value Stream Mapping library of vector objects and large variety of predesigned templates, samples and examples.
Lean Six Sigma Diagram Elements
The Value Stream Mapping solution includes the Value Stream Mapping library with incredibly large number of predesigned vector objects. Simply dragging them to your document page and arranging, you can design your professional-looking diagram in minutes.

Pic 2. Lean Six Sigma Diagrams Design Elements
Now you can align your objects, connect some of them if needed, apply formatting tools, add pictorial clipart from other ConceptDraw libraries to make your Lean Six Sigma Diagram exceptionally looking. You can also add the legend and type the text to comment your diagram.
Lean Six Sigma Diagram Sample
Pay also attention for the collection of samples offered by Value Stream Mapping solution at ConceptDraw STORE. You can be inspired by them drawing your own diagrams, you can use them as examples or even as the basis for your own Lean Six Sigma Diagrams.

Pic 3. Lean Six Sigma Diagram Sample - Value Stream map Parts
The following features make ConceptDraw DIAGRAM the best Lean Six Sigma Diagram Software:
- You don't need to be an artist to draw professional looking diagrams in a few minutes.
- Large quantity of ready-to-use vector objects makes your drawing diagrams quick and easy.
- Great number of predesigned templates and samples give you the good start for your own diagrams.
- ConceptDraw DIAGRAM provides you the possibility to use the grid, rules and guides. You can easily rotate, group, align, arrange the objects, use different fonts and colors to make your diagram exceptionally looking.
- All ConceptDraw DIAGRAM documents are vector graphic files and are available for reviewing, modifying, and converting to a variety of formats: image, HTML, PDF file, MS PowerPoint Presentation, Adobe Flash, MS Visio.
- Using ConceptDraw STORE you can navigate through ConceptDraw Solution Park, managing downloads and updates. You can access libraries, templates and samples directly from the ConceptDraw STORE.
- If you have any questions, our free of charge support is always ready to come to your aid.
TEN RELATED HOW TO's:
Many things can be listed as potential strengths and weaknesses of a company. To create a good-looking scheme, use SWOT analysis software and enjoy the results within a few minutes. A good practice is to make a SWOT analysis twice a year.
These drawings illustrate the possibilities of ConcptDraw solution for building SWOT and TOWS Matrices. SWOT analysis matrix demonstrates this widely used method for detection of Strengths and Weaknesses, Opportunities and Threats facing any business. If SWOT analysis is carried out properly, it can help to build a good position in the market. The ConceptDraw SWOT and TOWS Analysis solution provides a great number of templates of both SWOT and TOWS matrices. Moreover, this is the only software that offers to carry out SWOT analysis starting from making mind maps. The solution contains SWOT mind map templates. A single mouse click is needed to turn the SWOT mind map into a SWOT matrix. The SWOT diagram will be created in ConceptDraw DIAGRAM on the base of SWOT mind map.
Picture: SWOT Analysis Software: Comprehensive Guide
A Data Flow Diagram (DFD) is a graphical technique which allows effectively model and analyze the information processes and systems. The ability to fast and easy create the DFDs is made possible with Data Flow Diagrams solution from the Software Development area of ConceptDraw Solution Park. For designing the Data Flow Diagrams are used simple DFD flowchart symbols which are connected each other by arrows depicting the data flow from one step to another.
Picture: DFD Flowchart Symbols
Related Solution:
ConceptDraw DIAGRAM diagramming and vector drawing software extended with Sales Flowcharts solution from the Marketing area of ConceptDraw Solution Park offers the set of extensive tools for quick and easy drawing professional looking Sales Process Flowcharts.
Picture: Sales Process Flowcharts
Related Solution:
A waterfall model describes software development process as a sequence of phases that flow downwards. SSADM is one of the implementations of waterfall method. It’s easier to learn about structured systems analysis and design method (SSADM) with ConceptDraw DIAGRAM because this software has appropriate tools for creating data flow diagrams. You can use all the three main techniques of SSADM method with special tools and predesigned templates.
This data flow diagram illustrates the Structured Systems Analysis and Design Method. This method method considers analysis, projecting and documenting of information systems. Data flow models are the most important elements of SSADM and data flow diagrams are usually used for their description. It includes the analysis and description of a system as well as visualization of possible issues.
Picture: Structured Systems Analysis and Design Method. SSADM with ConceptDraw DIAGRAM
Related Solution:
Data processing can be very complex sometimes. If you are interested in facilitating your work with data, it’s time to learn how to draw flowcharts with special software or using just a piece of paper. The list of flowchart basic symbols includes rectangles, diamond, ellipses etc. and is used to represent processes, actions, decisions or data processing.
A well-done flowchart bring the clearness of the sequence of a process stages. There are number of symbols that can be used in flow charts to show various sorts of steps. The basic flowchart can be created using a few of them: Process, Decision, Start/Finish. A basic element of a flowchart represents a simple action and looks like a box, that contains a description of the action. The depicting of actions sequence is made with arrows between corresponding action boxes, as you can see on the sample diagram. Also it shows the symbols for flowchart start and finish steps. ConceptDraw Flowcharts solution provides the ability to build basic flow charts as well as the ones of any size and complexity with a minimum of actions.
Picture: How to Draw a Flowchart: Step-by-Step Guide
Related Solution:
Accounting flowchart is a pictorial way to represent the flow of data in an organization and the flow of transactions process in a specific area of its accounting or financial department. Accounting Flowcharts solution contains the full set of standardized accounting flowchart symbols which will help you design in minutes various types of Accounting Flowcharts including such popular diagrams which represent the whole accounting process: Purchasing Flowchart, Receiving Flowchart, Voucher Payable Flowchart, Treasurer Flowchart, Payment Flowchart.
Picture: Accounting Flowchart Purchasing Receiving Payable and Payment
Related Solution:
Design illustrative maps and explore the geographic diversity of American continents. 🔸 Create detailed maps of North America, South America, Central America, USA, and thematic maps based on them for ✔️ presentations, ✔️ websites, ✔️ social media, ✔️ reports, ✔️ marketing materials, ✔️ educational materials, ✔️ business documents
Picture: Geo Map of Americas
Related Solution:
Using diagrams, you can visualize the flow of the information or build a detailed data structure. There's no need to have a degree in software and database design with ConceptDraw DIAGRAM , because this software has all the tools needed in developing models and diagrams. Project planning, designing and prototyping was never so easy.
This UML diagrams can be used to visualize a model of the data base development process. A UML diagram shows a graphical view of a structure of software system: components and relationships.
Using Unified Modeling Language helps to depict logical and physical elements of a data base, visually represent requirements and sub-systems. UML diagrams allows developers to organize and predict critical issues, as well as collaborate data base information.
Picture: Software and Database Design with ConceptDraw DIAGRAM
Related Solution:
Decision Making - ConceptDraw OFFICE suite provides visual tools that are given support on the stage of the decision making.
The Seven Management and Planning Tools is a set for such diagrams: Affinity Diagram, Relations Diagram, Prioritization Matrix, Root Cause Tree Diagram, Involvement Matrix, PERT Chart, Risk Diagram (PDPC).
Picture: Decision Making
ConceptDraw DIAGRAM is a business flowchart software includes the wide flowchart examples package.
Picture: Basic Flowchart Examples
Related Solution: