
Example 1. 3 Circle Venn Diagram
This Venn Diagram shows the logical intersections between 3 sets.
Using the Business Diagrams Solution for ConceptDraw DIAGRAM you can create your own professional-looking Venn Diagrams quick and easy.
The Venn Diagrams produced with ConceptDraw DIAGRAM are vector graphic documents and are available for reviewing, modifying, and converting to a variety of formats (image, HTML, PDF file, MS PowerPoint Presentation, Adobe Flash or MS Visio).
TEN RELATED HOW TO's:
Fruits are unique products, they are beautiful and delicious, and look amazing in the compositions. Fruits are perfect for decorating various dishes, desserts and beverage. Each composition of fruits is a real fruit art!
ConceptDraw DIAGRAM diagramming and vector drawing software extended with Food Court solution from the Food and Beverage area of ConceptDraw Solution Park perfectly suits for fruit art design and easy drawing attractive food and beverage illustrations.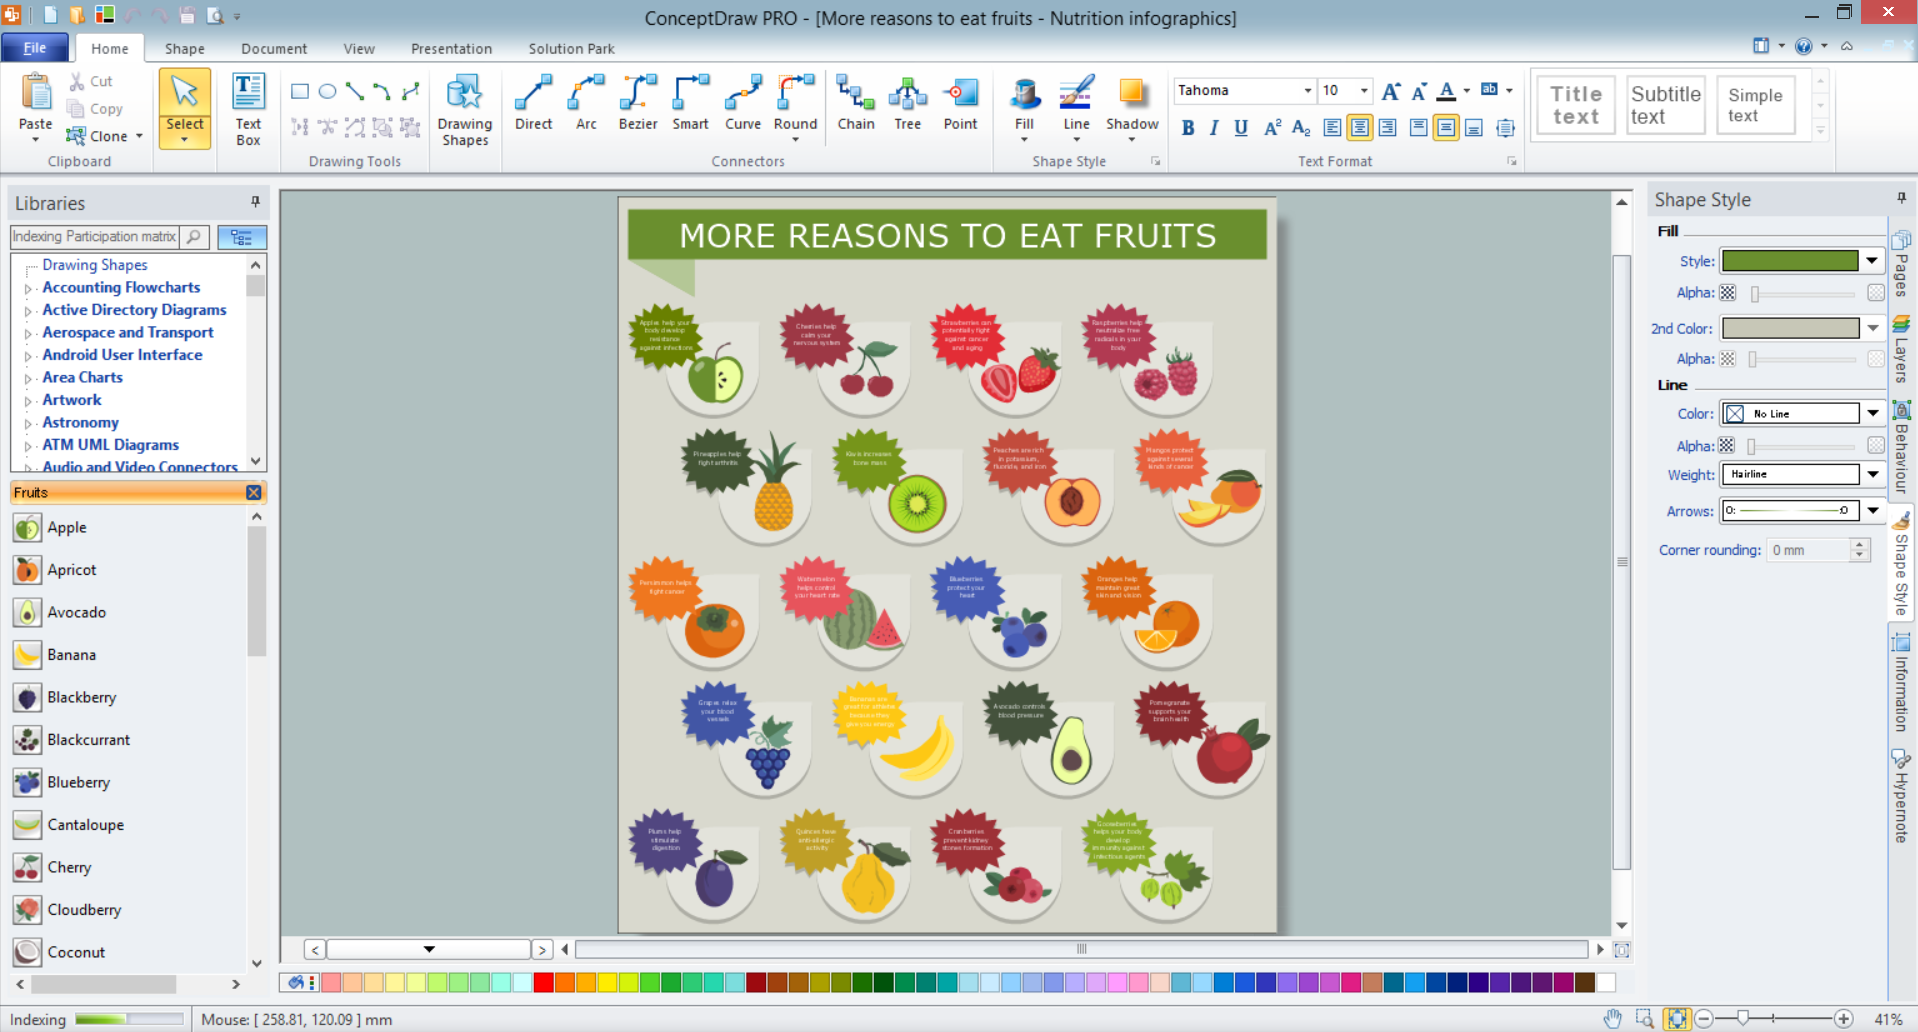
Picture: Fruit Art
Related Solution:
Nature solution expands our software possibilities to create beautiful illustrations and cliparts with the new library which contains 17 vector objects.
Picture: Beauty in nature Illustrations and Clipart
This sample was created in ConceptDraw DIAGRAM diagramming and vector drawing software using the Business Process Diagram Solution from the Business Processes area of ConceptDraw Solution Park. The Business Process Solution is based on the standard BPMN 2.0 and includes the set of libraries of ready-to-use objects.
Picture: BPR Diagram. Business Process Reengineering Example
Related Solution:
ConceptDraw DIAGRAM diagramming and vector drawing software extended with tools of Flowcharts Solution from the Diagrams Area of ConceptDraw Solution Park ideally suits for fast and easy Online Flow Chart designing. We propose to verify this right now.
Picture: Online Flow Chart
Related Solution:
The Total Quality Management Diagram solution helps you and your organization visualize business and industrial processes. Create Total Quality Management diagrams for business process with ConceptDraw software.
Picture: TQM Diagram Tool
Related Solution:
Enjoy the flowcharting process with the intuitive interface and powerful tools of the user-friendly ConceptDraw DIAGRAM software: ✔️ represent algorithms, ✔️ break down complex processes, ✔️ display workflows, ✔️ show procedures, ✔️ succeed in decision-making, ✔️ streamline processes, ✔️ increase productivity, ✔️ enhance efficiency
Picture: Flowcharting Software
Related Solution:
Pyramid diagrams help you visualize information as a triangle divided into horizontal slices. Labelled slices represent a hierarchy. Pyramids are used in marketing presentations to show and analyze hierarchy levels.
3D triangular diagram of DIKW pyramid has 6 levels: measurement, facts, data, information, knowledge, wisdom.
The data component include different scattered signs or symbols which are merely useless until these random objective facts are somehow processed. Data is a resource which has to be manipulated or rearranged to get useful. Information can be extracted from a pile of data, it also can be mined from different data storages.
Picture: Pyramid Diagram
Related Solutions:
Identify and Structure Factors. Use the Affinity Diagram to collect and structure factors that impact on a problem.
ConceptDraw OFFICE suite is a software for identify and structure factors with affinity diagram. This is a grouping and structuring of factors that impact on a problem.
Picture: PROBLEM ANALYSIS. Identify and Structure Factors
How to draw Telecommunications Network Diagram quick, easy and effective? ConceptDraw DIAGRAM offers the unique Telecommunication Network Diagrams Solution from the Computer and Networks Area which will help you.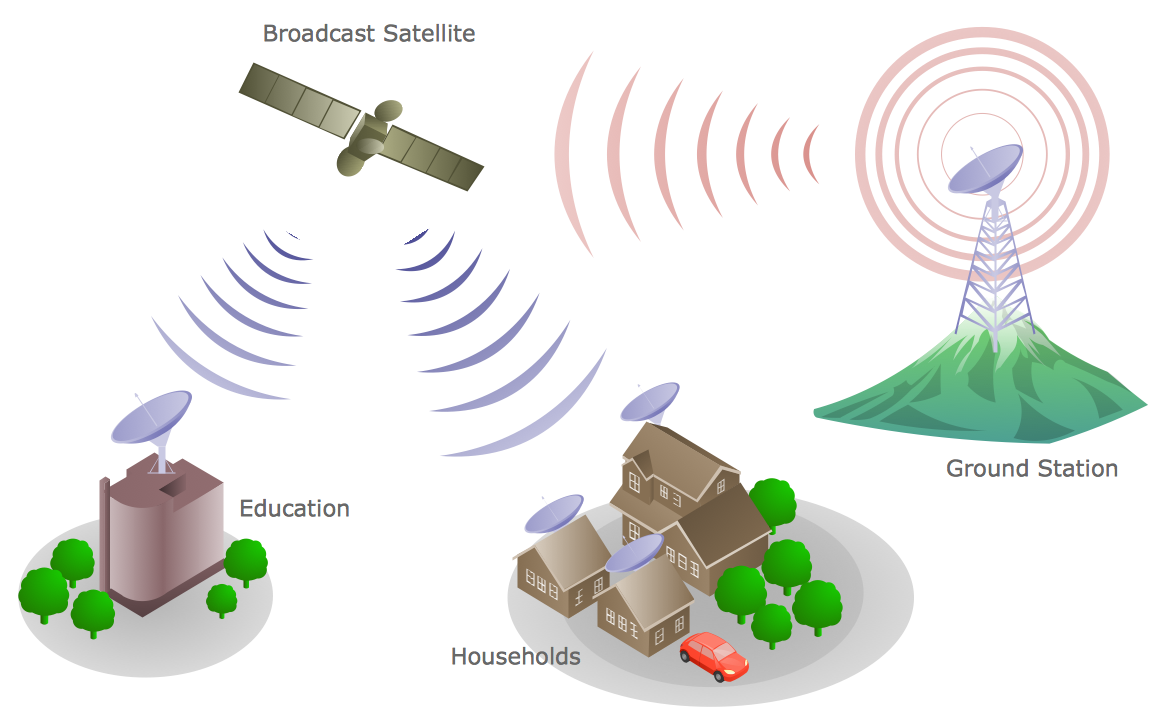
Picture: Telecommunications Network
Related Solution:
The Value stream is a totality of all actions on the projection, order composition and production: starting from creation a product project to launching this product, from order to delivery, from extraction of raw materials to ready product manufacturing. Value stream mapping is a process of visualization of these actions and creation of a detailed and graphical map.
Picture: Value stream with ConceptDraw DIAGRAM
Related Solution: