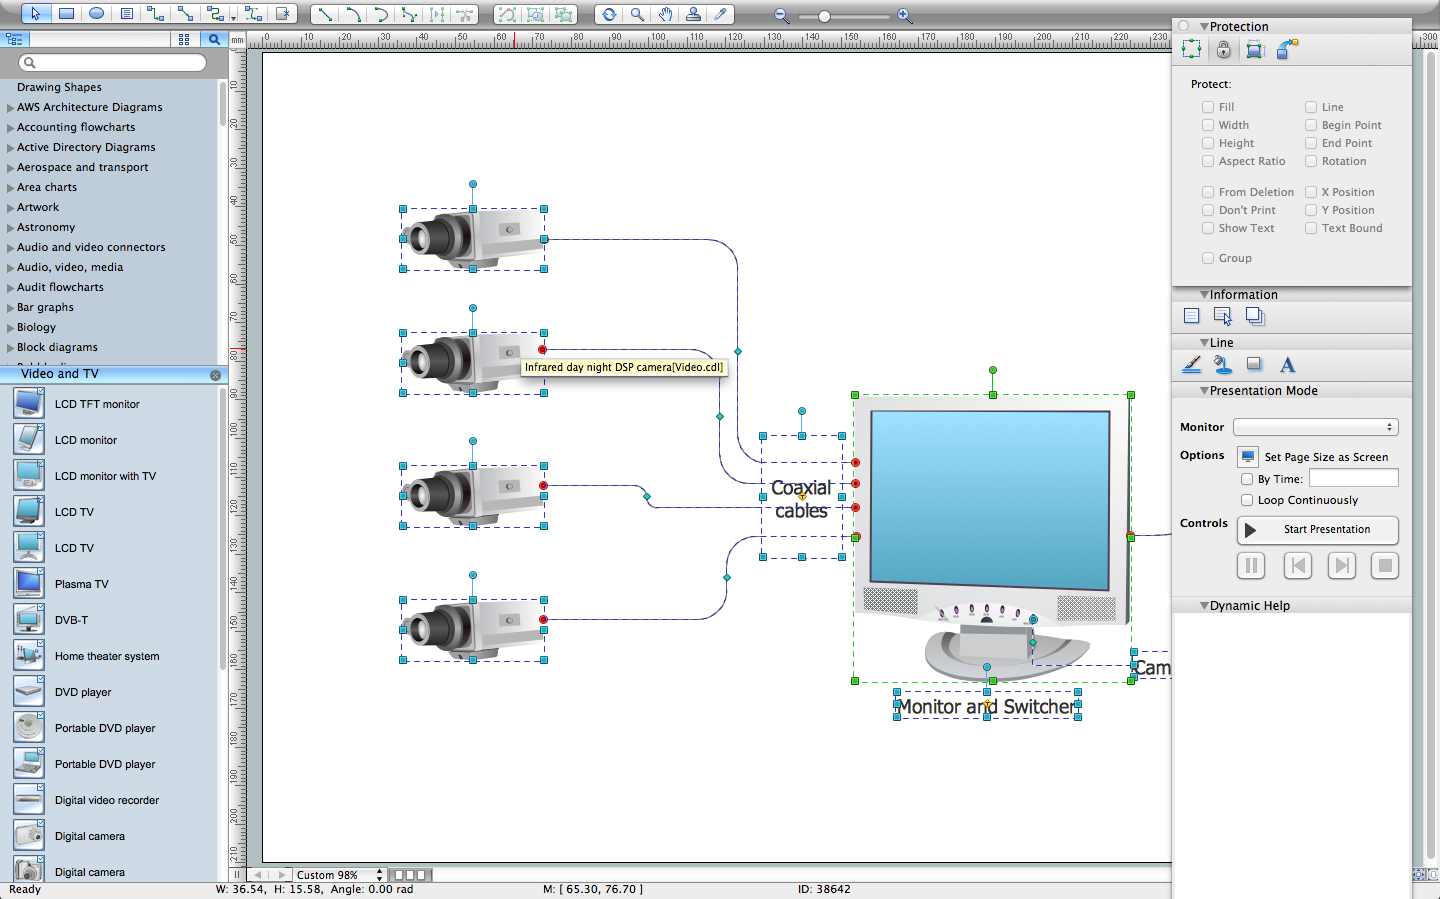
Pic 1. CCTV Network Diagram Software
Audio, Video, Media solution from the Illustration area of ConceptDraw Solution Park provides 4 libraries of vector cliparts of video, audio, TV, media and other digital devices that allow you to design the CCTV network diagrams quick, easy and effective.

Pic. 2. CCTV Network Diagram - Library Objects
Audio, Video, Media solution of ConceptDraw DIAGRAM provides templates and samples that help you to create the professional looking CCTV system diagrams in one moment.

Pic. 3. Audio, Video, Media Solution in ConceptDraw STORE

Pic. 4. CCTV Network Diagram - Wireless Camera Systems
This CCTV system diagram was created in ConceptDraw DIAGRAM diagramming software using the Audio, Video, Media solution from ConceptDraw Solution Park.
Illustrate your CCTV system diagrams using the vector cliparts from the libraries of Audio, Video, Media solution.
The CCTV network diagrams created in ConceptDraw DIAGRAM using the Audio, Video, Media solution are vector graphic documents. They are available for reviewing, modifying or converting to a variety of formats: image, HTML, PDF file, MS PowerPoint Presentation, Adobe Flash or MS Visio.
TEN RELATED HOW TO's:
Talking about companies, that have influenced the entire industry, we should mention Cisco and it’s influence on network design. Nowadays, this equipment has became a kind of standard, and Cisco icons, shapes, stencils, symbols and design elements are easily recognized among others. You can use these icons to develop a network diagram of any complexity.
When dealing with creating a pack of network documentation, system administrator often have to depict a network containing a network equipment of such a well-known manufacturer as Cisco. As Cisco has developed its own production standard icons that are strongly recommended to use in Cisco network diagrams. The best way to draw Cisco Network diagram Cisco certified icons is using ConceptDraw solution for Cisco Network Diagrams. Using Cisco symbols library provided by this solution allows system administrator, or network architect to design a prototype of a new network or document an existing one.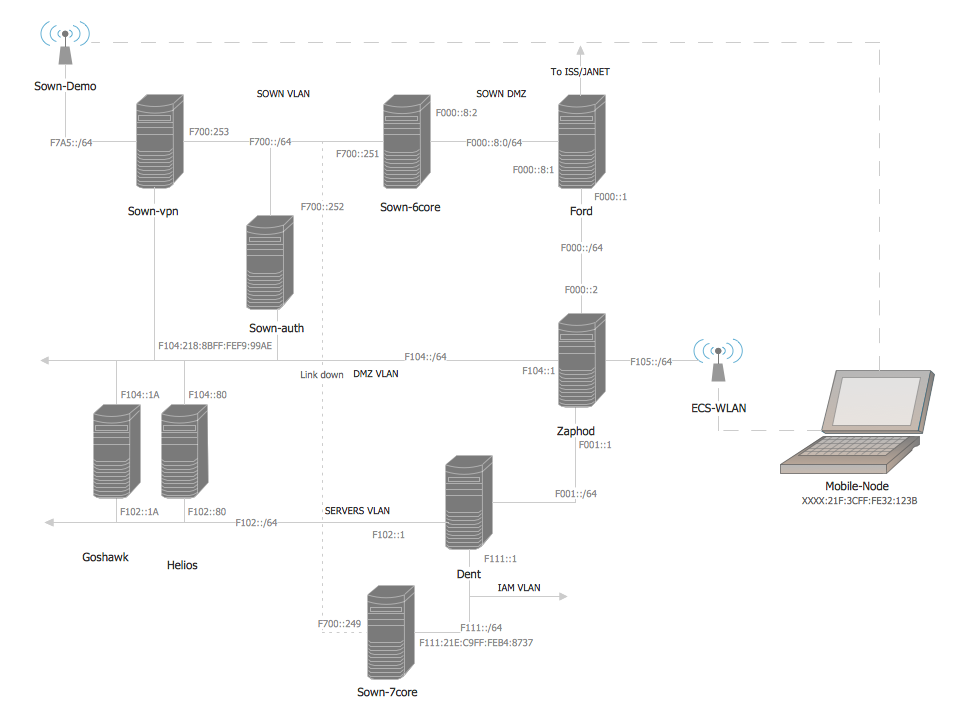
Picture: Cisco Network Design. Cisco icons, shapes, stencils, symbols and design elements
Related Solution:
Communication via Internet nowadays is almost irreplaceable part of lifestyle. It’s needless to say that providing that communication is not a piece of cake, and network diagram software is useful for representing all the interconnections between network devices. These diagrams are also helpful for educational purposes.
This drawing depicts the network topology of the sample web studio. This is a physical type of network diagram. It is depicting the network, end-user equipment and connections between them. The given network has combined the both star and mesh network topology features. This diagram is a tool of network administrator. it delivers the actual information on location of servers, hubs, switches, routers, and other telecommunication equipment. The collection of network related symbols provided with ConceptDraw Network Diagrams solution represents the entire network components. All Symbols are standard. Therefore, network specialists can effortlessly decrypt this diagram.
Picture: Network Diagram Software
Related Solution:
Electrical Engineering Solution used together with ConceptDraw DIAGRAM drawing facilities makes short a work of drawing various electrical and electronic circuit schemes. A library of vector objects composed from symbols of Analog and Digital Logic elements of electric circuit includes 40 symbolic images of logic gates, bistable switches of bi-stable electric current, circuit controllers, amplifiers, regulators, generators, etc. All of them can be applied in electronic circuit schemes for showing both analog and digital elements of the circuit.
Electrical Engineering Solution used together with ConceptDraw DIAGRAM drawing facilities makes short a work of drawing various electrical and electronic circuit schemes. A library of vector objects composed from symbols of Analog and Digital Logic elements of electric circuit includes 40 symbolic images of logic gates, bistable switches of bi-stable electric current, circuit controllers, amplifiers, regulators, generators, etc. All of them can be applied in electronic circuit schemes for showing both analog and digital elements of the circuit.
Picture:
Electrical Diagram Symbols F.A.Q.
How to Use Electrical ConceptDraw Diagram Software
Related Solution:
The ConceptDraw DIAGRAM is a best Network Diagramming software.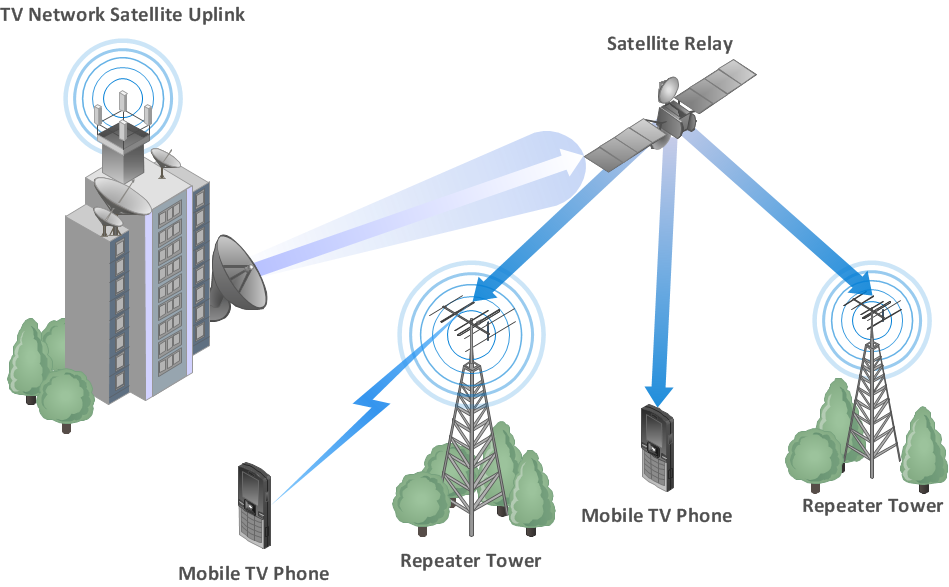
Picture: Building Networks
Related Solution:
Use it to make professional looking documents, presentations, and websites illustrated with color scalable vector clipart for geography, weather, and animals.
Picture: Clipart School Example
Related Solution:
A circuit diagram is sometimes also called an elementary diagram, electronic schematic or electrical diagram circuits. It is essential in construction of any electronic equipment. Among many digital drawing tools available, ConceptDraw DIAGRAM is a leading circuits and logic diagram software, affording for easy and quick creation of even the most advanced and complex diagram designs. This makes it a perfect choice for computer science and any kind of electronic engineering.
This drawing includes the graphic symbols that may be in use while creating a logic circuit diagram. The diagrams of such kind are used in the electronics industry. The logic symbol depicts a device that realizes a Boolean type functions. Practically a logic symbol means transistor, diodes, relays, and other mechanical or optical details which provide function of closing or opening "gates". Totally the logic circuits can involve millions of gates. ConceptDraw Electrical Engineering solution gives the opportunity to create a circuit diagrams both simple and difficult.
Picture: Circuits and Logic Diagram Software
Related Solution:
Enterprise collaboration software helps to facilitate action-oriented teams working together over geographic distances by providing tools that aids on communication, collaboration process and problem solving.
Picture: How To Use Enterprise Collaboration Software
Related Solution:
Set of vector cliparts, samples, templates and libraries helps you to create all sorts of new imagesthe for Money Illustrations.
Various styles of money design elements (currency symbols, clipart, money symbols) can be found in ConceptDraw DIAGRAM Business and Finance Solution.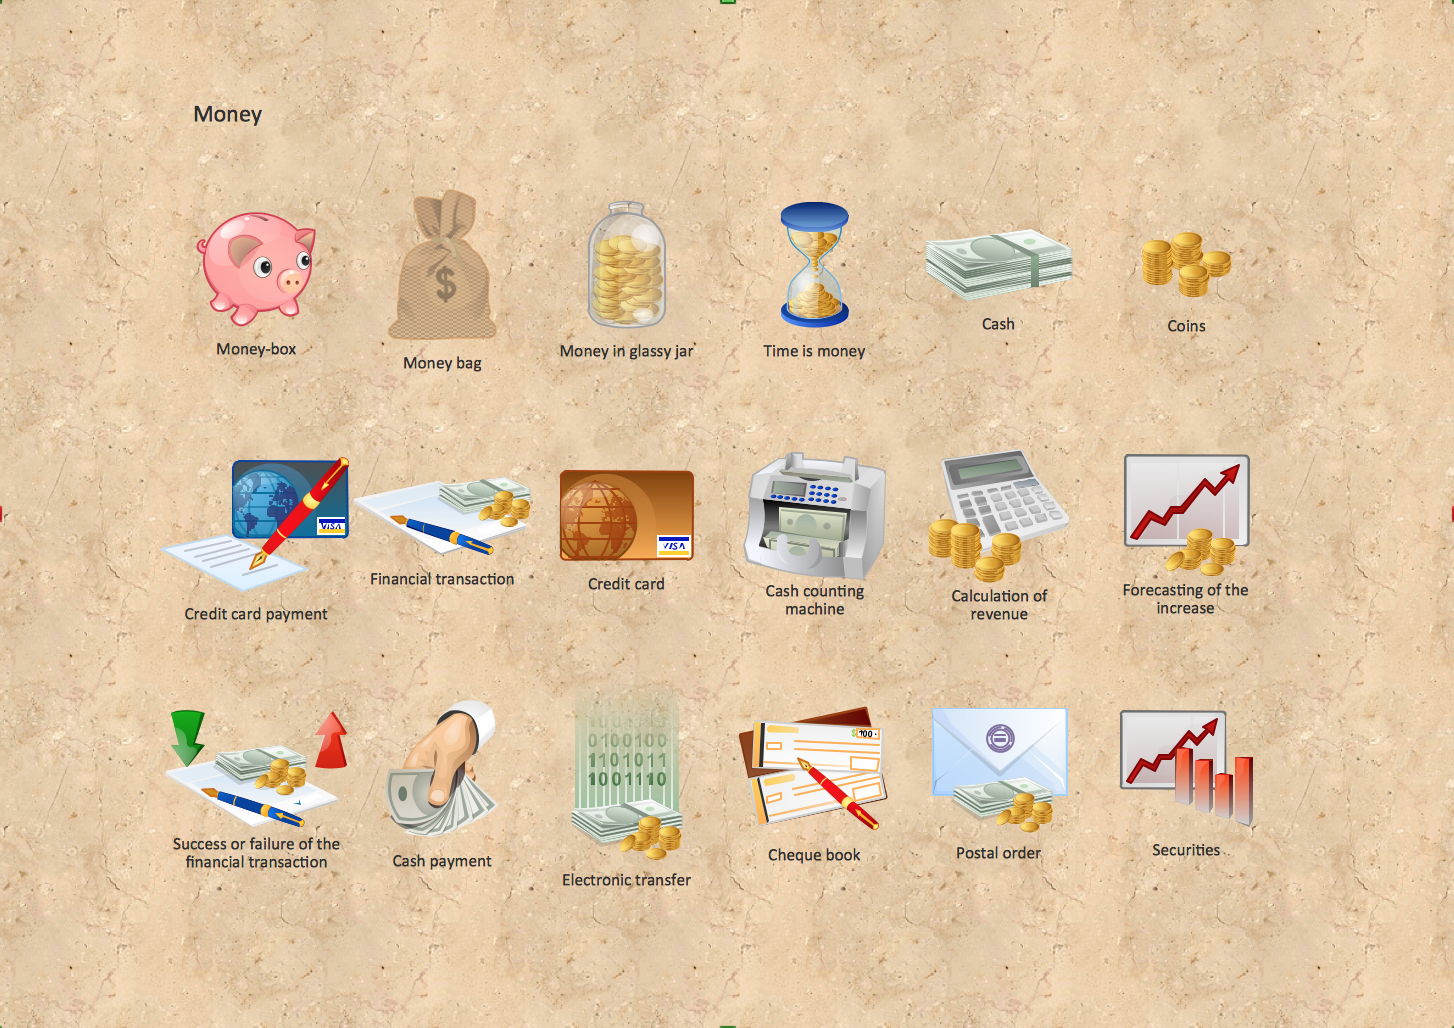
Picture: Money - Design Elements
Related Solution:
This sample shows the Flowchart that displays the layout and work flow of the cloud marketing platform. This diagram has a style of the marketing brochure. This style displays the central product that is related to the other issues.
Using the ready-to-use predesigned objects, samples and templates from the Flowcharts Solution for ConceptDraw DIAGRAM you can create your own professional looking Flowchart Diagrams quick and easy.
Picture: Flowchart Marketing Process. Flowchart Examples
Related Solution:
ConceptDraw Network Diagram is ideal for network engineers and network designers who need to draw Logical Network diagrams.
Picture: Network Diagram SoftwareLogical Network

