Network Diagram Software
Physical Network Diagram
How to draw Physical Network Diagram
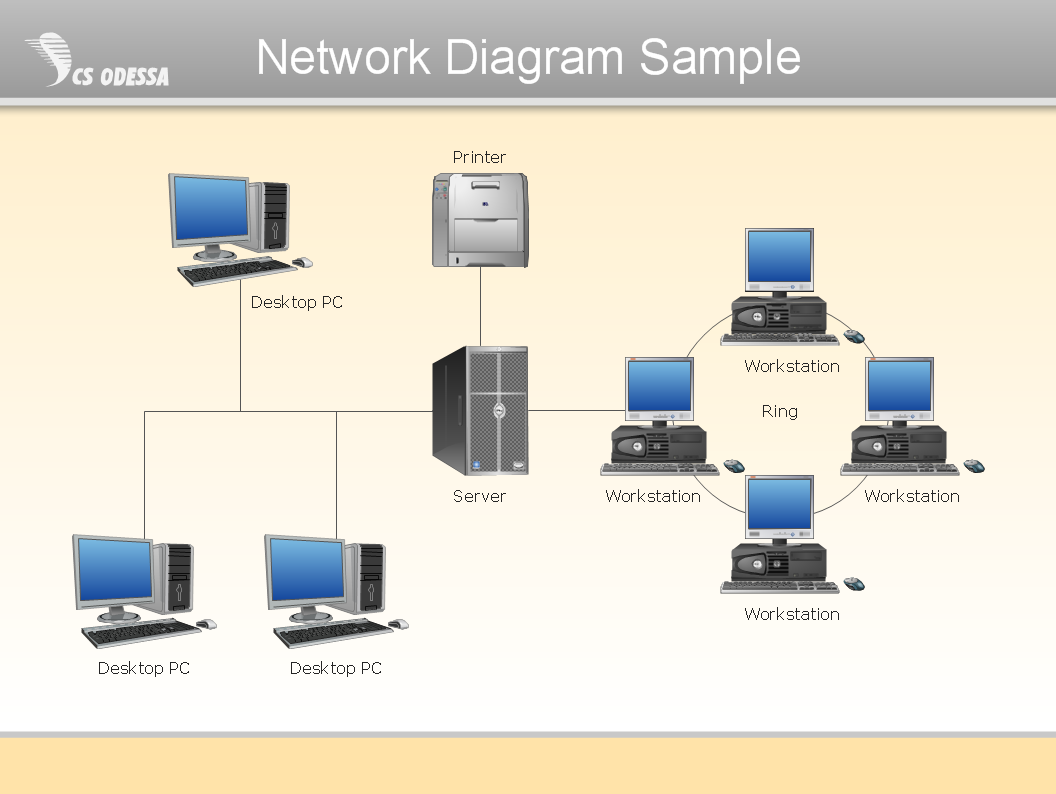
Physical Network Diagrams visualize the communication schemes of Physical Networks, and the networks arrangement in houses, offices and buildings. They are used by IT professionals to visually document the Physical Network structure and arrangement. ConceptDraw has 1004 vector stencils in the 40 libraries that helps you to start using software for designing your own Physical Network Diagrams. You can use the appropriate stencils from Computer and Network Diagrams object libraries.
NINE RELATED HOW TO's:
Computer and Networks solution provides the libraries with large quantity of predesigned vector objects and the great number of templates and samples that will help design the Cable Networks in a few minutes.
Picture: Cable Network. Computer and Network Examples
Related Solution:
Explaining the soccer strategies and techniques is practically impossible without drawing a diagram. ConceptDraw DIAGRAM diagramming and vector drawing software extended with Soccer solution from the Sport area of ConceptDraw Solution Park is a very convenient and useful tool for designing the soccer-related diagrams.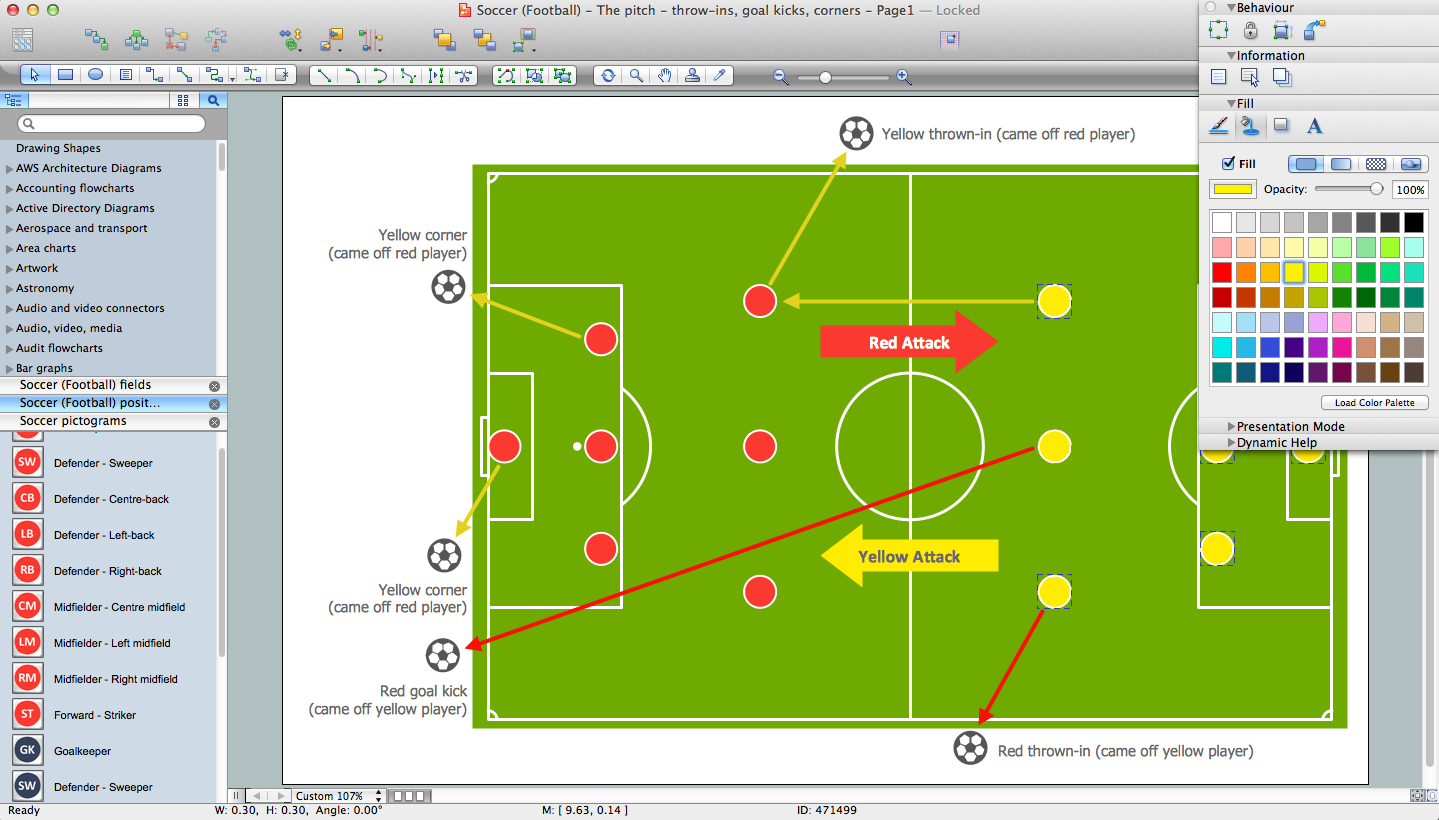
Picture: Soccer (Football) Diagram Software
Related Solution:
This example shows the computer network diagram of the guesthouse Wi-Fi connection to the Internet. On the diagram is displayed the arrangement of the WLAN equipment that provides the Wi-Fi (Wireless Fidelity) access to the Internet on the guesthouse territory.
This sample was created in ConceptDraw DIAGRAM diagramming and vector drawing software using the Computer and Networks solution from Computer and Networks area of ConceptDraw Solution Park.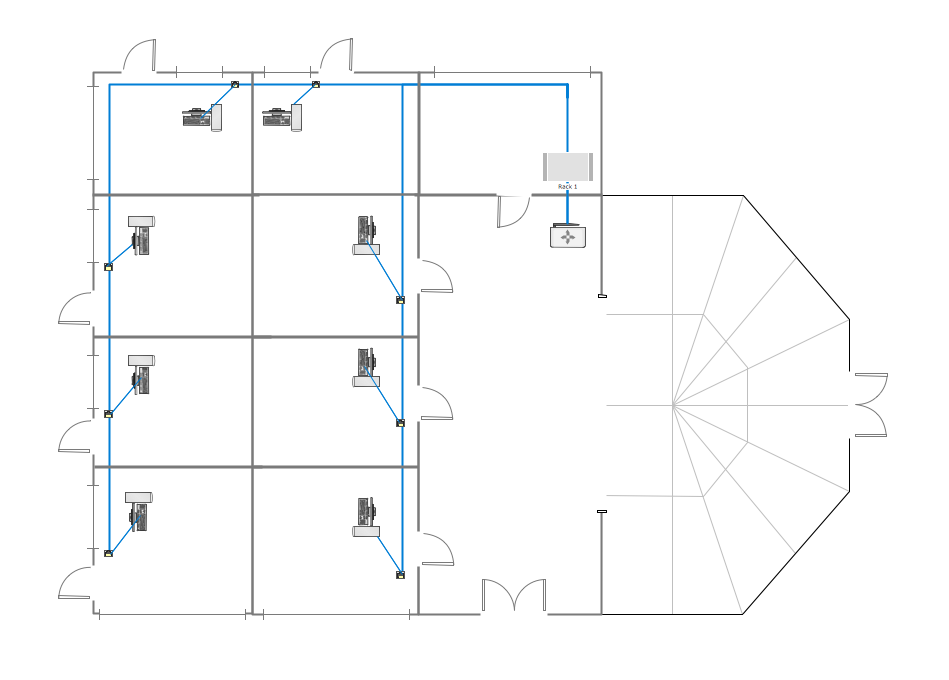
Picture: Guesthouse Network. WIFI network to my guest house
Related Solution:
An abstract representation is usually the first thing you will need while developing a database. To understand the ways that databases are structured, you should look through entity-relationship diagram examples and see the notations features and attributes. With an entity-relationship model you can describe a database of any complexity.
This Entity-relationship diagram is a tool for software developers. It enables every element of database to be managed, communicated and tested before release. This ERD was created using symbols advocated by Chen's notation. Because of a linguistic origin of the Chen’s notation, the boxes representing entities could be interpreted as nouns, and the relationships between them are in verb form, shown on a diagram as a diamond.
Picture: Entity Relationship Diagram Examples
Related Solution:
You need quickly design Gym Layout Plan? ConceptDraw DIAGRAM software supplied with Gym and Spa Area Plans solution from Building Plans area of ConceptDraw Solution Park will help you to handle this task.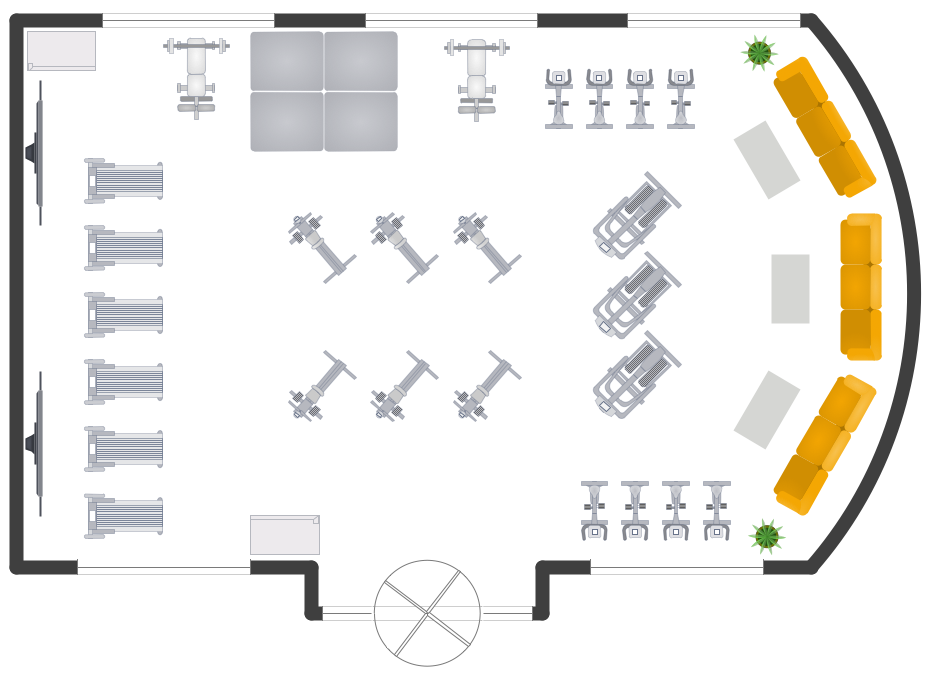
Picture: Gym Layout
Related Solution:
How to draw Telecommunications Network Diagram quick, easy and effective? ConceptDraw DIAGRAM offers the unique Telecommunication Network Diagrams Solution from the Computer and Networks Area which will help you.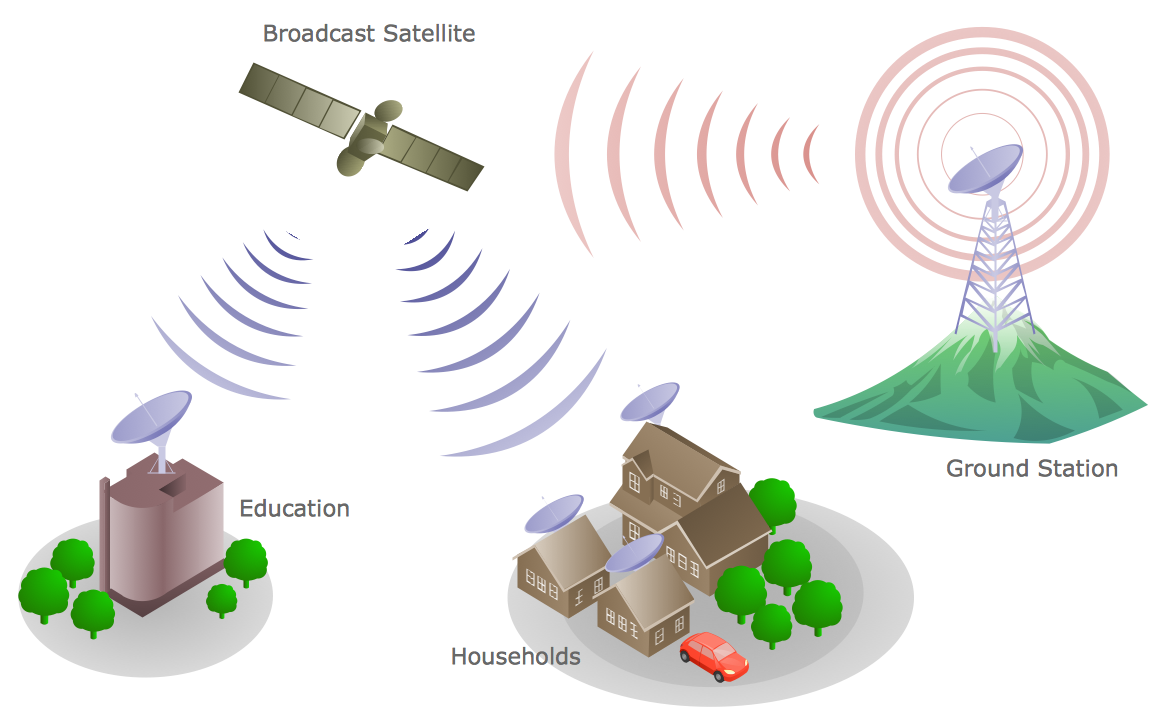
Picture: Telecommunications Network
Related Solution:
What is organizational charts and why your business need them? How to use business process diagram software? Explore how advanced organization chart software transforms the way companies ✔️ visualize, ✔️ communicate, and ✔️ streamline their organizational hierarchies
Picture:
What is an Organizational Chart and how it works?
Organization Chart Software
Related Solution:
Developing a corporate network starts from choosing equipment such as servers or routers. You should choose a topology for your network depending on your needs and budget. Thus, a star topology is cheap to implement, and mesh topology, for instance, is more reliable.
This network diagram illustrates various types of computer network diagrams. Here one can find out the samples of Star, Ring, common Bus and even a rather rare fully connected network topologies. This diverse array of diagrams was created using the ConceptDraw DIAGRAM software and its solution designed especially for computer networking: design and documenting. There are more than 2 thousands graphical symbols of network equipment in the solution's vector libraries. You can create a diagram of any type network, containing any equipment and connections - no matter is it the most ancient or the super-modern network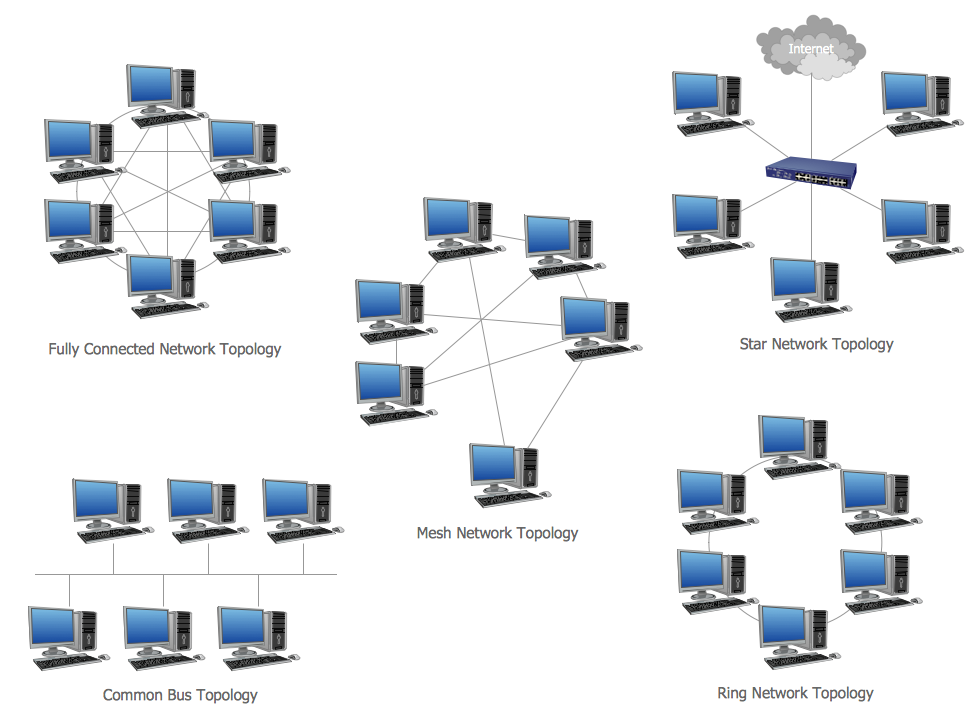
Picture: Network Topology
Related Solution:
A Venn diagram, sometimes referred to as a set diagram, is a diagramming style used to show all the possible logical relations between a finite amount of sets. Having ConceptDraw DIAGRAM software one allows anyone who cares for their drawings to look not only nice but also smart and professional.
Picture:
Venn Diagram Examples for Problem Solving
Computer Science. Chomsky HierarchyRelated Solution:
ConceptDraw
DIAGRAM 18