Made with
ConceptDraw
DIAGRAM 16

Piping and Instrumentation Diagram Software

Piping and Instrumentation Diagram (P&ID)

Piping and Instrumentation Diagram (P&ID) is a technical drawing that shows the details of piping and instrumentation of a processing plant.

P&IDs are developed at the design stage of a plant by process design engineers. Then they are used at the construction and operating the plant by construction teams, operators, instrumentation and piping engineers.

Piping and Instrumentation Diagram (P&ID)

Pic. 1. Piping and Instrumentation Diagrams (P&ID)


Piping and Instrumentation Diagram Software

ConceptDraw piping and instrumentation diagram software works across any platform, meaning you never have to worry about compatibility again. ConceptDraw DIAGRAM allows you to make piping and instrumentation diagram on PC or macOS operating systems.

ConceptDraw DIAGRAM provides Plumbing and Piping Plans solution from the Building Plans area of ConceptDraw Solution Park.

Plumbing and Piping Plans solution helps you create quick and easy:

  • key piping and instrument details
  • piping diagrams
  • instrumentation diagrams
  • schemes of hot and cold water supply systems
  • control and shutdown schemes
  • diagrams of plumbing systems
  • heating schemes
  • schematics of waste water disposal systems
  • safety and regulatory requirements
  • diagrams of ventilation systems
  • mechanical diagrams
  • industrial diagrams
  • basic start up and operational information
Piping and Instrumentation Diagram Software

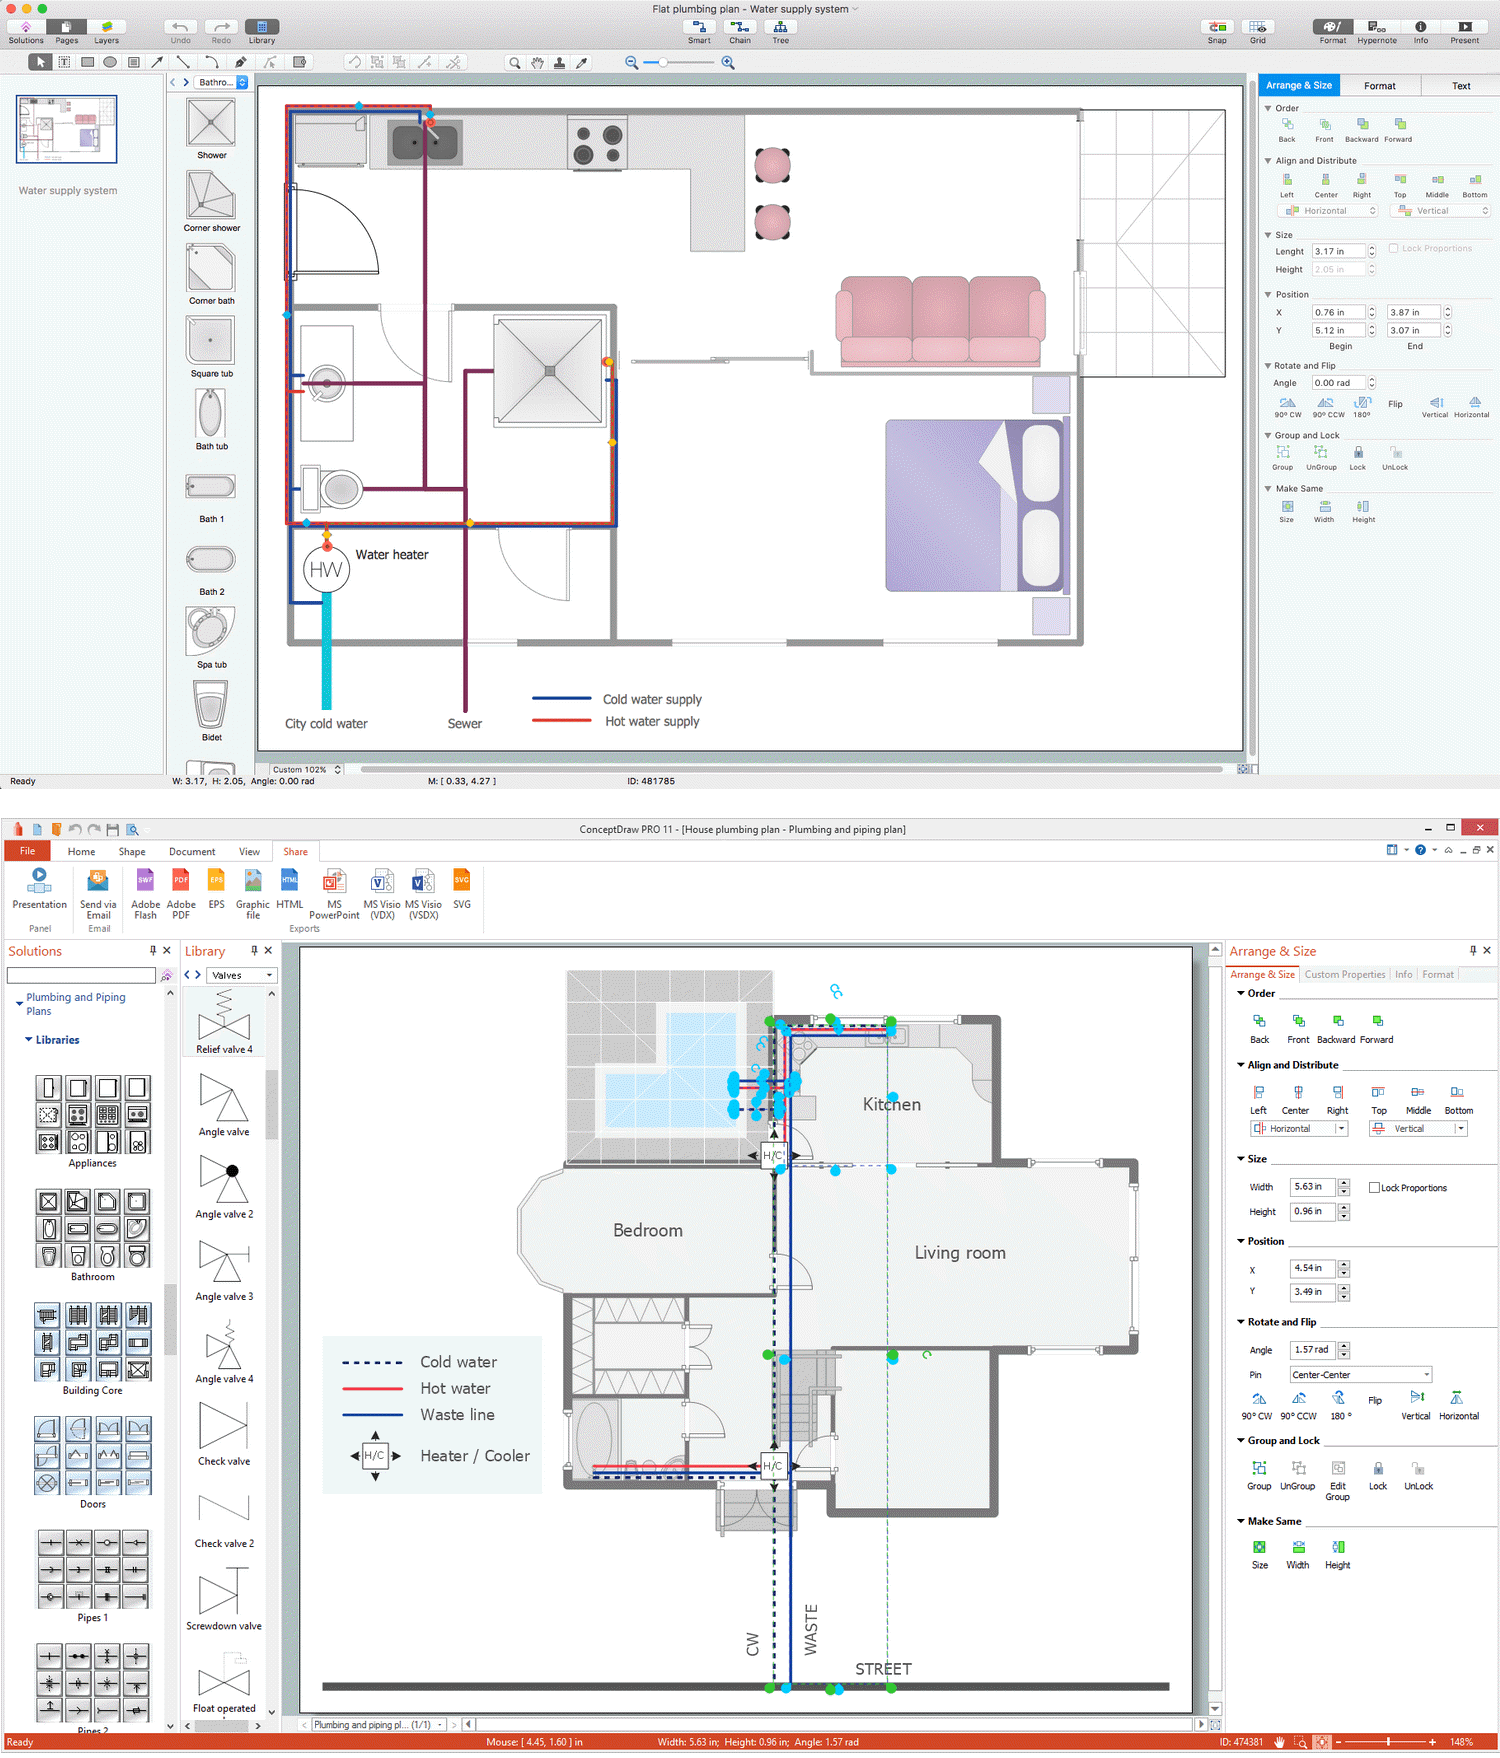
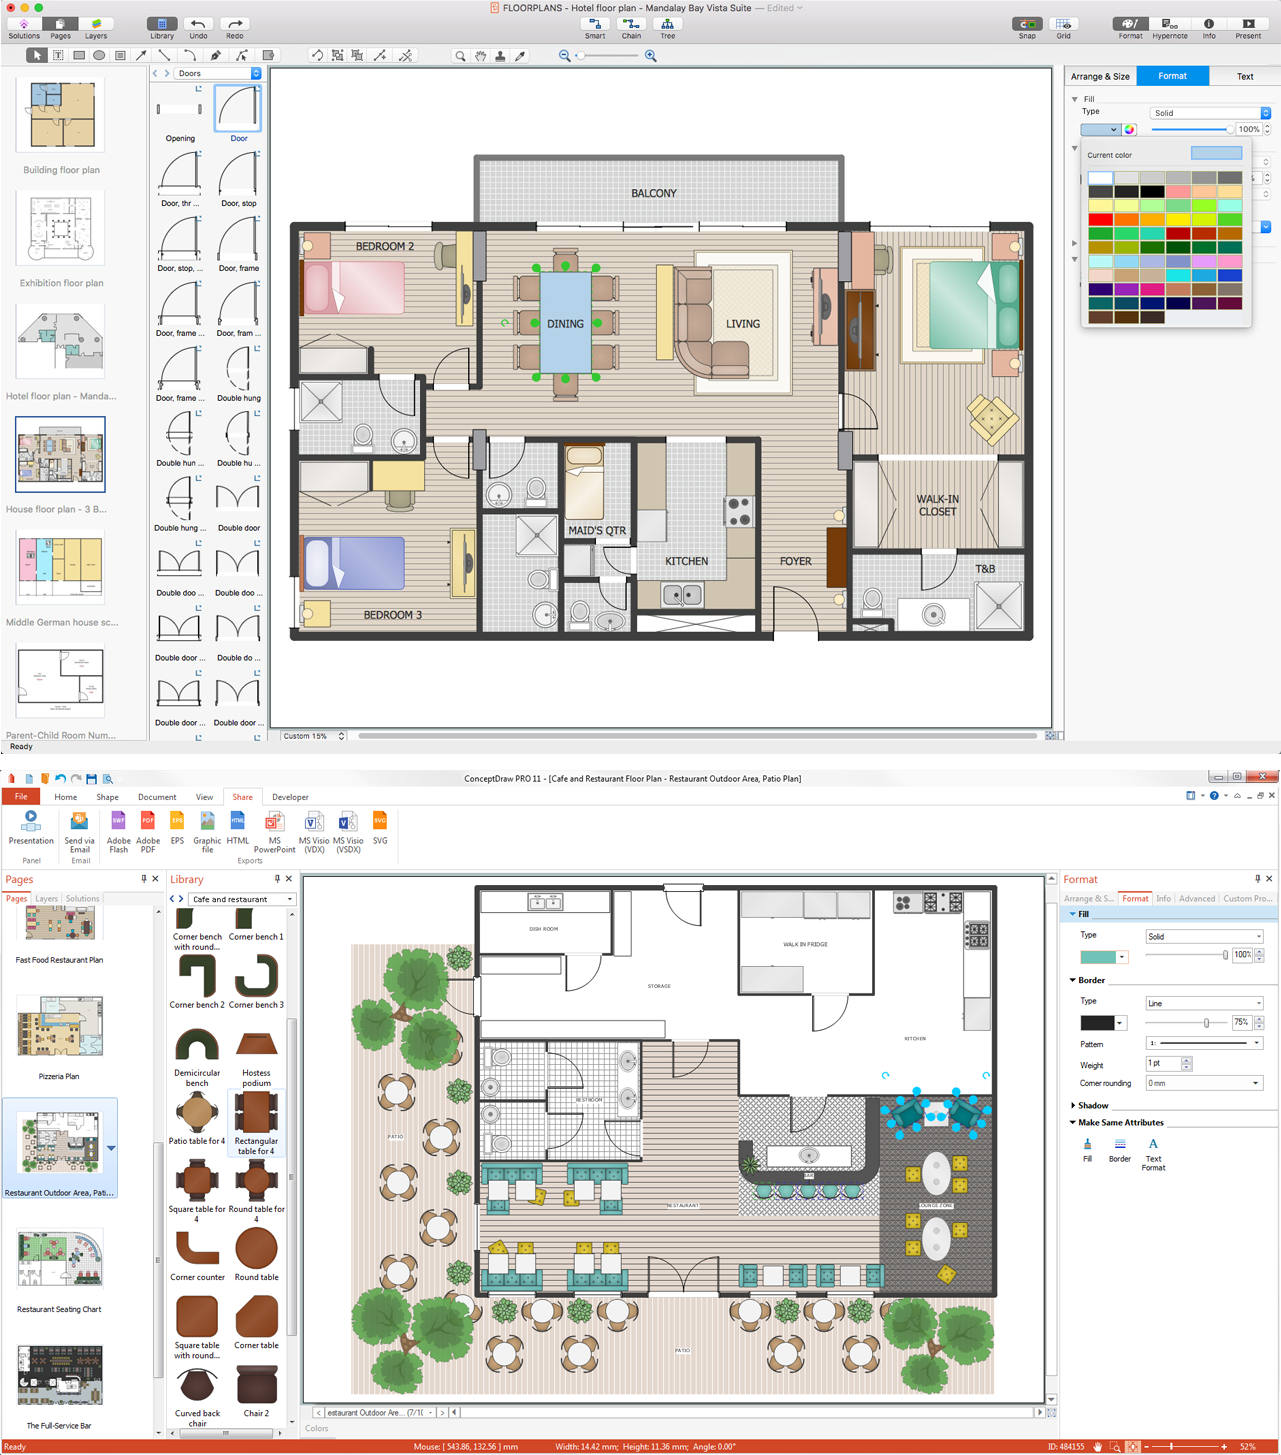
Pic. 2. Piping and Instrumentation Diagram Software


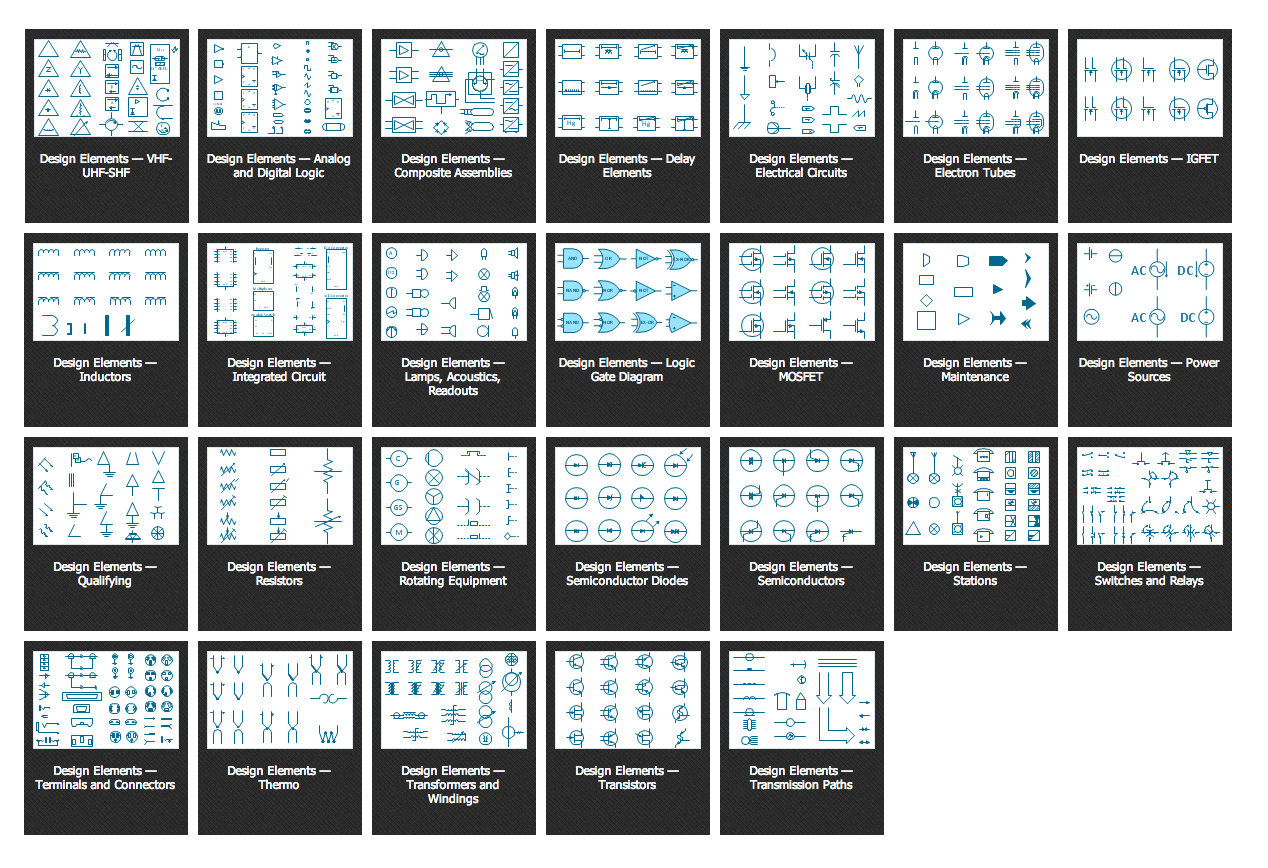
Piping and Valves Symbols

Plumbing and Piping Plans solution from the Building Plans area of ConceptDraw Solution Park provides the following 4 vector stencils libraries:

    Use the design elements libraries "Pipes 1" and "Pipes 2" for drawing plumbing and piping building plans, schematic diagrams, blueprints, or technical drawings of waste water disposal systems, hot and cold water supply systems.

  • Pipes 1 library contains 28 symbols

    Plumbing Piping Plans, Design elements - Pipes 1

  • Pipes 2 library contains 42 symbols

    Piping and Instrumentation Diagram, Design elements - Pipes 2

  • Valves library contains 37 symbols

    Use the design elements library "Valves" to draw building plans, schematic diagrams, blueprints, or technical drawings of industrial piping systems; process, vacuum, and fluids piping; hydraulics piping; air and gas piping; materials distribution; and liquid transfer system.

    Piping and Instrumentation Diagram, Design elements - Valves

  • Plumbing library contains 31 symbols.

    Use the design elements library "Plumbing" for drawing plumbing and piping plans, schematic diagrams and blueprints of waste water disposal systems, and hot and cold water supply systems.

    Piping and Instrumentation Diagram, Design elements - Plumbing

These libraries contain 138 shapes of pipes, valves, pumps, boilers, tanks, and other sanitary equipment. You can simply drag-and-drop them from the libraries into your document and use for designing your piping and instrumentation diagrams.


Piping and Instrumentation Diagram Sample

Plumbing and Piping Plans solution from the Building Plans area of ConceptDraw Solution Park contains a large number of templates and samples.

Pic. 3. Piping and Instrumentation Diagram solution

This sample was created in ConceptDraw DIAGRAM using the Plumbing and Piping Plans solution and shows the Piping and Instrumentation Diagram of the house.

Piping and Instrumentation Diagram Sample

Pic. 4. Piping and Instrumentation Diagram Sample

Use ConceptDraw DIAGRAM diagramming and vector drawing software enhanced with Building Plans solution to draw your own plumbing & piping plans, schematic diagrams, blueprints, annotated diagrams or technical drawings of waste water disposal systems, hot and cold water supply systems, water lines, plumbing systems and waste water engineering.

The Piping and Instrumentation Diagrams produced with ConceptDraw DIAGRAM are vector graphic documents and are available for reviewing, modifying, converting to a variety of formats (image, HTML, PDF file, MS PowerPoint Presentation, Adobe Flash or MS Visio), printing and send via e-mail in one moment.

Read more about Home and Landscape design


TEN RELATED HOW TO's:

Electrical and Telecom Plan Software →

While studying, many of the students encounter the necessity of remaking class projects, over and over. To facilitate this process you can use special electrical and telecom plan software, which helps altering projects in several clicks. Using templates will fasten your work, and you will have more free time. This sample represents an electrical and telecommunication floor plan. Electrical and telecom floor plans contain a floor plan , on which imposed the layout of electrical, and telecommunications equipment. They shows electrical and telecom details regarding the current floor of a building: lightening, fixtures, wires, outlets, circuit panels, etc. Using of standart notation of electrical and telecommunication symbols makes the plan understandable for engineers, architects, constructors, specialist in electricity and telecommunications.Electrical and Telecom Plan Software
Picture: Electrical and Telecom Plan Software
Related Solution:

Process Engineering →

ConceptDraw DIAGRAM diagramming and vector drawing software supplied with Chemical and Process Engineering Solution from the Industrial Engineering Area of ConceptDraw Solution Park is powerful and effective process engineering software.Process Engineering *
Picture: Process Engineering
Related Solution:

Computer Networking Tools List →

Network Diagrams visualize schematically the computer networks topology, equipment nodes and different types of their logical and physical connections. They are widely used by IT professionals to visually document the topology and design of computer and telecommunication networks.Computer Networking Tools List
Picture: Computer Networking Tools List
Related Solution:

Affinity Diagram Software →

Affinity Diagram Software - ConceptDraw DIAGRAM is a powerful diagramming and vector drawing software that allows quick, easy and effective create the Affinity Diagrams. Seven Management and Planning Tools solution from the Business Productivity area of ConceptDraw Solution Park provides templates, samples and ready-to-use vector stencils that will help you design the professional looking Affinity Diagrams in a few moments.Affinity Diagram Software *
Picture: Affinity Diagram Software
Related Solution:

Network Diagram Software. LAN Network Diagrams. Physical Office Network Diagrams →

Local area network connects computers and other network appliances within an area, such as office building or a campus. It can be difficult to provide such network without a predesigned plan. For these purposes you can use network diagram software, which helps you to create LAN network diagrams and office network diagrams quickly and effortless. This will speed up your work and you can save the diagram for the future network improvements. The following diagram illustrates a network topology of the small office. LAN configuration has a star topology. The local network joins 8 computers among which are several desktop PCs, laptop, two iMacs and iBook. The end-point devices are divided into three groups. Each group is connected to its hub. There is a network printer and a modem, which are interconnected with other devices through a network server. Each computer on the LAN can access the server through a corresponding hub.LAN Network Diagram
Picture: Network Diagram Software. LAN Network Diagrams. Physical Office Network Diagrams
Related Solution:

Electrical Schematics →

ConceptDraw DIAGRAM diagramming and vector drawing software extended with Electrical Engineering Solution from the Industrial Engineering Area of ConceptDraw Solution Park affords you the easiest and fastest way for designing professional looking Electrical Schematics.Electrical Schematics *
Picture: Electrical Schematics
Related Solution:

Electrical Symbols — Terminals and Connectors →

An electrical connector, is an electro-mechanical device used to join electrical terminations and create an electrical circuit. Electrical connectors consist of plugs (male-ended) and jacks (female-ended). The connection may be temporary, as for portable equipment, require a tool for assembly and removal, or serve as a permanent electrical joint between two wires or devices. 26 libraries of the Electrical Engineering Solution of ConceptDraw DIAGRAM make your electrical diagramming simple, efficient, and effective. You can simply and quickly drop the ready-to-use objects from libraries into your document to create the electrical diagram.Electrical Symbols — Terminals and Connectors
Picture: Electrical Symbols — Terminals and Connectors
Related Solution:

Electrical Schematic →

You need design Electrical Schematic and dream to find the useful tools to draw it quick and easy? ConceptDraw DIAGRAM offers the unique Electrical Engineering Solution from the Industrial Engineering Area which will effectively help you!Electrical Schematic *
Picture: Electrical Schematic
Related Solution:

Workflow Flowchart Symbols →

The Workflow diagrams are the specialized type of flowcharts which allow to visualize any sorts of step-by-step processes. They are usually created as flowcharts, with objects that represent in a simple visual manner the steps in the process connected by arrows that indicate the next step. The ability easily create Workflow diagrams visually describing the tasks, documents associated with the tasks, people which are responsible for execution at each stage of workflow is made possible with Workflow Diagrams solution. This solution extends ConceptDraw DIAGRAM with a Workflow Diagram library that contains large collection of predesigned workflow flowchart symbols.Workflow Flowchart Symbols *
Picture: Workflow Flowchart Symbols
Related Solution:

Waterfall Bar Chart →

Waterfall chart shows the changing of the value from one state to another through the series of intermediate changes. The waterfall diagrams are widely used in the business. They are used to represent the set of figures and allow link the individual values to the whole.Waterfall Bar Chart *
Picture: Waterfall Bar Chart
Related Solution:
ConceptDraw
DIAGRAM 16