How to Draw a Landscape Design Plan
What is landscape design? It's a floor plan but for an outdoor area. Same as a floor plan, a landscape design represents visually any site using scaled dimensions. Usually, landscape plans include both - natural objects, like flowers, trees, and grass and man-made objects such as lawn furniture, fountains, ponds and sheds. It may also include overlays for irrigation and lighting elements.
The main purpose of landscape design is to plan the layout for an outdoor area no matter is it a personal site plan for your home or a commercial plan for business. It may also be handful when a new installation, repair or even an outdoor event is planning.
It helps to calculate time and decide which materials should be used in your project. Landscape designs perfectly gives the property owner and landscape contractor better vision for cost estimation, helping to ensure the project time and budget.
ConceptDraw DIAGRAM diagramming and vector drawing software offers the unique Landscape & Garden Solution from the Building Plans area for effective development the landscape design.
Landscape & Garden Solution provides the extensive drawing tools and 14 libraries with 420 vector graphics shapes for creating the landscape design plan in a few minutes:
- Bushes and Trees
- Dimensioning
- Flowers and Grass
- Garden Accessories
- Garden Furniture
- Garden Paths and Walkways
- Home Plan
- Outdoor Recreation Space
- Patios
- Plots and Fences
- Plumbing
- Ponds and Fountains
- Roofs
- Transparent Trees
Steps to Creating a Landscape Design Plan
- Start new document.
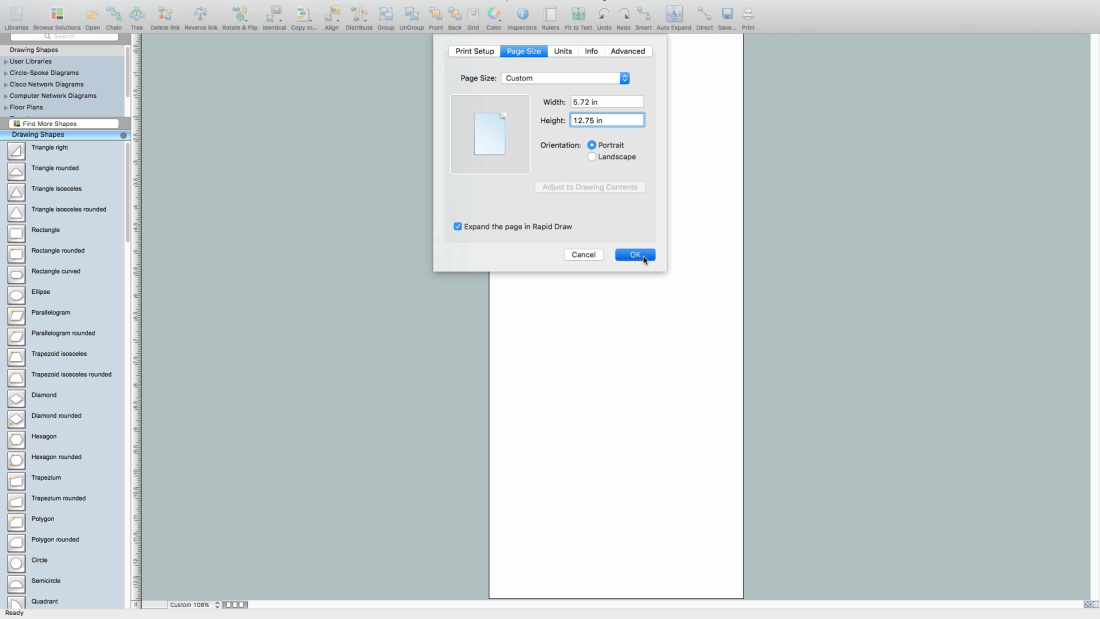
- Set the page size.
- Place a Rectangular plot without fence, set a size equal your site.
-
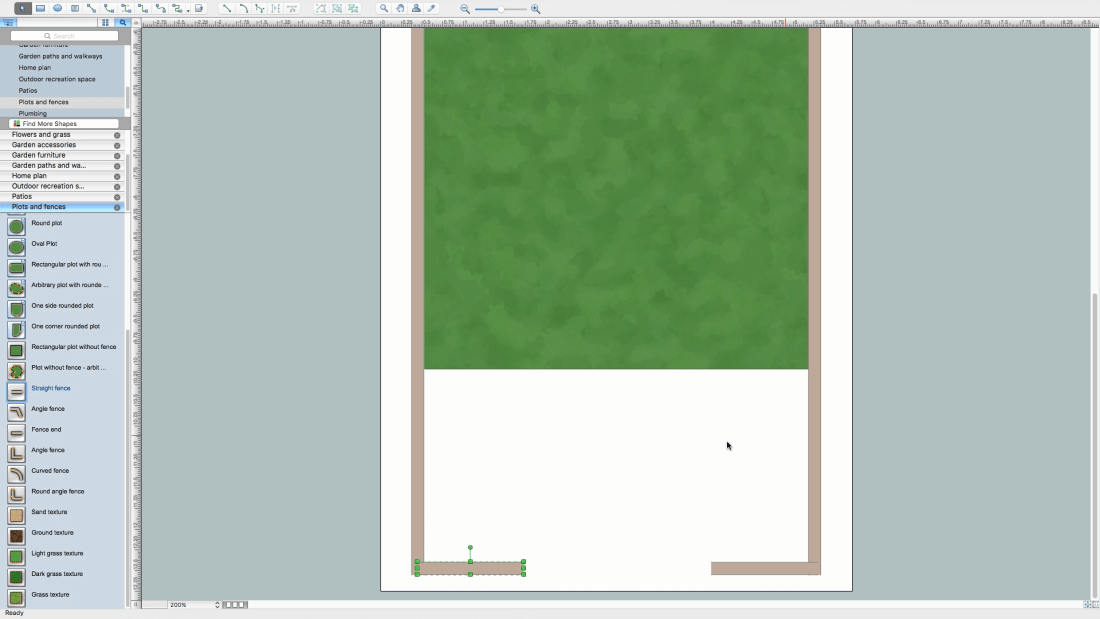
Surround your site with a fence, using Straight fence object.
- Add to your drawing a Stone arch, use Rotate button from ribbon to place an object in needed position.
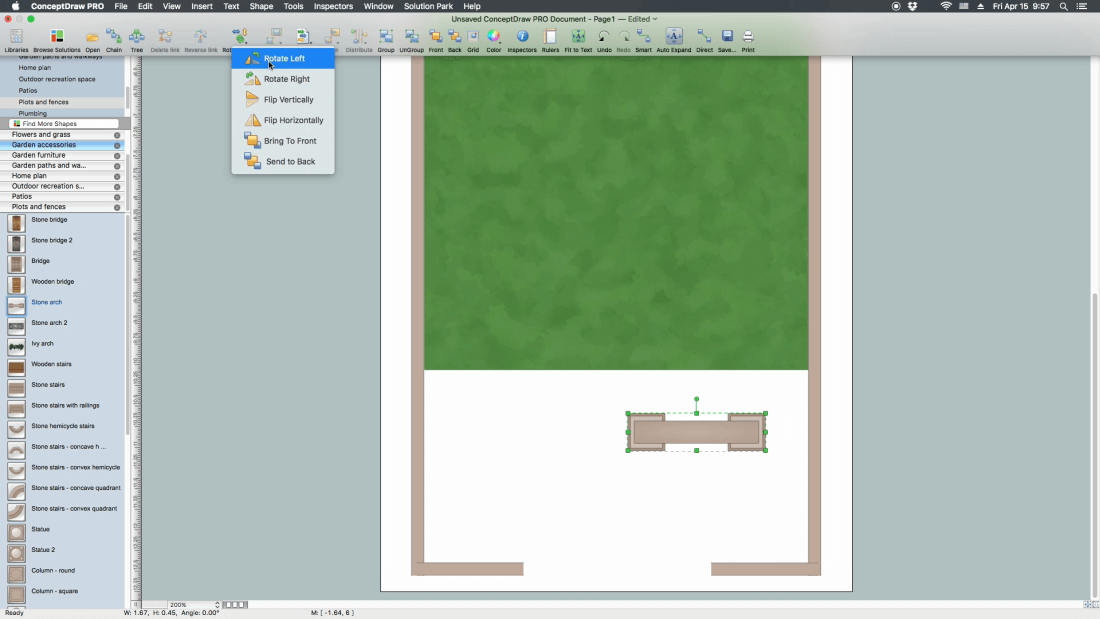
- Place Small column - square at fence angles.
Note: take first object from library and set its size, duplicate the rest with command+d
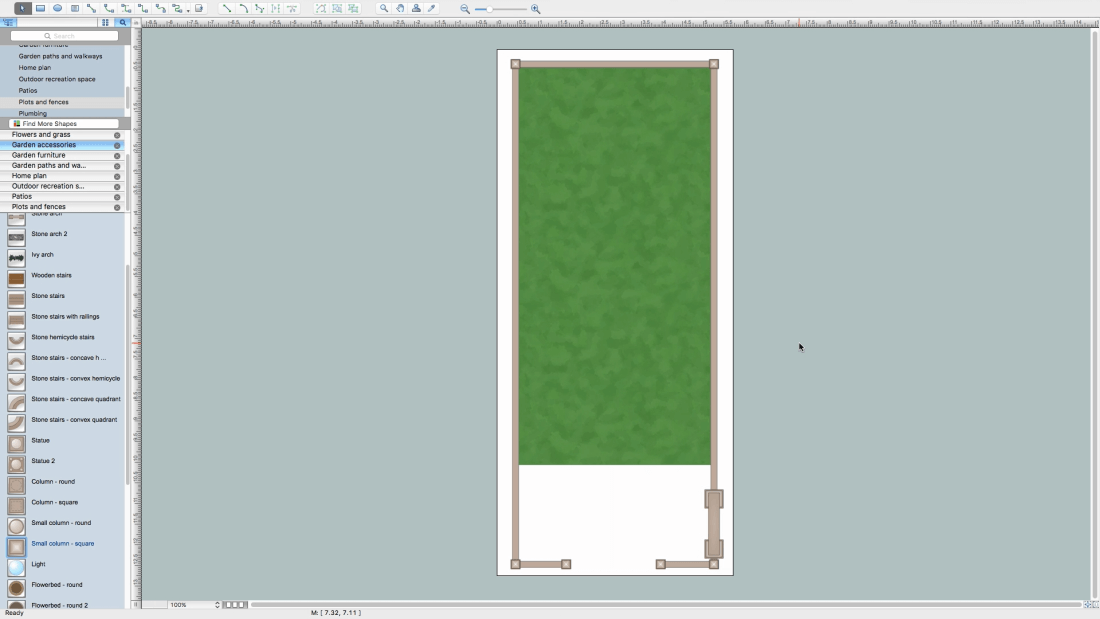
- Add Patio object - rectangular from Landscape & Garden-Patios library and Green grass 3 from Landscape & Garden-Flowers library.
- Base layer is ready, name it and lock from changes.
- Select another layer as working - blue marker.
Note: you may block only non-working layer.
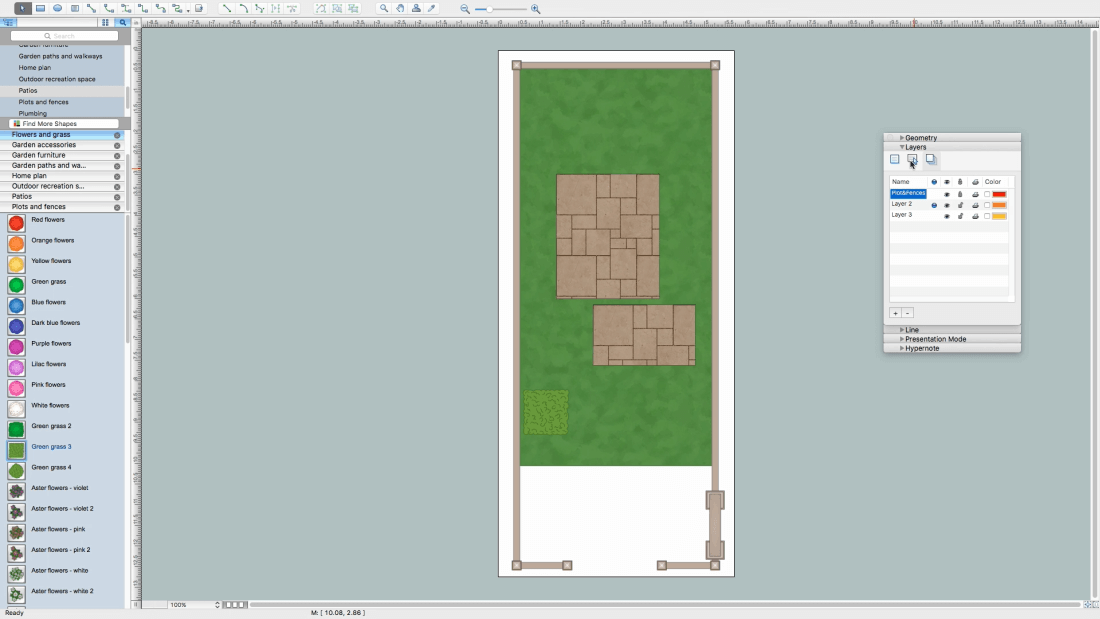
- Continue to draw objects on your site plan, use Patio - rectangular base from Landscape & Garden-Patios library.
- Change fill color if needed.
- Add patio - Gable roof - wooden.
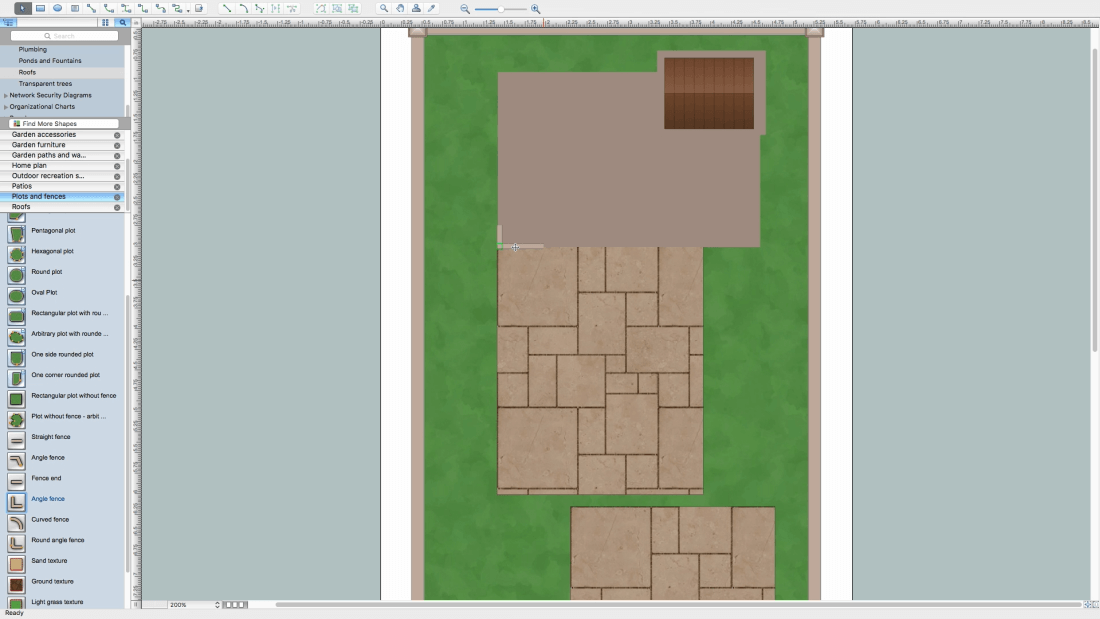
- Add some fences using Angle fence object.
- To extend sides, drag yellow control dots.
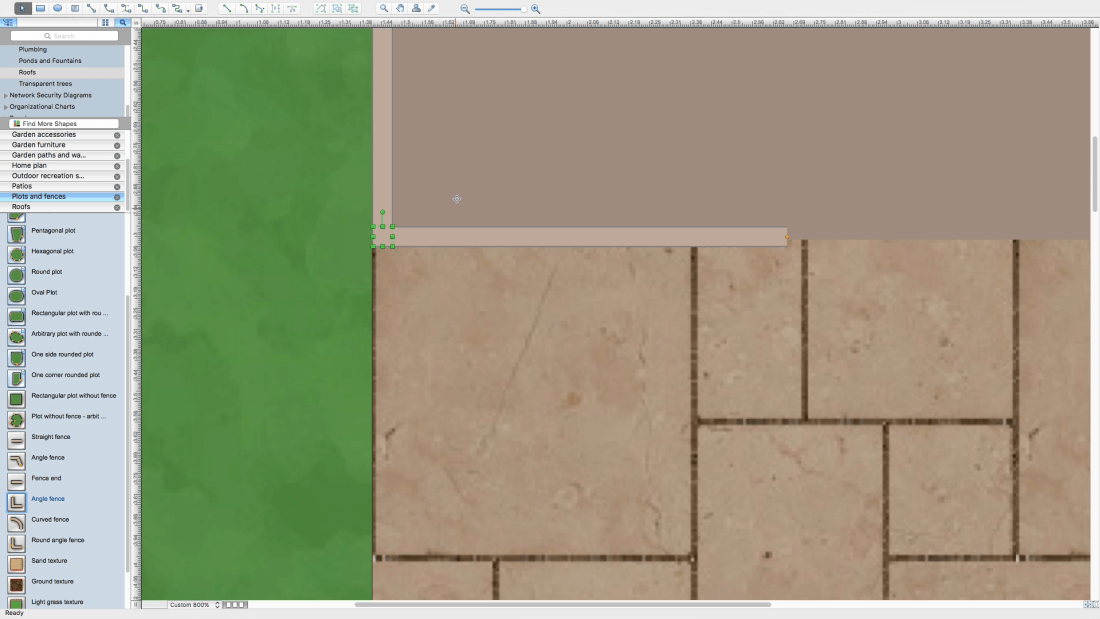
- Copy the first Angle fence, to make all further objects same size and color.
- Rotate some figures using buttons on a ribbon.
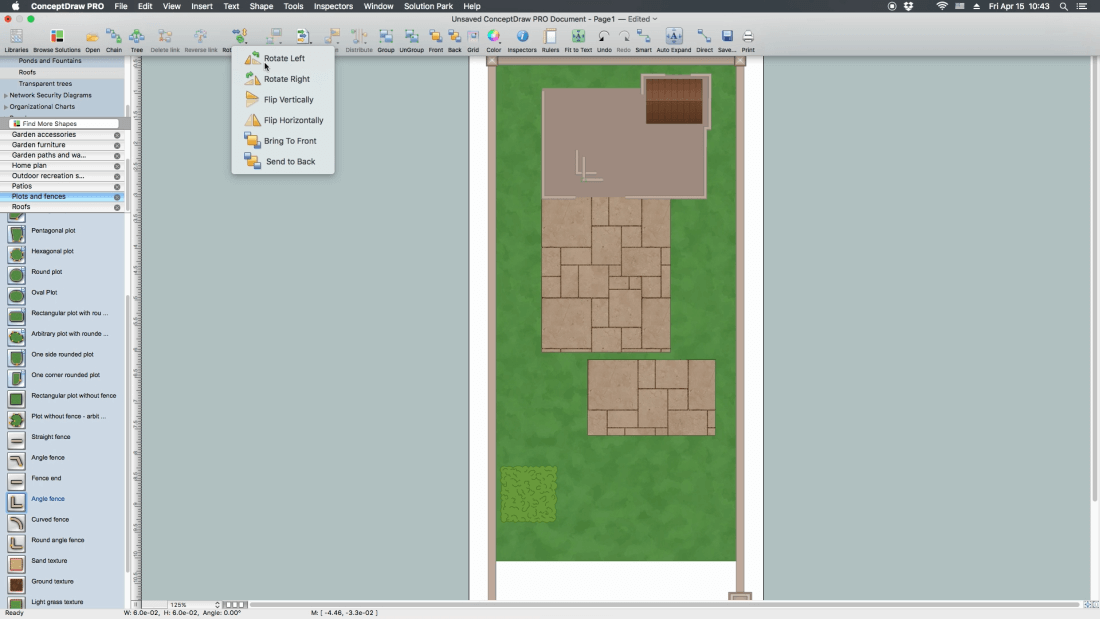
- Use keyboard arrows buttons to adjust an object more precisely.
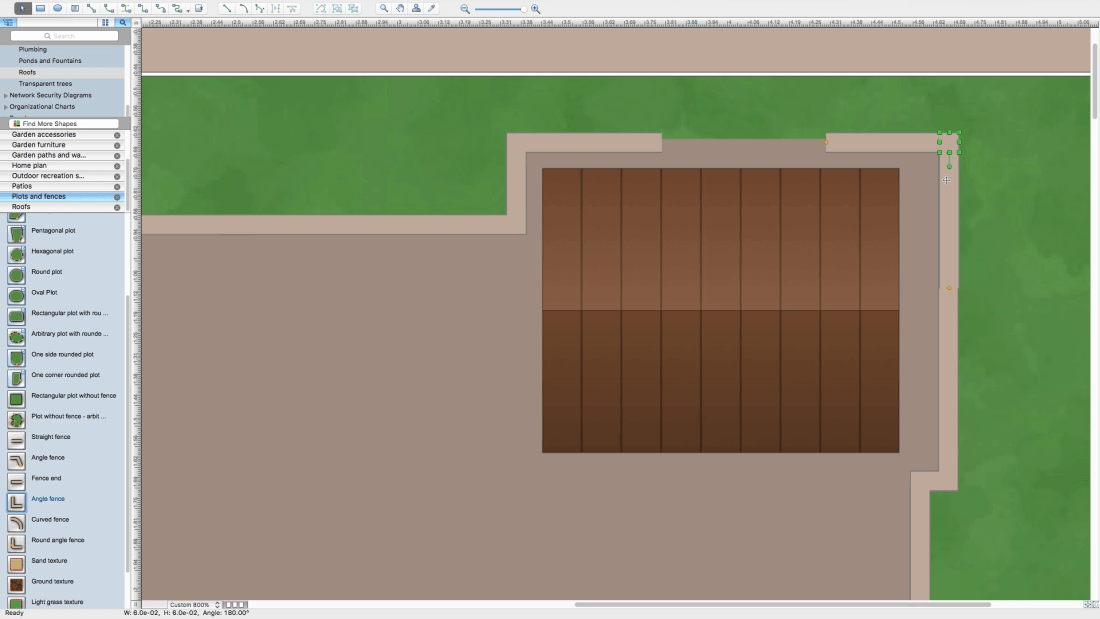
- Draw a house base using Patio - rectangular object, change the color and filling pattern.
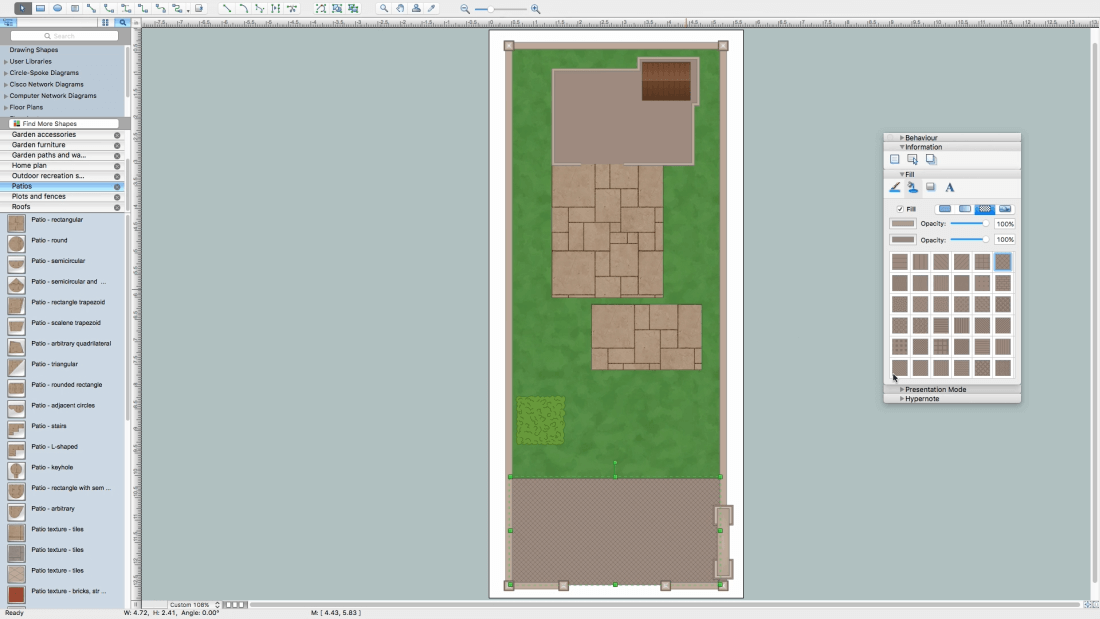
- Add Patio - L-shaped object.
- Set the needed size using yellow control dots.
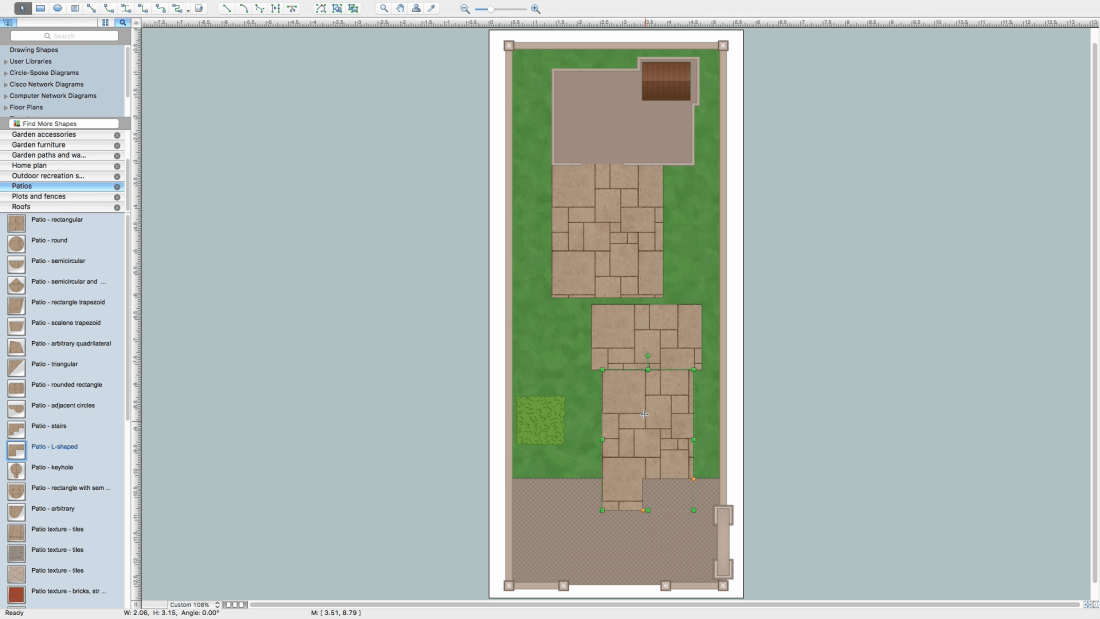
- Change the fill and color using Inspectors.
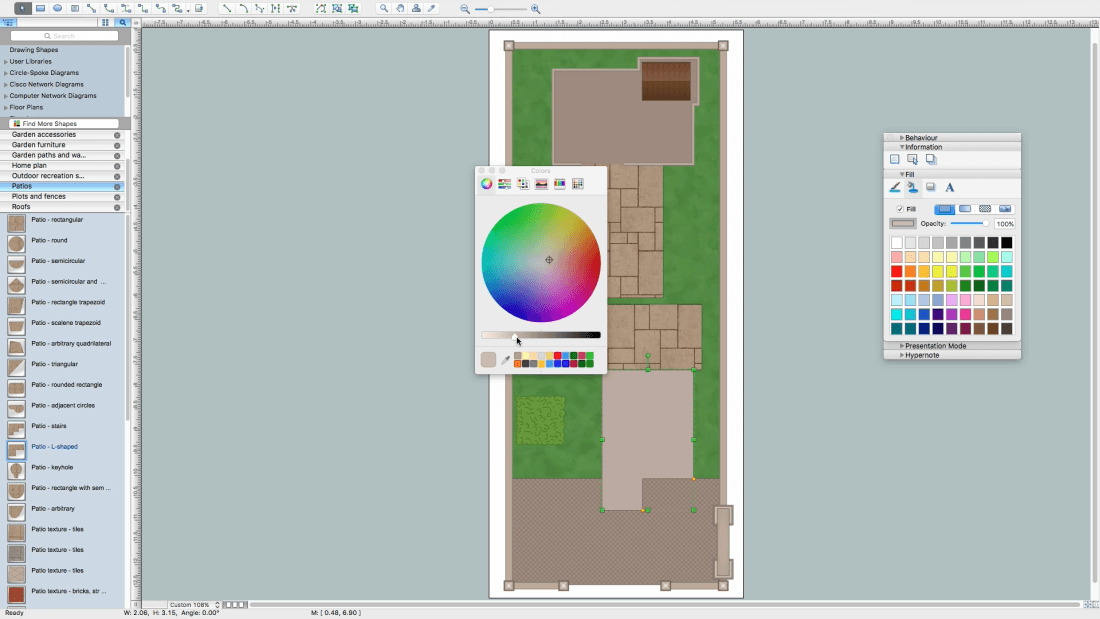
- Add Stone stairs, set the color and size.
- Duplicate and rotate to add another stairs level.
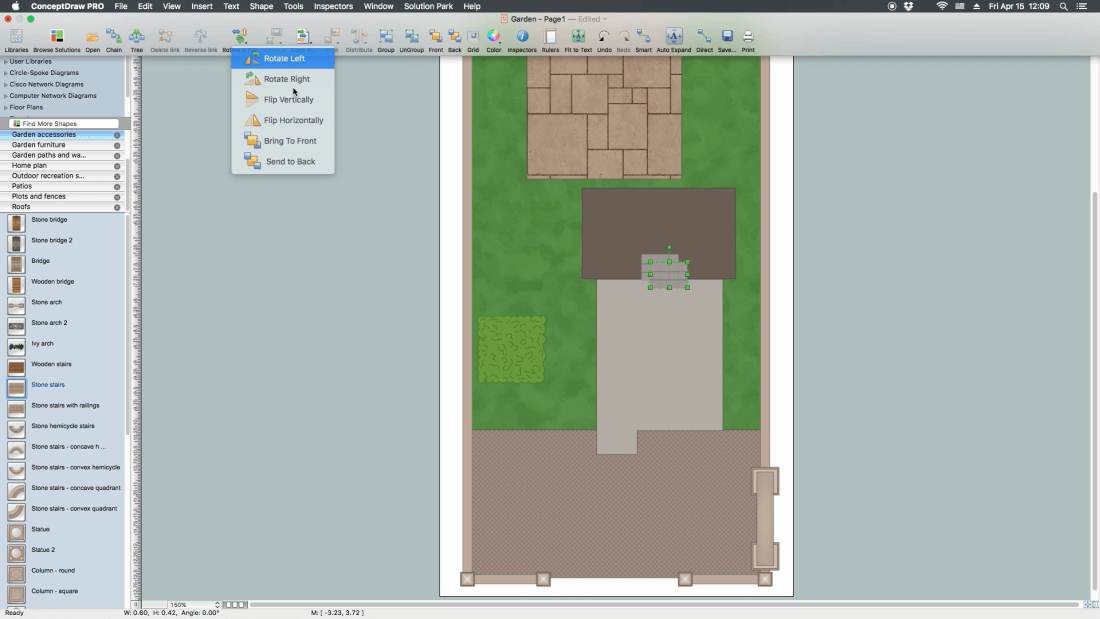
- Switch on Snapping to place figures more precisely regarding each other.
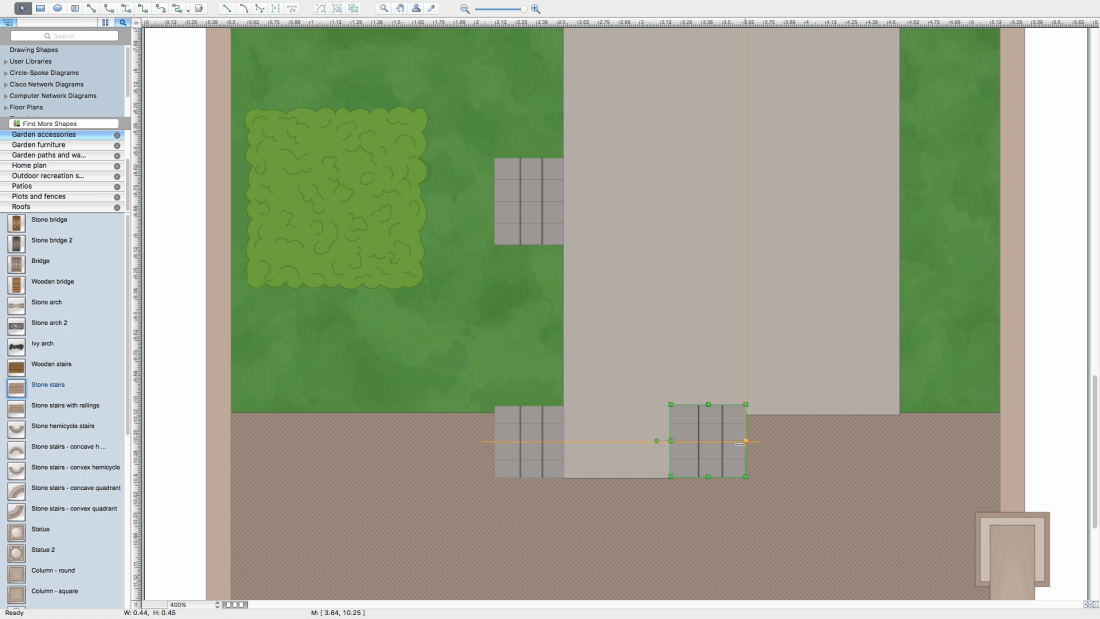
- Add Angle fence, drag yellow control dots to set dimensions.
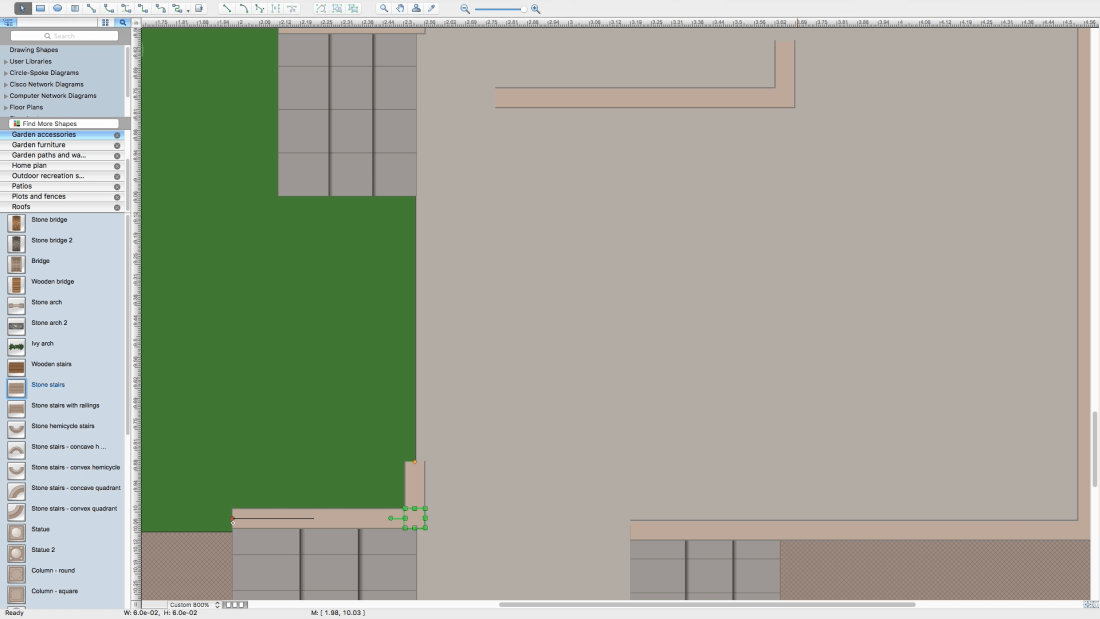
- Add house roof using Ridge - slate object, add road or path.
- Bring a roof to the front using buttons on ribbon to present it on a top of a house.
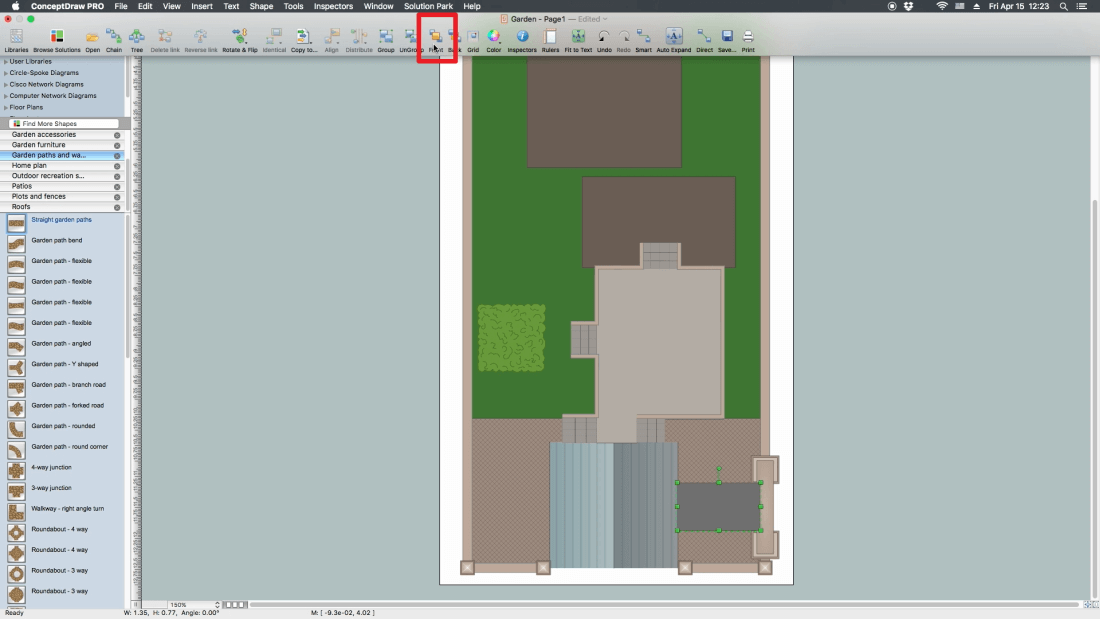
- Add Hip end - slate and Hip roof component - slate.
- Change fill color.
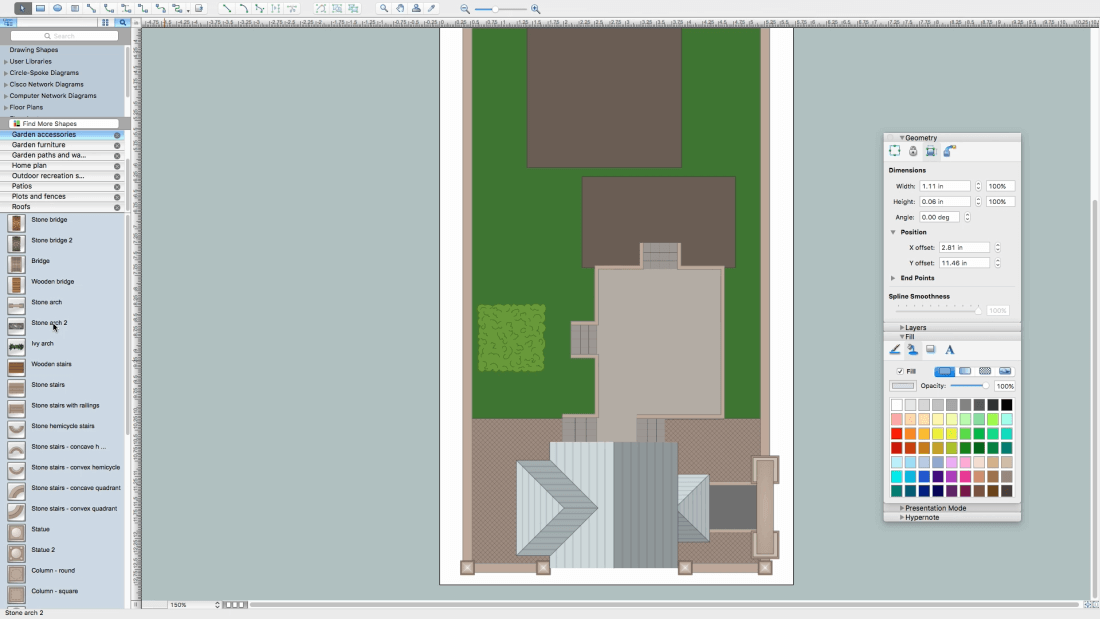
- Go to the next layer and begin to draw water parts.
- Add Round fountain object to the drawing.
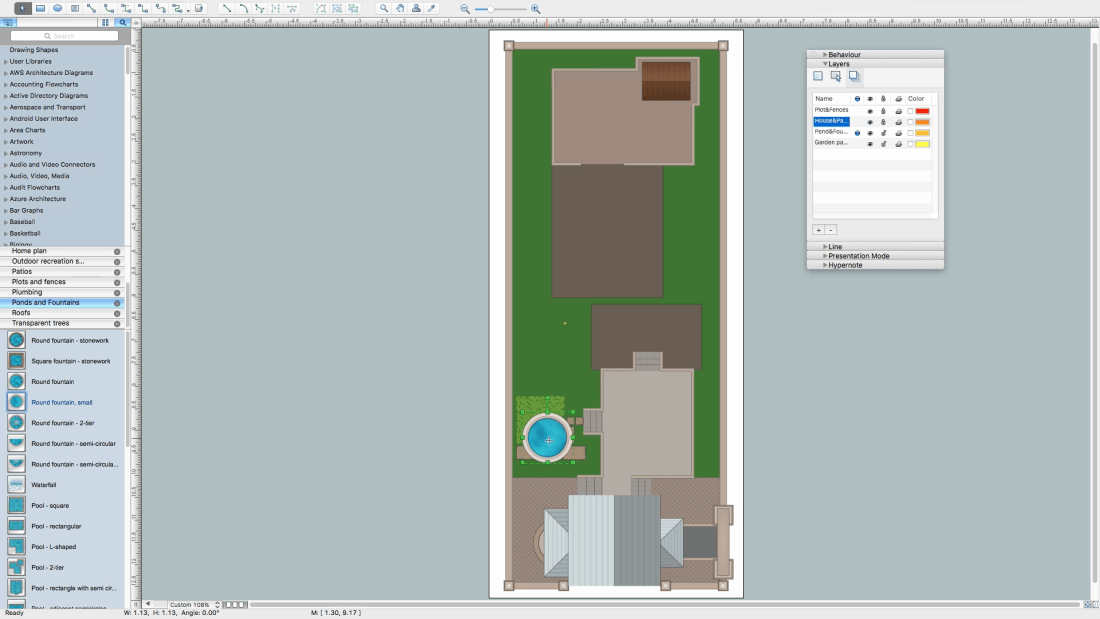
- Add pound using Pond - free-form object - adjust the size using control dots.
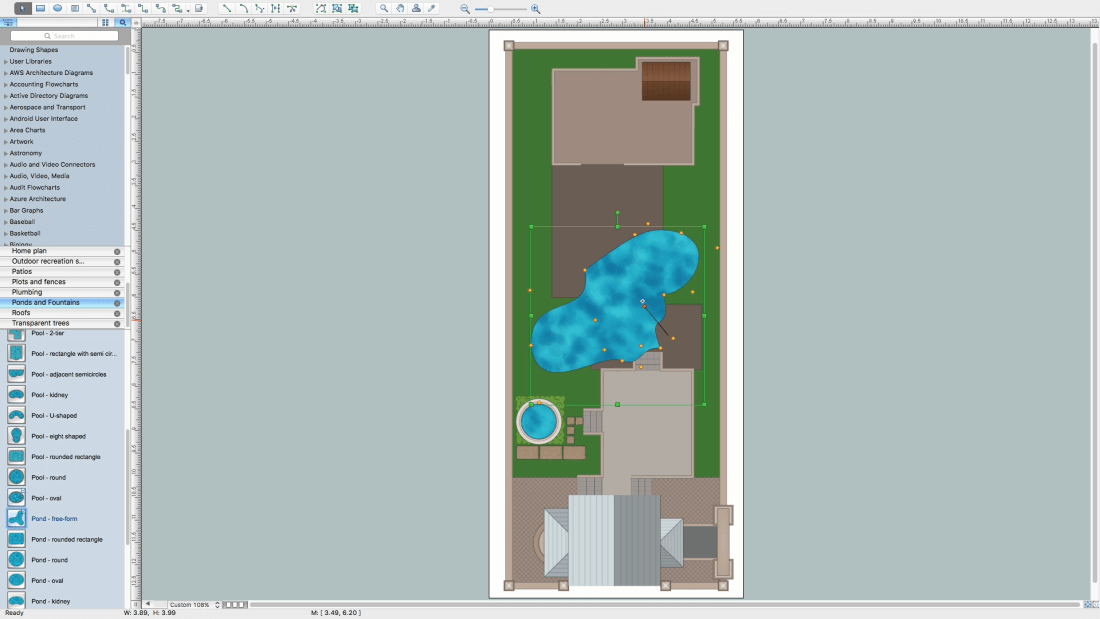
- Change color and filling.
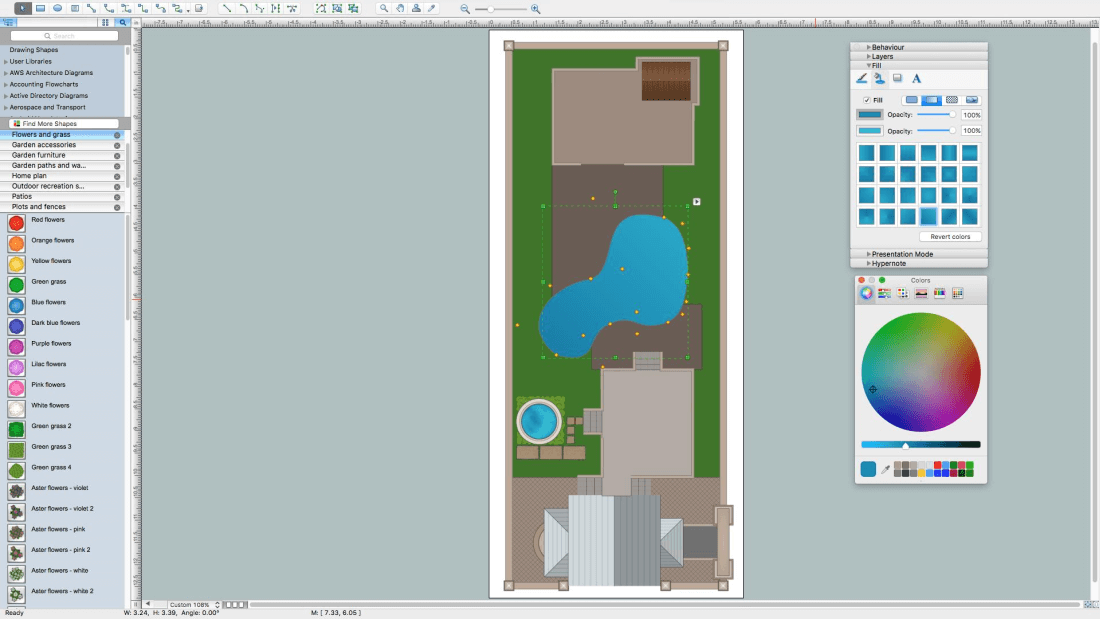
- Draw a coast line using Garden path stones, this object is a puzzle shaped.
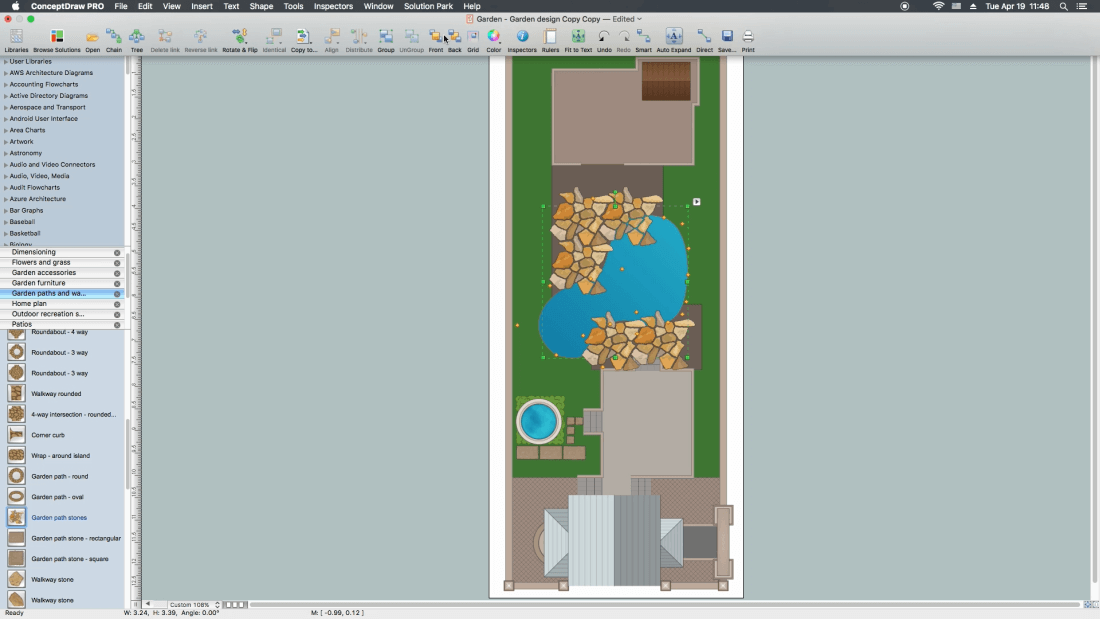
- Bring pond to the front above the coast.
- Add a bridge - Stone bridge 2 from Landscape & Garden accessories library.
- Color the bridge.
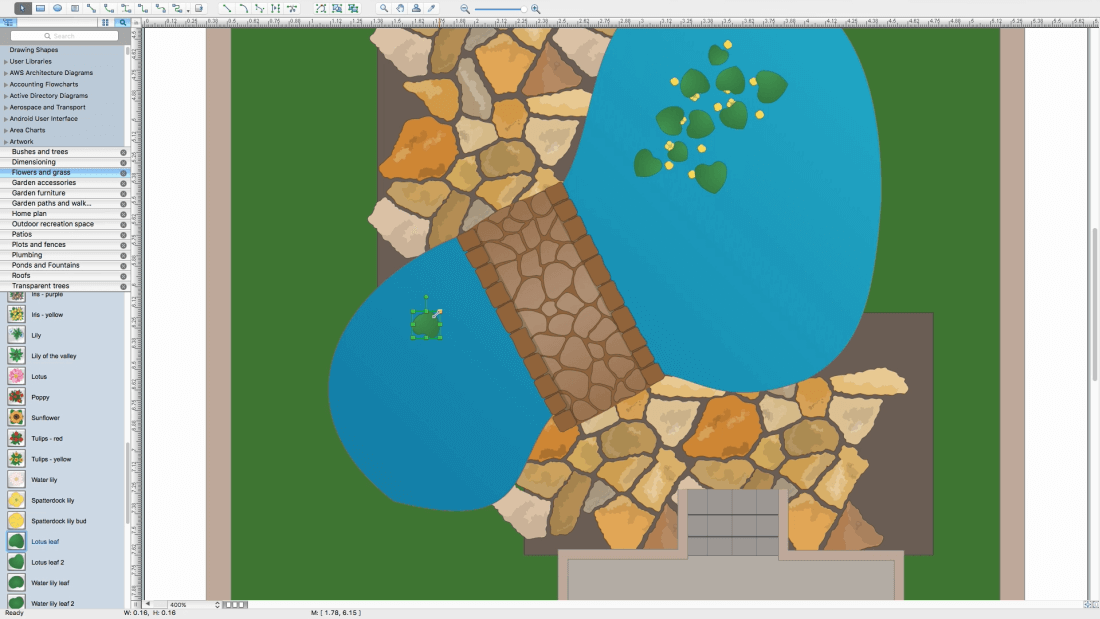
- Add some plants to a pond from Landscape & Garden-Flowers and grass.
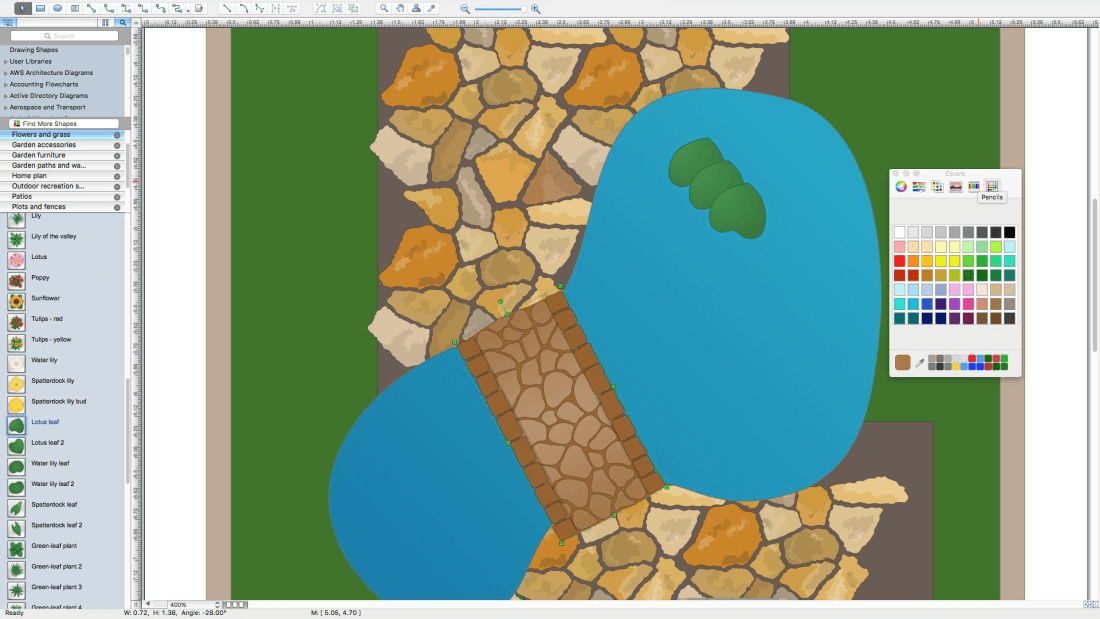
- Add more plants.
- Group objects Flowerbed - square 3 and Green grass 2,
- We will use this group in further.
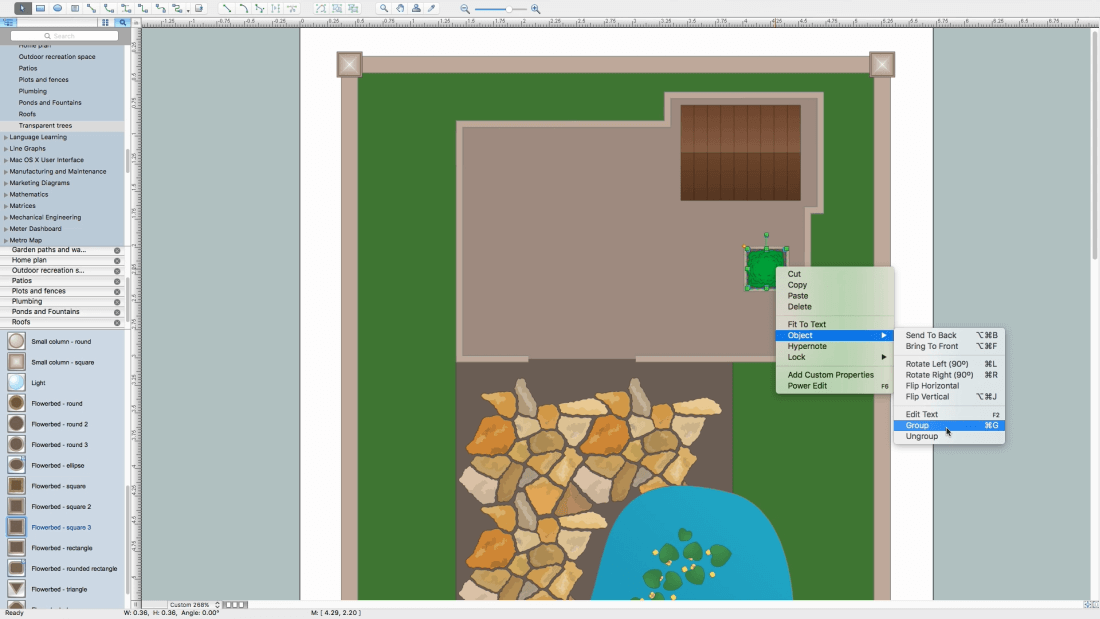
- Copy the group as many times as you need.
- Place them all in the area you need. Select them and align centres.
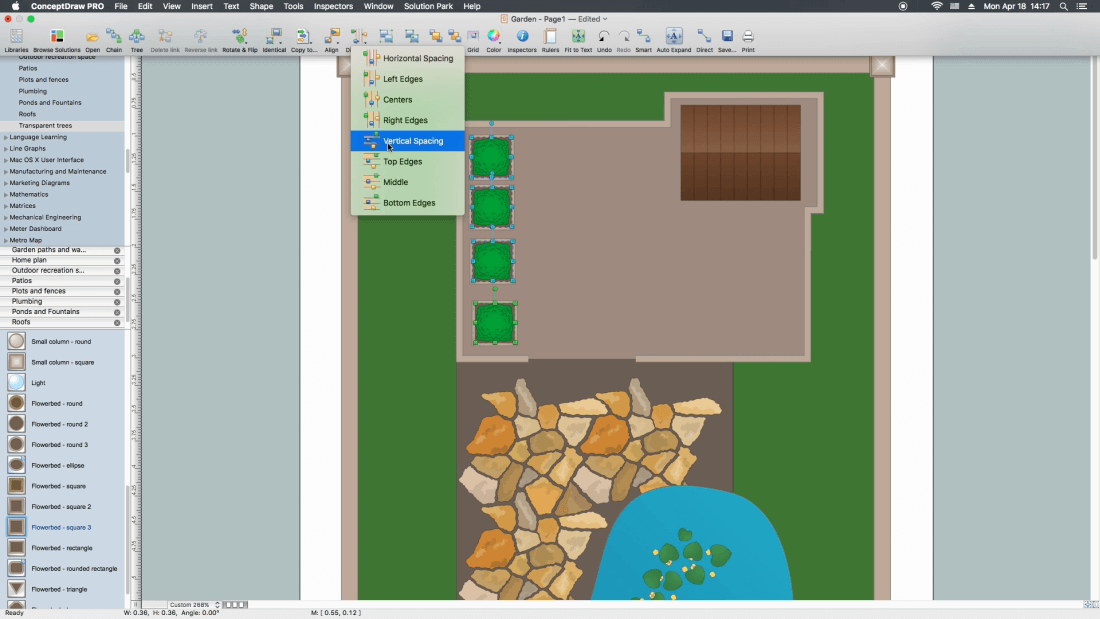
- Add more objects and Ivy arch to indicate the entrance.
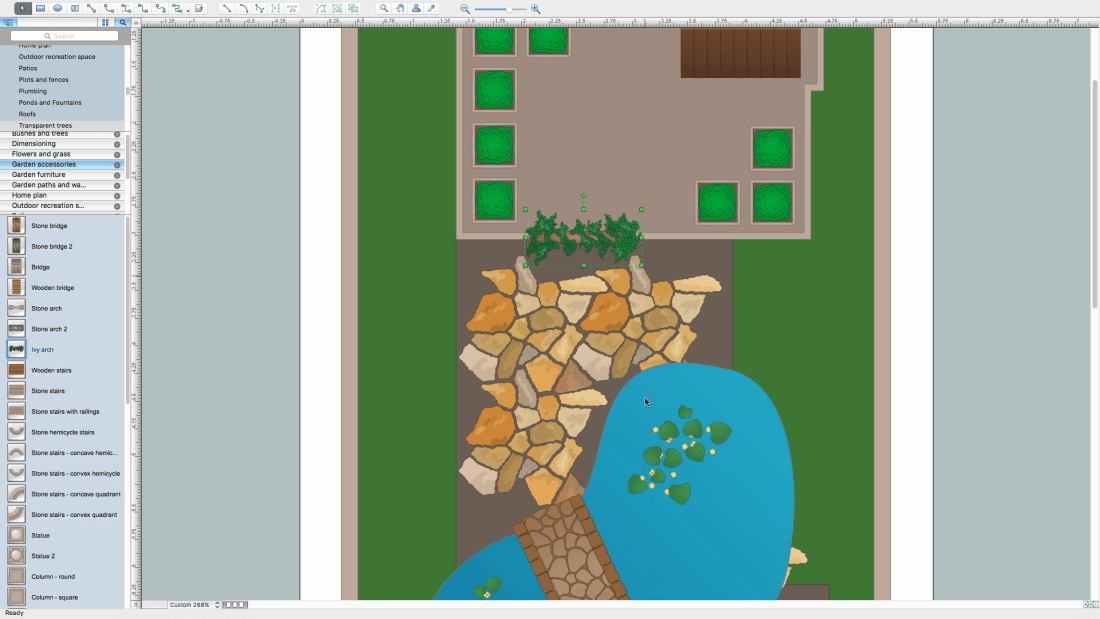
- Let's start planning a leisure zone near a pond.
- Add Patio table - rectangular object and place it around Outdoor arm chair with cushion.
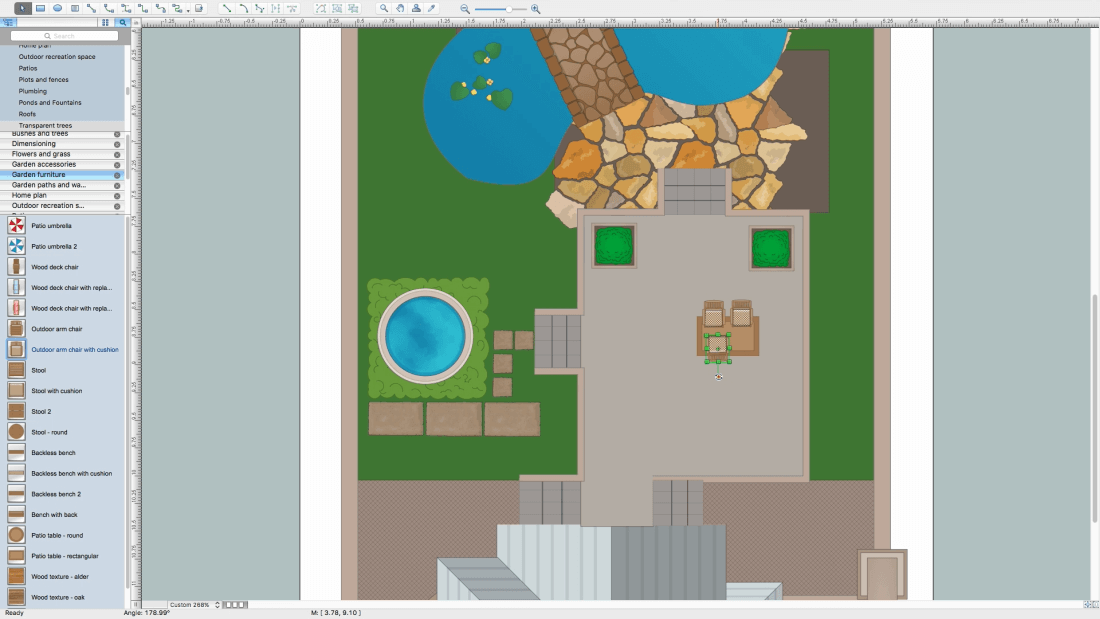
- Bring table to the front.
- Select objects.
- Group it using button on a ribbon.
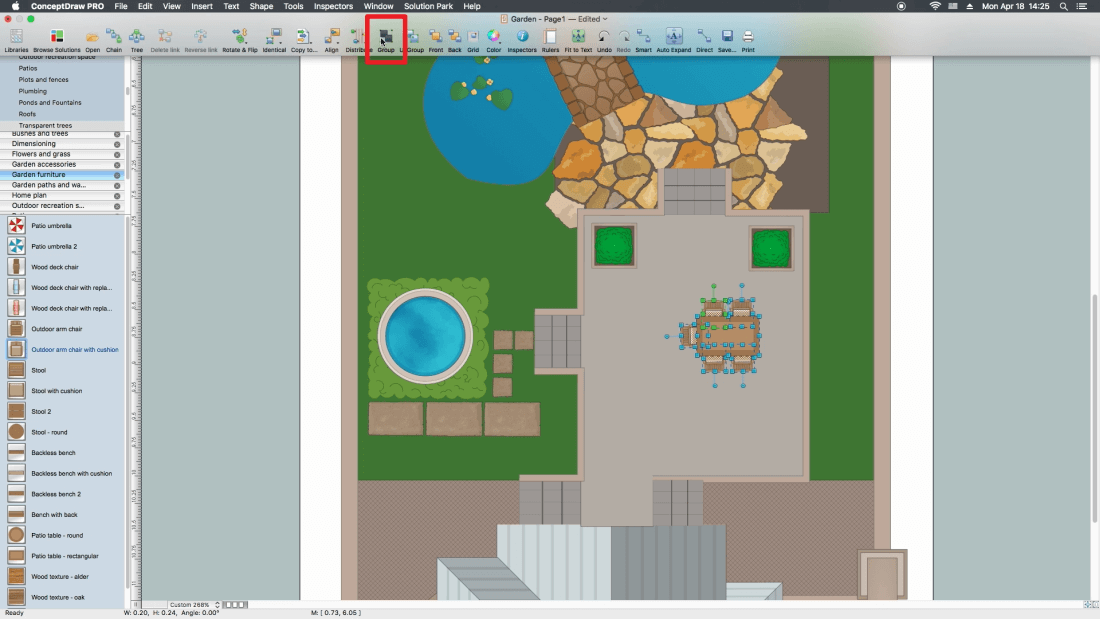
- Add outdoor lights to the leisure zone.
- Arrange flowerpots on the territory.
- Add benches.
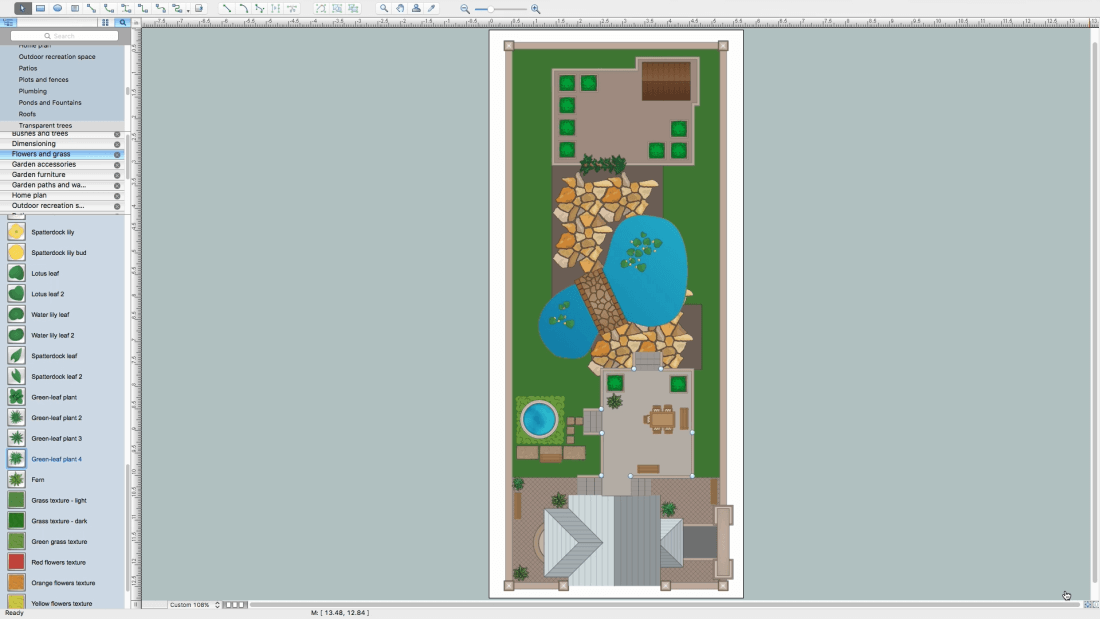
- Using Landscape & Garden-Bushes and trees library,
- Arrange plants around a pond.
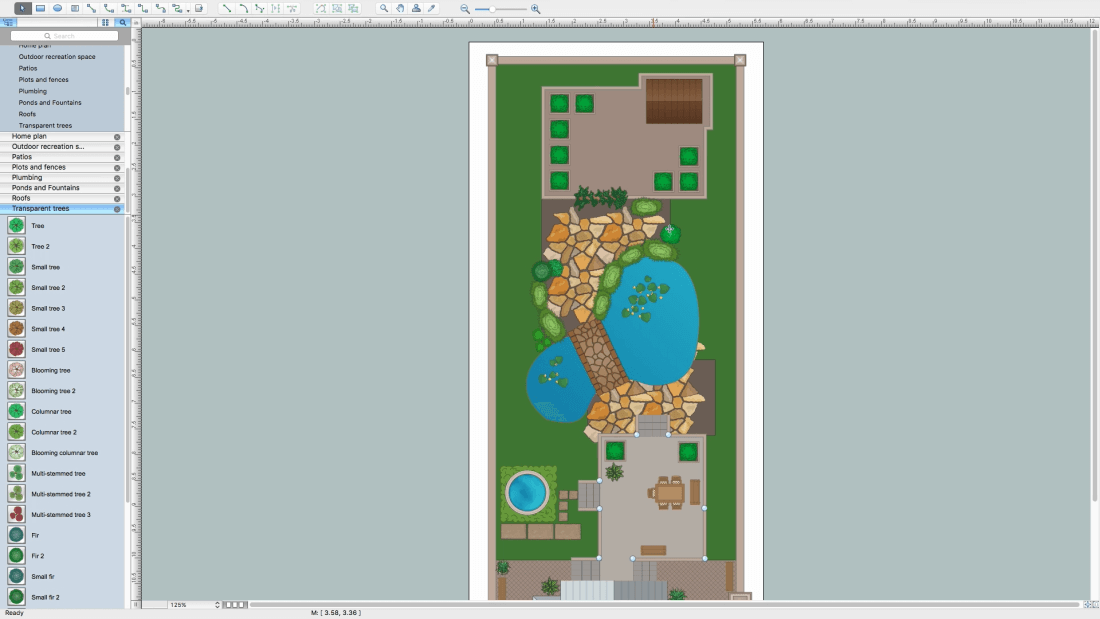
- Add more plants.
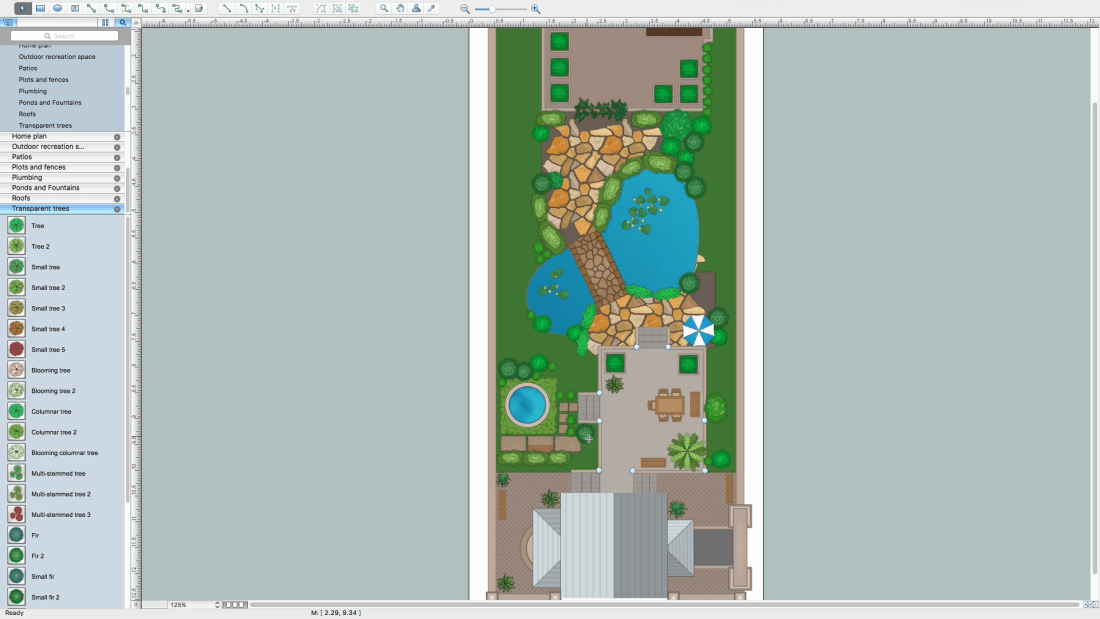
- Add some trees.
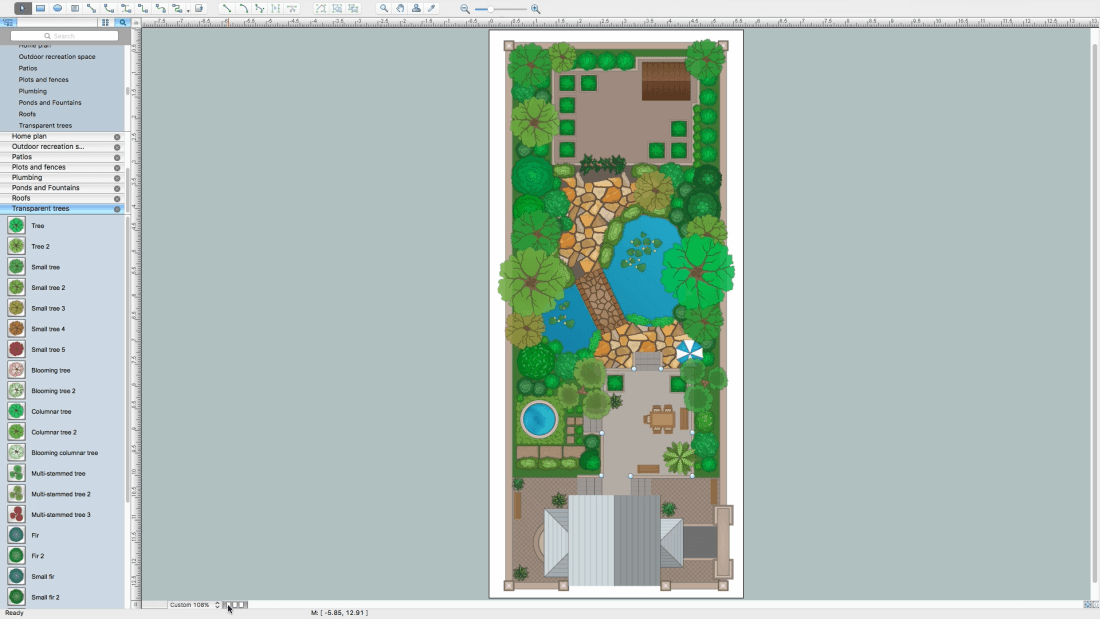
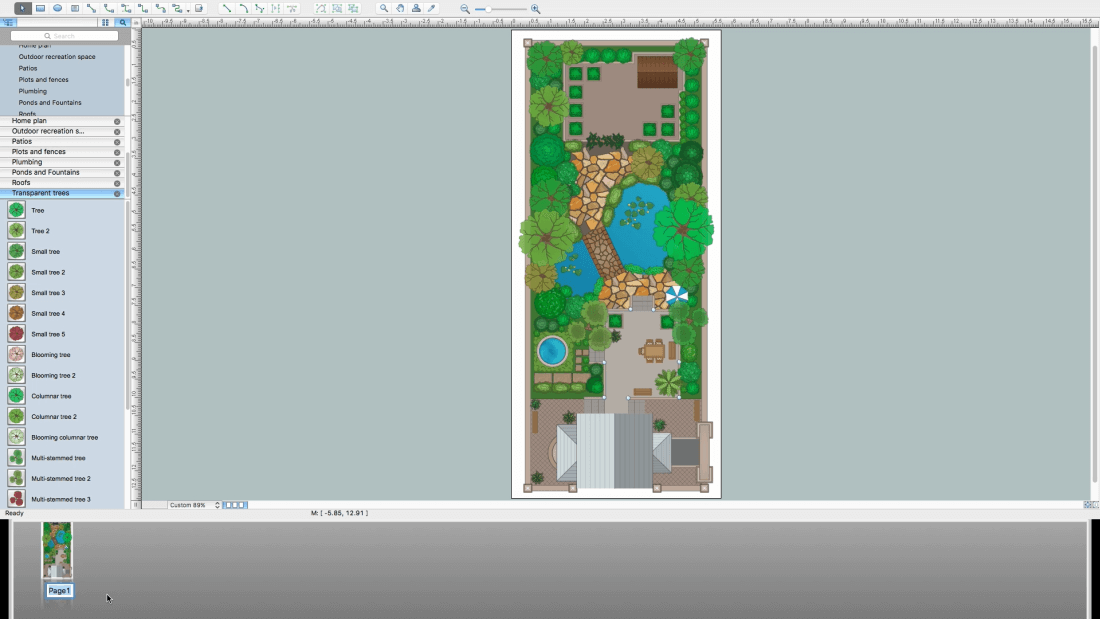
- Name the page and save the document.
- All exporting commands are available at ConceptDraw DIAGRAM from the File menu. You can immediately apply them when your drawing is ready.































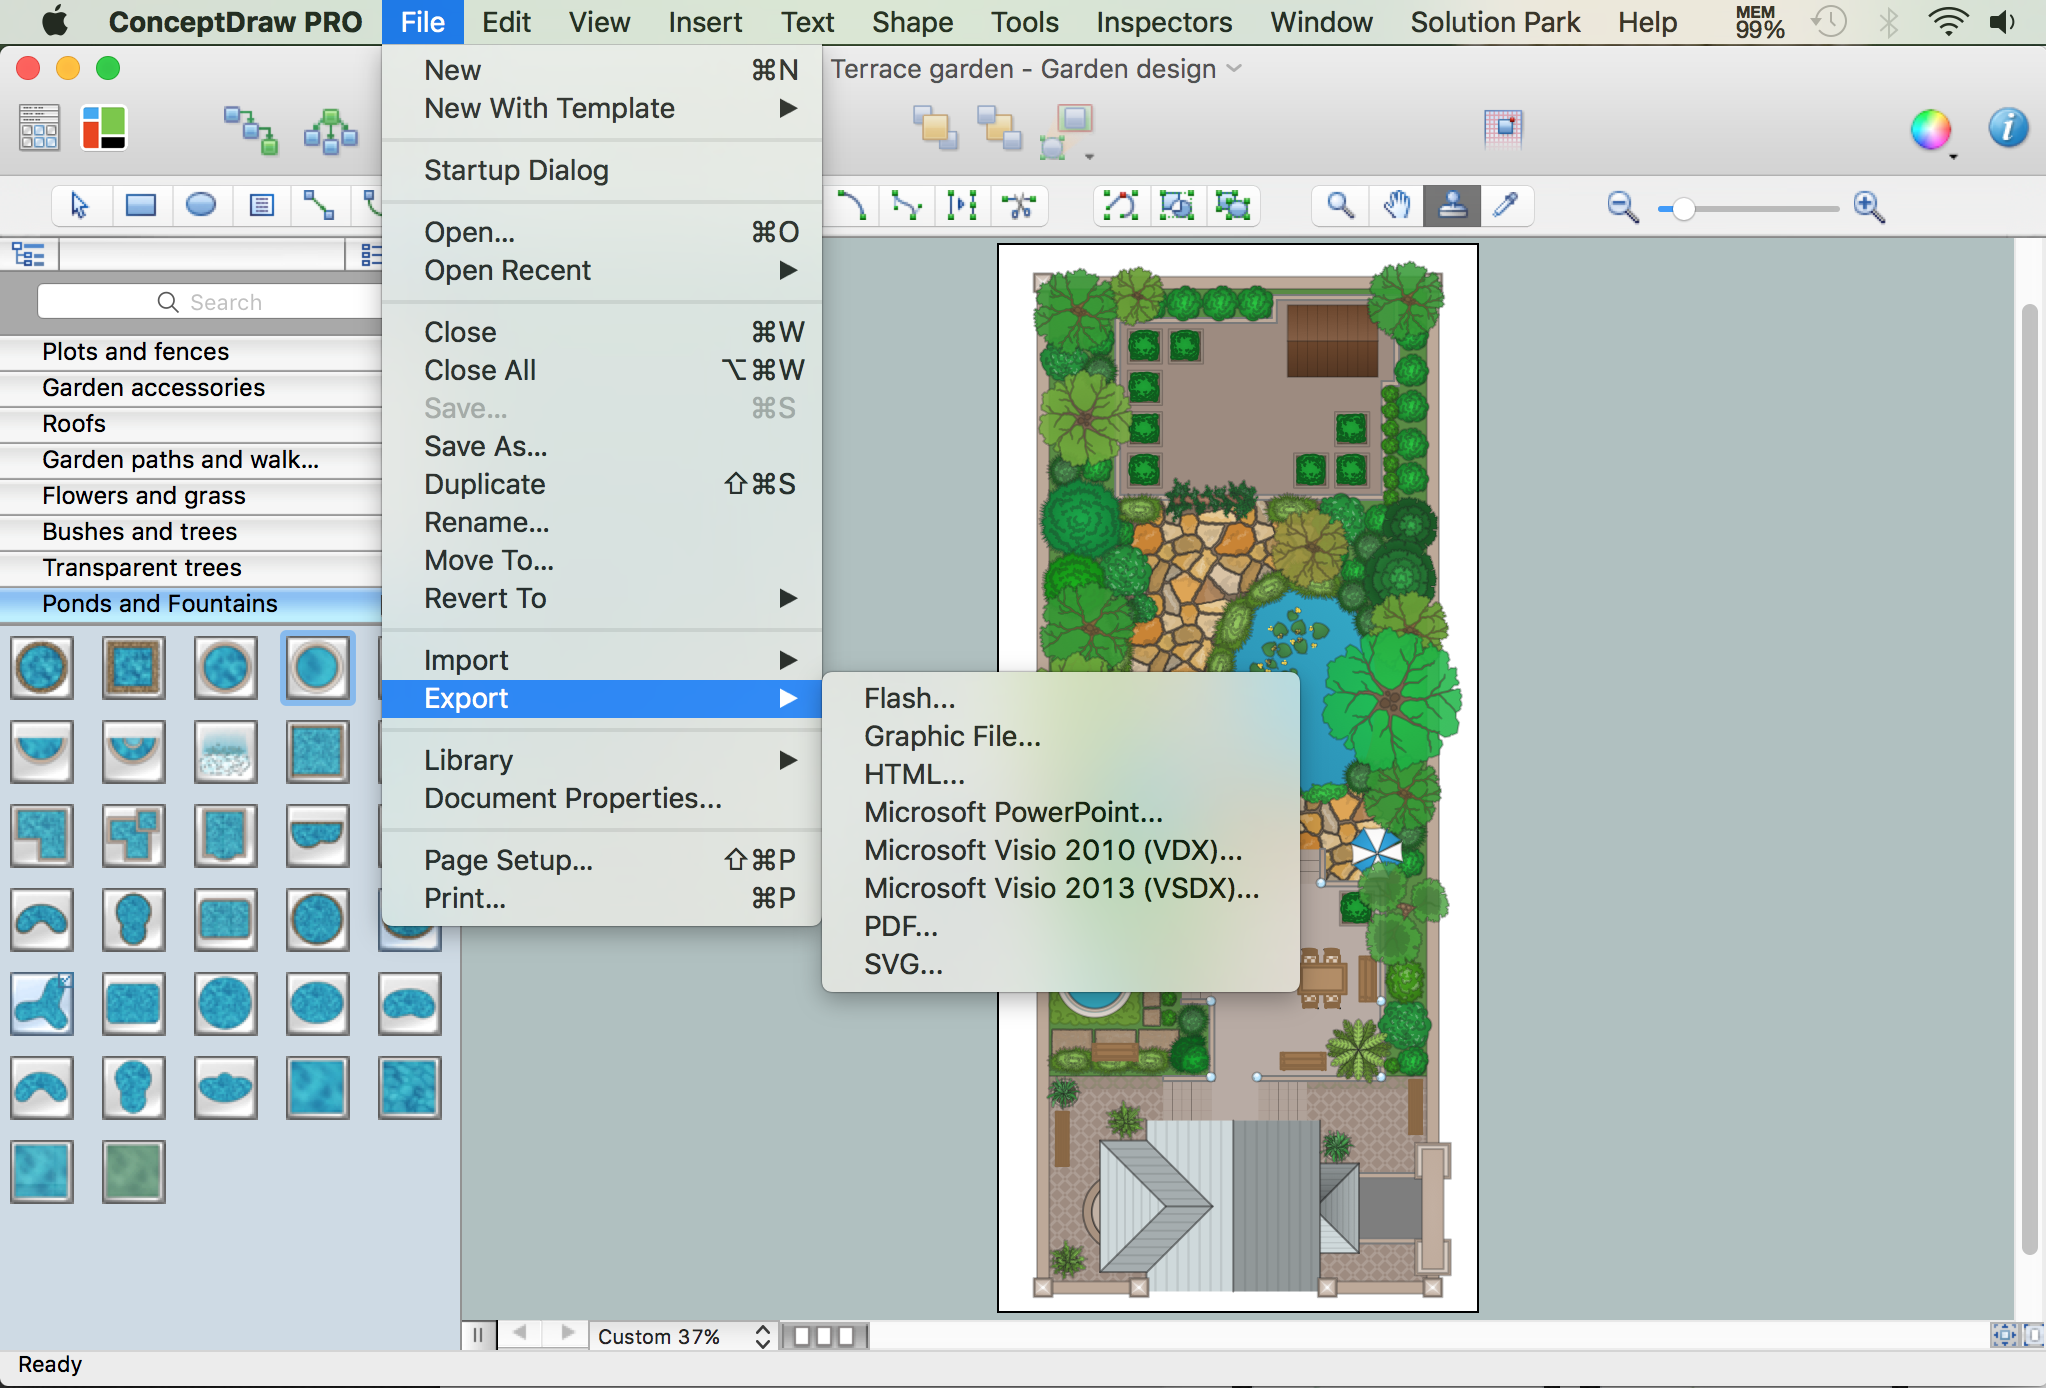
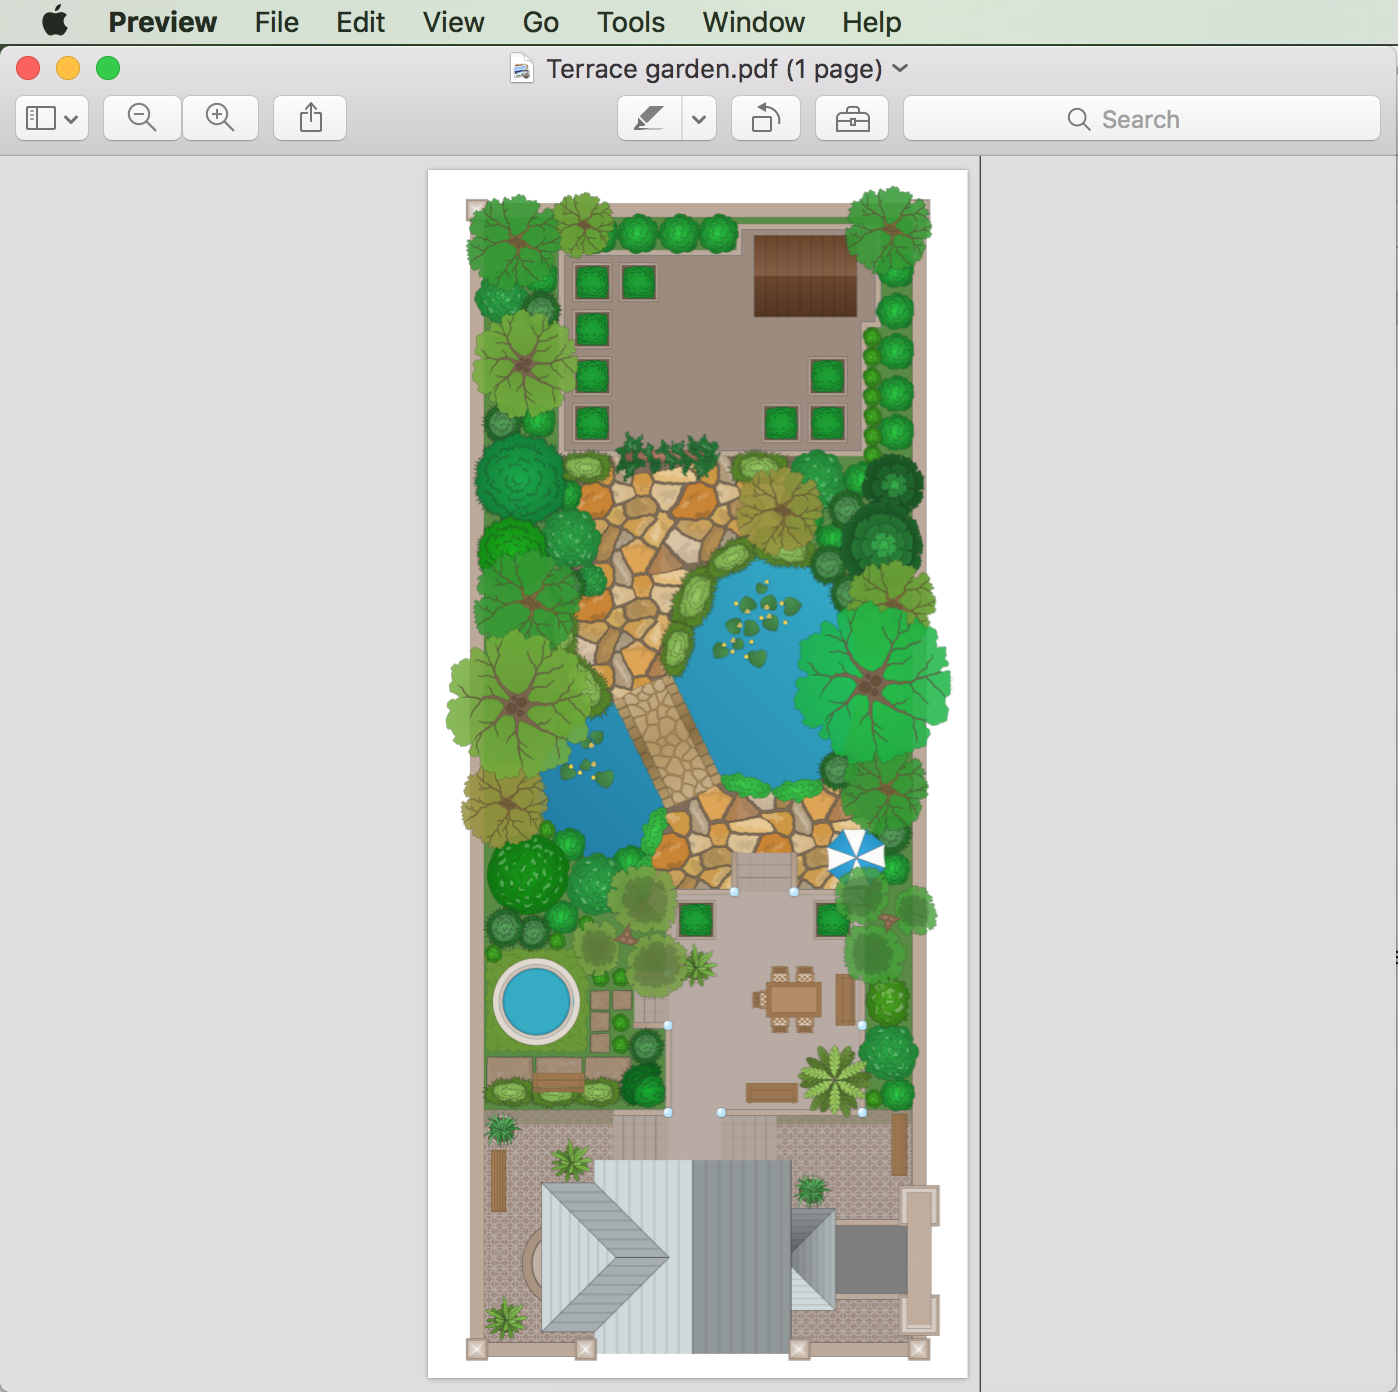
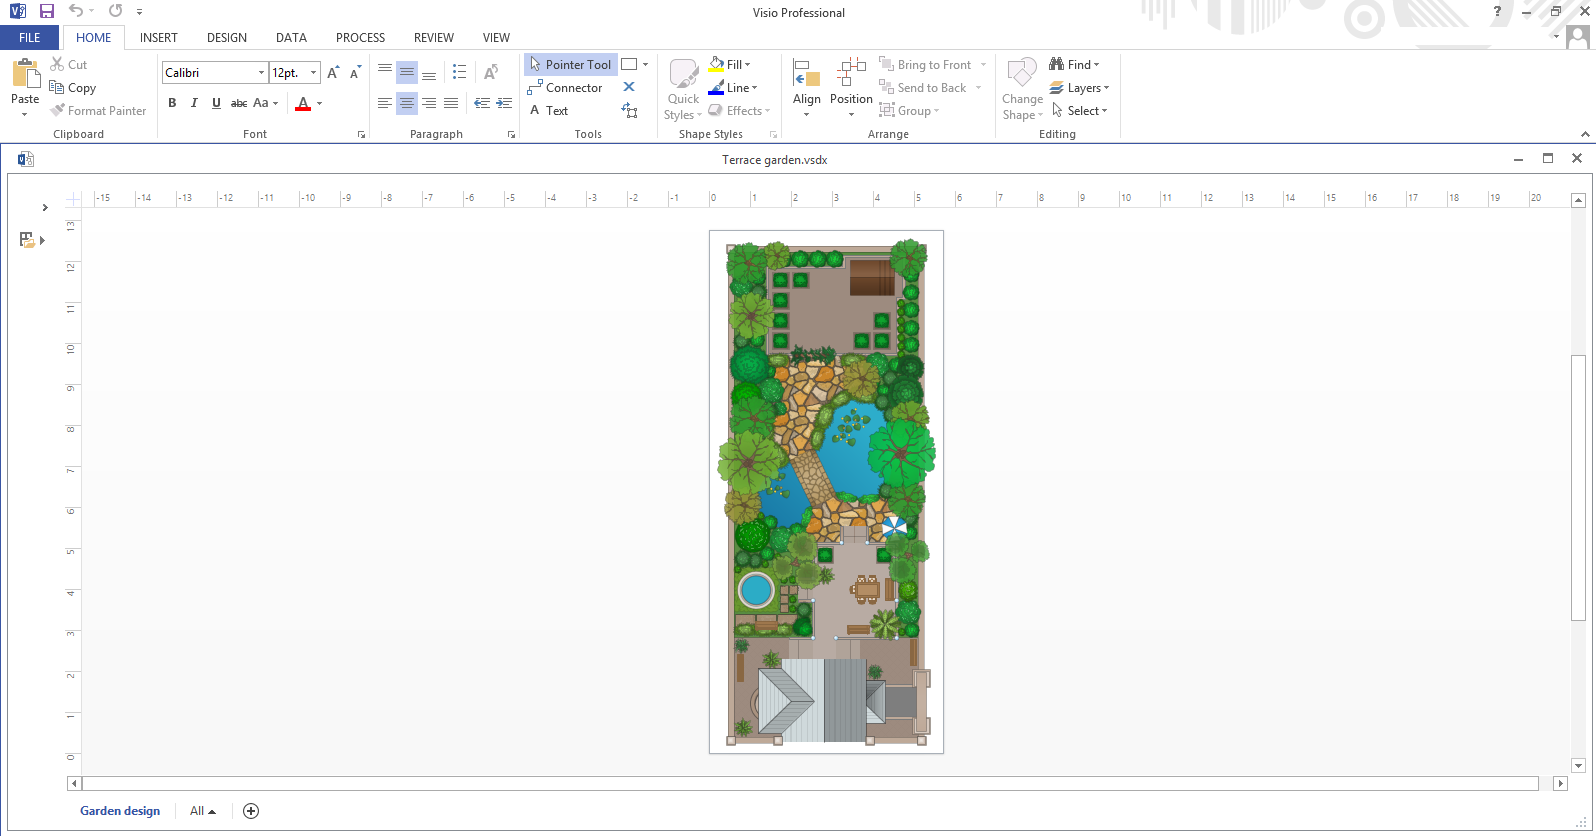
The possibility of exporting to variety of popular graphical formats (PNG, JPEG, JPG, GIF, TIF, TIFF, BMP, DIB, EMF, SVG) and file formats, such as Microsoft PowerPoint (PPT), Adobe Acrobat (PDF), Microsoft Visio (VDX, VSDX), Adobe Flash (SWF), Encapsulated PostScript (EPS), HTML, opens wide opportunities for you.
Video. How to Draw a Landscape Design Plan (2min 48sec)