Classroom Seating Chart Maker
ConceptDraw DIAGRAM extended with School and Training Plans Solution from the Building Plans Area is a powerful Classroom Seating Chart Maker.

Example 1. Classroom Seating Chart Maker
School and Training Plans Solution provides extensive drawing tools, School Layout Library with numerous ready-to-use design elements and set of samples which will help you create your own professional looking classroom seating charts and school floor plans in minutes.

Example 2. Classroom Floor Plan
The following features make ConceptDraw DIAGRAM the best Classroom Seating Chart Maker software:
- You don't need to be an artist to draw professional looking diagrams in a few minutes.
- Large quantity of ready-to-use vector objects makes your drawing charts quick and easy.
- Great number of predesigned templates and samples give you the good start for your own diagrams.
- ConceptDraw DIAGRAM provides you the possibility to use the grid, rules and guides. You can easily rotate, group, align, arrange the objects, use different fonts and colors to make your diagram exceptionally looking.
- All ConceptDraw DIAGRAM documents are vector graphic files and are available for reviewing, modifying, and converting to a variety of formats: image, HTML, PDF file, MS PowerPoint Presentation, Adobe Flash, MS Visio.
- Using ConceptDraw STORE you can navigate through ConceptDraw Solution Park, managing downloads and updates. You can access libraries, templates and samples directly from the ConceptDraw STORE.
- If you have any questions, our free of charge support is always ready to come to your aid.
Read more about Home and Landscape design
- Building Plans Software
- Cafe Floor Plan Example
- Room planning
- Bubble diagrams in landscape design
- Wiring (electrical) diagram
TEN RELATED HOW TO's:
Working with personnel might be difficult if you are not prepared enough. To explain your workers all the details of communication with customers, you can draw an order process flowchart which will describe every step of the process and answer all the questions that might appear. You can view a lot of business process mapping diagram examples here, in ConceptDraw Solution Park.
This business process flow chart is created to illustrate the sample work order process. Before an organization can make some work for a person, the customer work order request must be completed. It is needed for tracking and accountability objectives. We used this business process flowchart to show a certain tasks and actions assumed by an organization. This flowchart depicts the outside inputs that are needed to launch a process, and ways the organization delivers its outputs. This business process flowchart was created with a help of ConceptDraw Business Process Mapping solution.
Picture: Work Order Process Flowchart. Business Process Mapping Examples
Related Solution:
ConceptDraw DIAGRAM diagramming and vector drawing software extended with Site Plans Solution from the Building Plans Area of ConceptDraw Solution Park is a powerful Site Plan Software.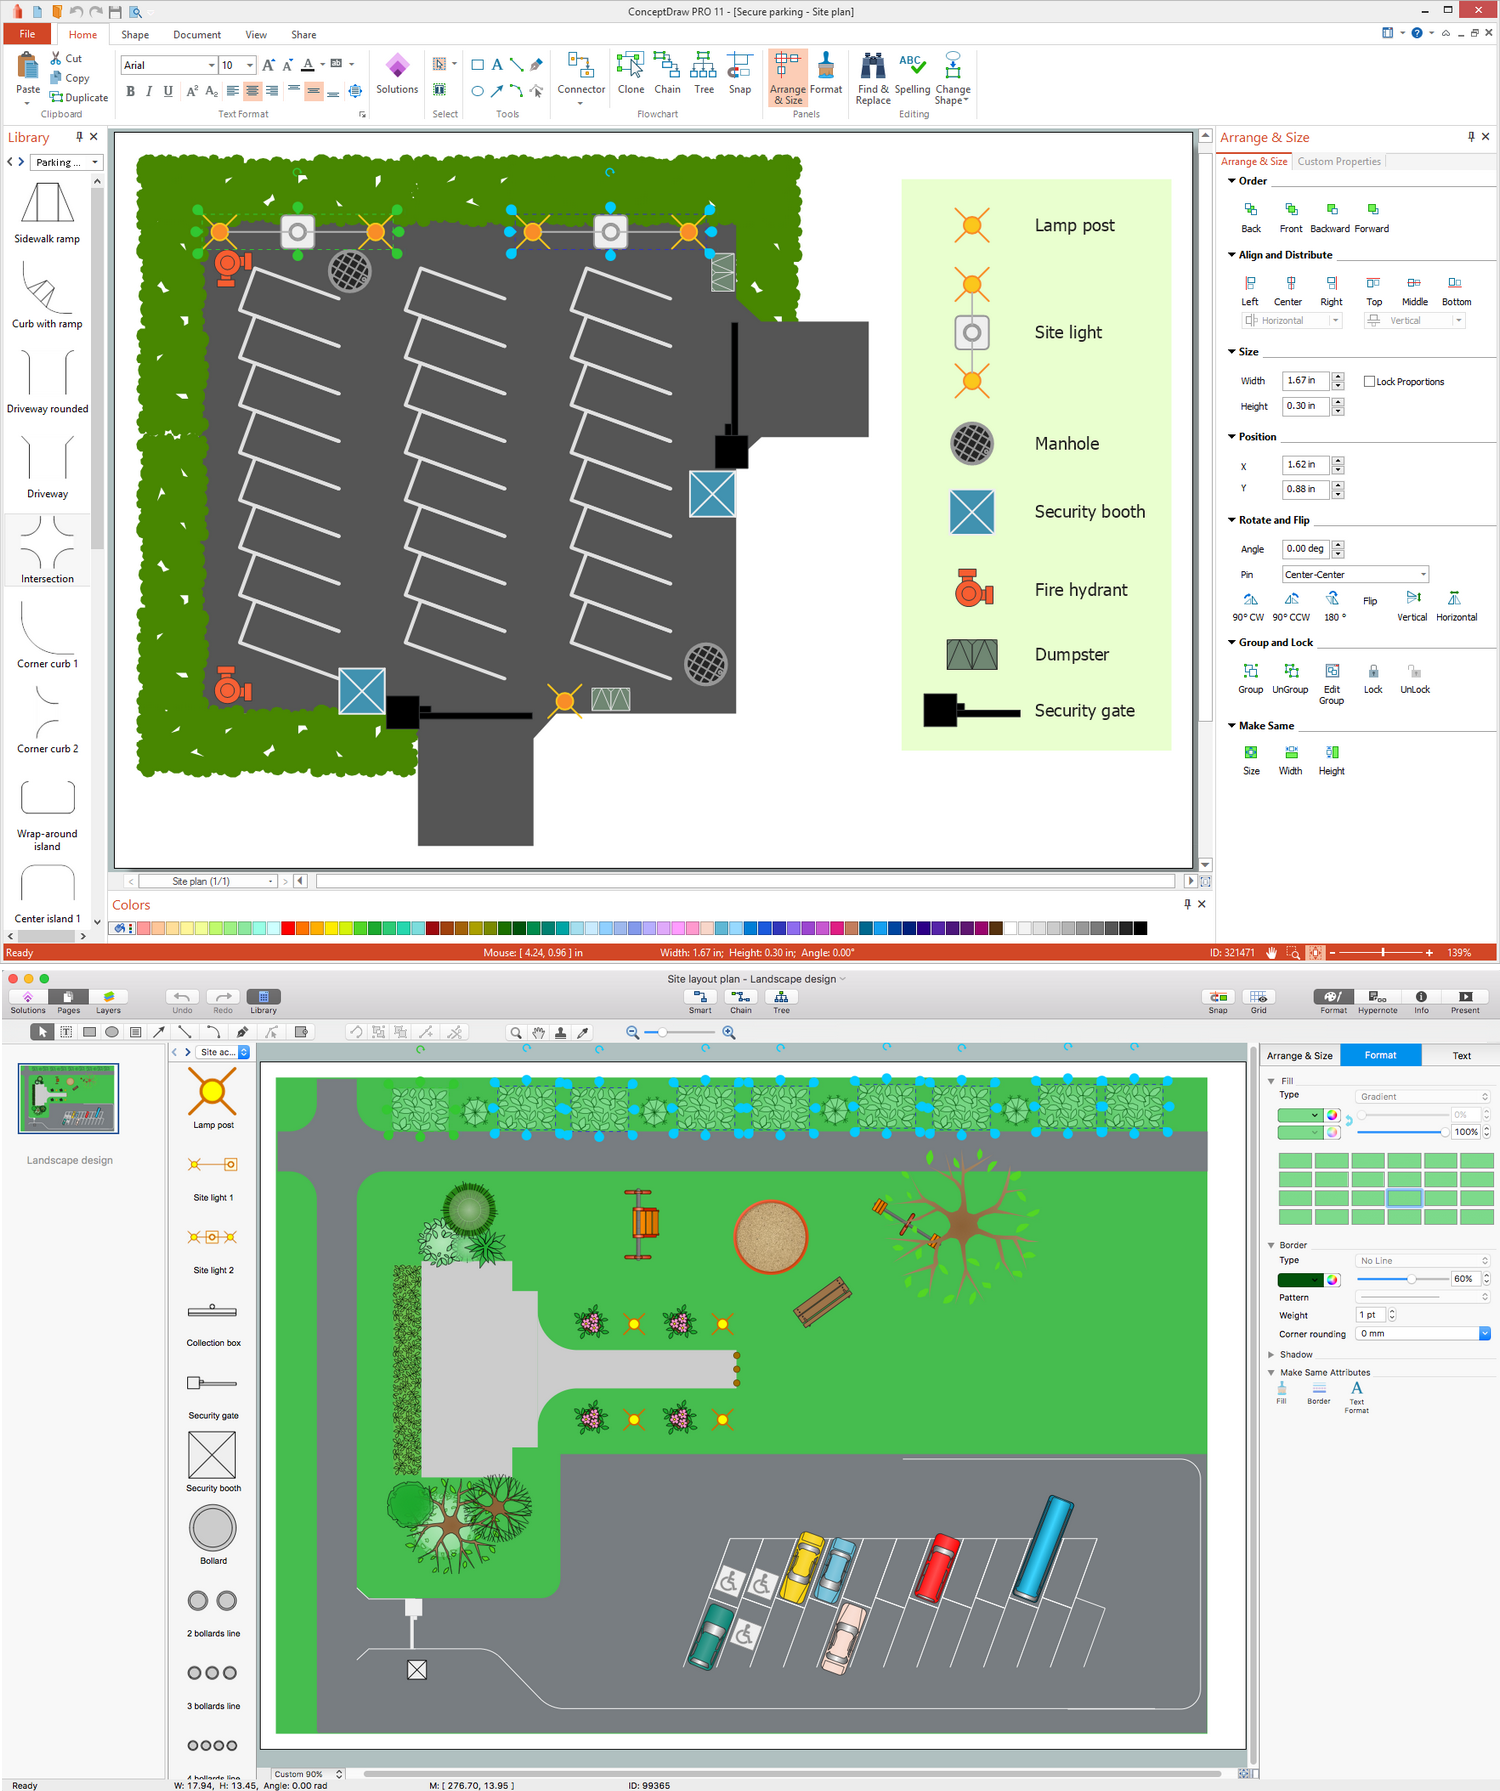
Picture: Site Plan Software
Related Solution:
When deciding to start your own business, you have to take into account a bunch of different aspects. One of the ways to get inspired is to look through various restaurant floor plans samples or interior photos of already known establishments. This will help you, but keep in mind that a really unforgettable establishment must be unique.
This restaurant floor plan diagram was designed using ConceptDraw Cafe and Restaurant Floor Plan solution. It can be used as a sample while considering a custom restaurant design. With the help of this example you can estimate the amount of furniture best for a dining room or kitchen of the restaurant. In addition, this plan would be useful as a check list when you will consider a list of the furniture and equipment needed for all areas of the future restaurant.
Picture: Restaurant Floor Plans Samples
Related Solution:
Matrix organizational structure is one of the main forms of structures which is actively used by organizations to carry forth the functions of a company visually and effectively.
Now we have ConceptDraw DIAGRAM diagramming and vector drawing software extended with 25 Typical Orgcharts solution from the Management area of ConceptDraw Solution Park which will help easy represent matrix organizational structure of any degree of complexity.
Picture: Matrix Organization Structure
Related Solution:
The solution handles designs of any complexity, and the comprehensive library covers all key aspects of a transportation system. To further enhance your map design, there is the option to embed links, that can display station images or other relevant, important information. We have also included a set of samples in the solution, that show the possible real-world application — complex tube systems including the London Tube and New York City Subway show the level of detail possible when using the Metro Map Solution.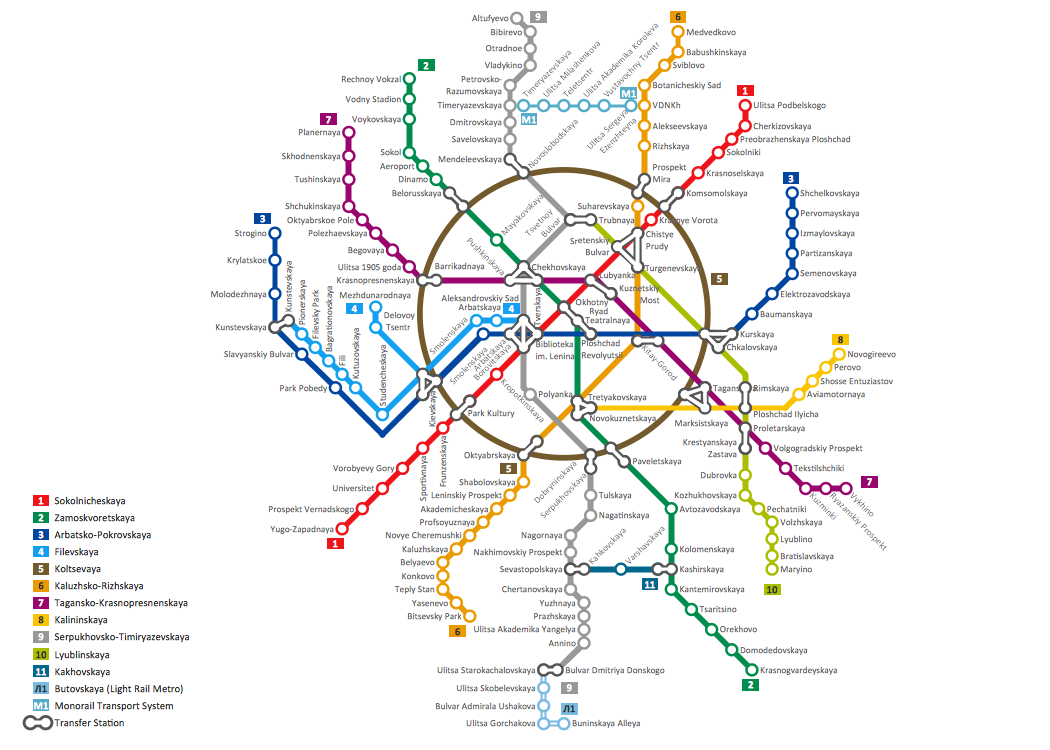
Picture: How to Draw Metro Map style infographics? Moscow, New York, Los Angeles, London
Related Solution:
Office design must to be well thought-out. It is especially important for the small offices, where each detail is in sight. ConceptDraw DIAGRAM software offers you the Office Layout Plans Solution from the Building Plans Area for quick and easy creating detailed Small Office Design plans.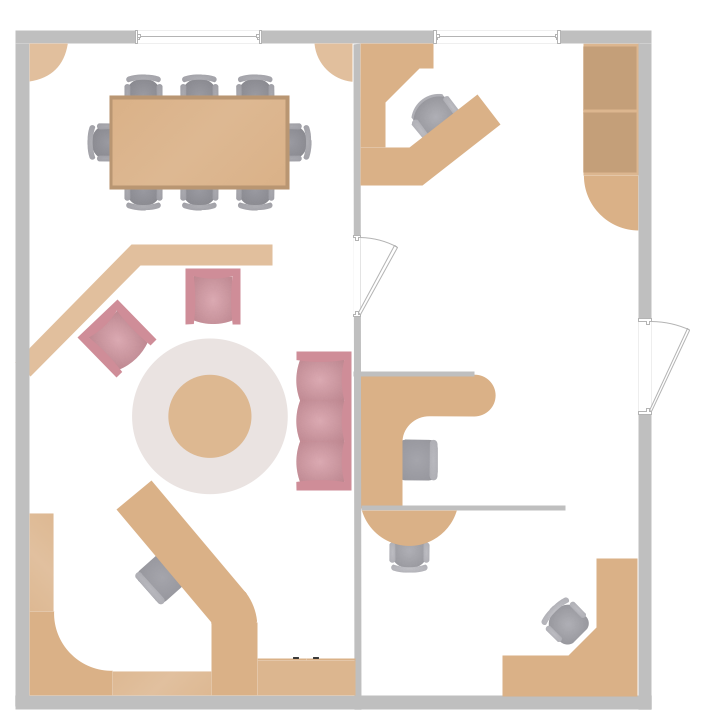
Picture: Small Office Design
Related Solution:
Infographic is a visual way of representing various information, data, knowledge in statistics, geography, journalism, education, and much more areas. ConceptDraw DIAGRAM supplied with Pictorial Infographics Solution from the “Infographics” Area, provides a set of powerful pictorial infographics tools. Thanks to them it is the best Infographic Maker.
Picture: Infographic Maker
Related Solution:
This sample shows the Pie Donut Chart. It was created in ConceptDraw DIAGRAM diagramming and vector drawing software using the ready-to-use object from the Pie Charts Solution from Graphs and Charts area of ConceptDraw Solution Park.
The Pie Donut Chart visualizes the percentage of parts of the whole and looks like as a ring divided into sectors. Pie Donut Charts are widely used in the business, statistics, analytics, mass media.
Picture: Pie Donut Chart. Pie Chart Examples
Related Solution:
Event-Driven Process Chain Diagrams for improvement throughout an organisation.
ConceptDraw DIAGRAM - software that reduces the time needed to create a business process model.
Picture: Modelling Complex Events with Event-Driven Process chain
Related Solution:
Any hierarchical structure of any company can be represented as a triangle or a pyramid. You can create a pyramid diagram and pyramid chart of any complexity using special libraries included in ConceptDraw DIAGRAM. Actually, any knowledge or chain of facts can also be depicted as a pyramid.
A wide range of graph and chart are utilized in marketing to maintain documentation and various visual issues, that deal with marketing information and data. The marketing value pyramid can be created to illustrate how the value of company, or product is based on its competitiveness. To design this diagram we used ConceptDraw DIAGRAM drawing tools in conjunction with Pyramid solution for Solution Park.
Picture: Pyramid Diagram and Pyramid Chart
Related Solutions:
ConceptDraw
DIAGRAM 18