Made with
ConceptDraw
DIAGRAM 18

Bubble diagrams with ConceptDraw DIAGRAM

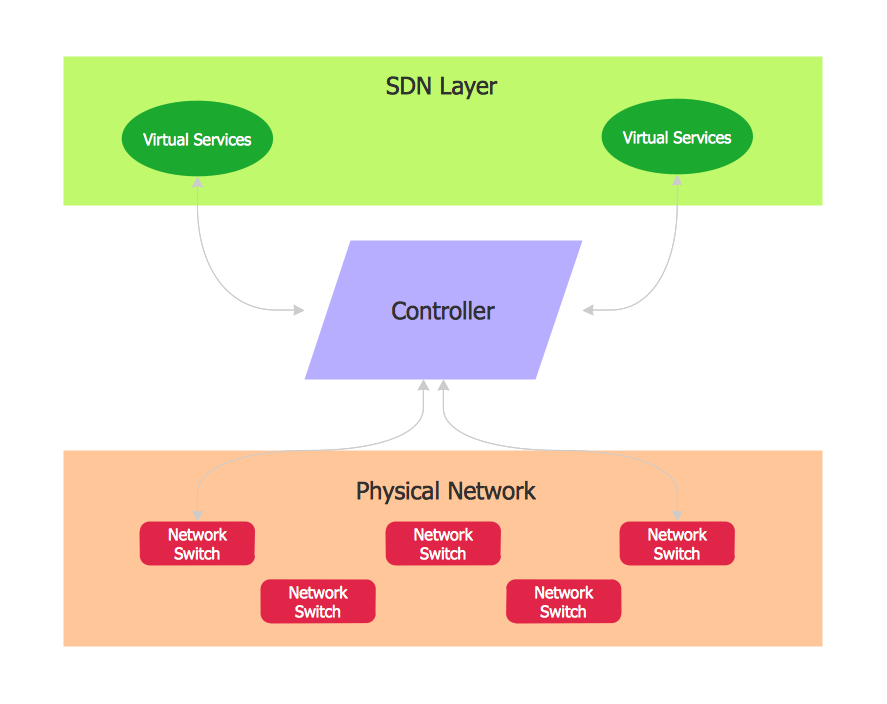
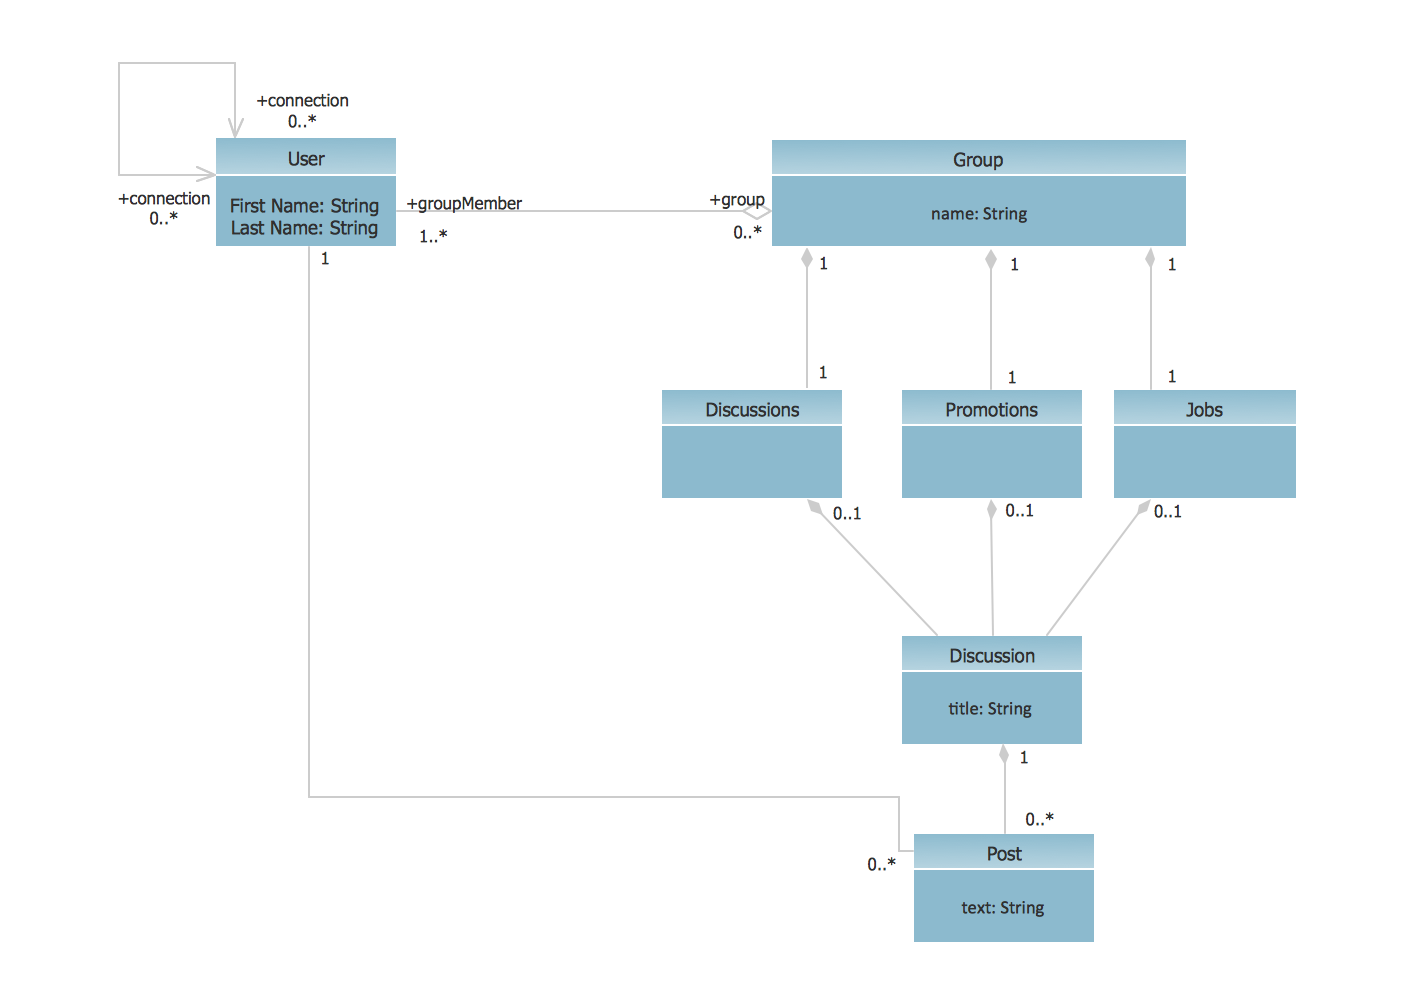
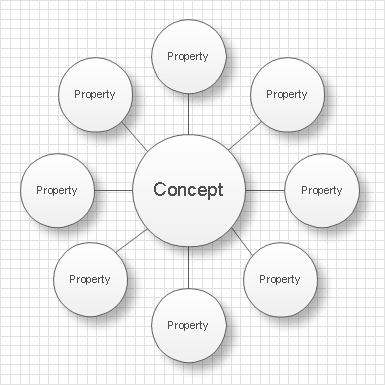
Bubble diagrams – it is the name for several different types of diagrams. Thus call diagrams which are analogs of «mind maps», such diagrams are used in landscape design. Moreover, bubble diagrams – it is a diagrams with a bubble presentation of data and the size of a bubble is a parameter of data too. For example, it can display the importance of the data in diagram or its value. So you can operate three parameters on 2-dimensional diagram – X and Y coordinates of a bubble and its size.

Bubble diagrams as a «mind maps» analog.

Bubble diagrams – it is a sort of a «mind map». These diagrams are called so because they consist from bubbles of different sizes which represent some ideas or concepts. Certain bubble diagrams objects are connected with linking lines which represent the type and character of links between the objects. For example, some ideas could be a part of the concerned conception while the other ideas represented in the diagram could only interact with this conception in some manner. You can show the importance of ideas and concepts using the bubbles of different sizes.

Such diagrams are used for ideas organization, in brainstorming processes, by teachers for explaining difficult ideas or for presentations. Bubble diagrams can be single, double, triple and so on. Single diagrams are used for description of an object or conception.

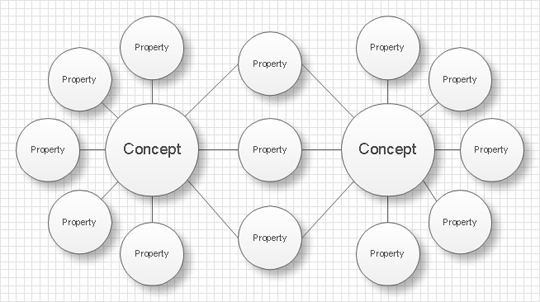
Double and more diagrams are used for comparison of two or more objects or conceptions. In such case you can create several single diagrams and link them as well as firstly define all compared objects with their properties and then link properties and objects to see what is in common. In the first case all properties will be clearly defined by their belonging to an objects but it will be more difficult to set the links between the compared objects. In the second case you could easily define the common properties for objects but it will be more difficult to find the unique properties.

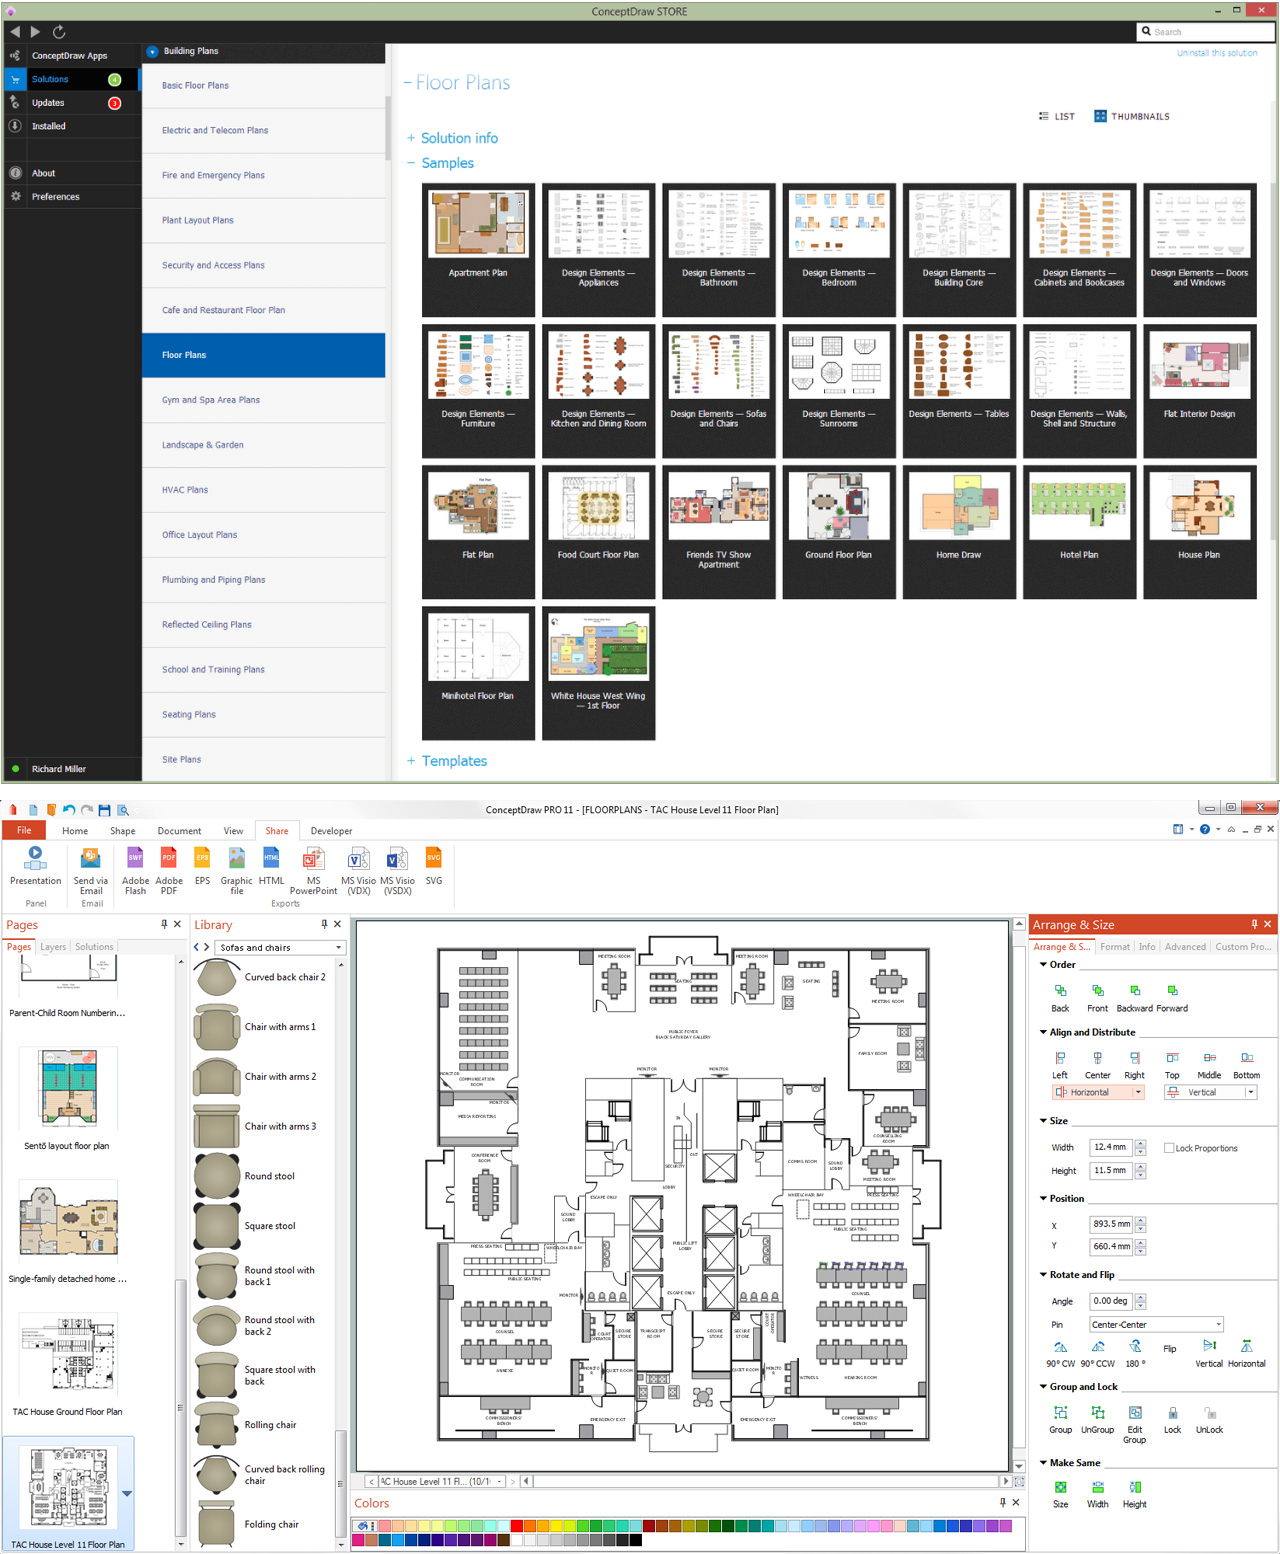
While creating a bubble diagram you can use specialized software. It will ease the creation of a diagram and what’s more – the following work with the diagram will be much easier and convenient. For example, you can use ConceptDraw.

Using ConceptDraw you will be able to create diagrams from the ready ConceptDraw library objects or make your own objects. The created diagram can be saved and edited, objects can be moved and links between them will be automatically repainted after object moving because of using the ConceptDraw connectors. If you use Smart Connection Mode the links will display jumps in crossing places that will easy the reading and comprehension of the diagram.

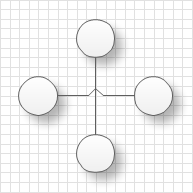
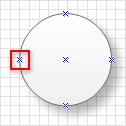
The distinctive property of the diagrams created in ConceptDraw is that you can connect the connector lines only to the defined connection points on the objects. But you can always add enough connection points to create the good-looking and proportional diagram.

You can edit single object in the diagram as well as a group of objects. It is particularly convenient if you want to fill objects of some conception with the selected color. Besides the solid color fill in ConceptDraw you supports several variants of gradient filling, patterns, textures and transparency.

All this will let you to create the professional, clear and good-looking bubble diagram.

Bubble diagrams with ConceptDraw DIAGRAM  *

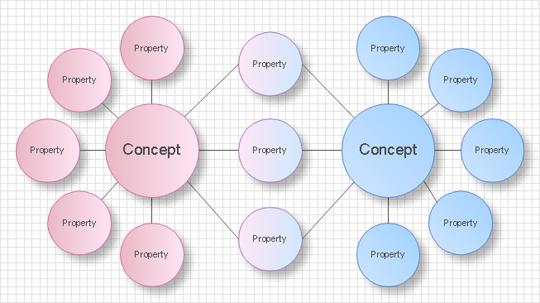
The samples you see on this page were created in ConceptDraw DIAGRAM using the Business Diagrams Solution for ConceptDraw DIAGRAM. These Bubble Charts successfully demonstrate solution's capabilities and professional results you can achieve. An experienced user spent 5-10 minutes creating every of these samples.

Use the Business Diagrams Solution for ConceptDraw DIAGRAM software to create your own professional-looking Bubble Charts of any complexity quick and easy, and then successfully use them in your work activity.

All source documents are vector graphic documents. They are available for reviewing, modifying, or converting to a variety of formats (PDF file, MS PowerPoint, MS Visio, and many other graphic formats) from the ConceptDraw STORE. The Business Diagrams Solution is available for all ConceptDraw DIAGRAM or later users.


TEN RELATED HOW TO's:
When designing a network, it is important to take into account the hierarchy of network devices. When you have a root device you should consider a tree network topology that might have any number of lower levels as you might need. This technology is based on star and bus network topologies. This is a schematic representation of a Tree computer network topology. A tree topology means that some star networks are linked together. A star network is a topology of the local network where a central workstation is connected with each end-user computer or peripherals. A tree structure means that, the central nodes of these star networks are linked to a main cable (the Bus topology). So, a Tree network topology is a few Star networks connected into a Bus topology. This scheme can be applied to draw the particular physical or logical network diagrams using the ConceptDraw Computer and Networks solution.Tree Network Topology Diagram *
Picture: Tree Network Topology Diagram
Related Solution:
Sometimes, when it is difficult to create a functional space plan or to rearrange existing one, the art of interior design comes in. It doesn't matter, if you need a cozy bedroom or an office layout plan, you should use appropriate tools to make your design great. While making a floor plan of a new office it could be useful to apply some design elements such as furniture and office equipment. This diagram presents an office furniture objects that can be used for office interior design planning, or making office furniture and equipment layouts. This vector stencils library is supplied with ConceptDraw Office Layout Plans solution. It contains more then 30 vector objects of office interior for making office floor plans including an office space layout plans and furniture arrangement.Office Layout Plan Design Element
Picture: Interior Design. Office Layout Plan Design Element
Related Solution:
New Smart connectors in ConceptDraw DIAGRAM now have an auto-routing feature. This means that connectors always find the optimal route between objects and automatically recalculate that path when moving these objects. You don't have to think about your connectors, they think for you.ConceptDraw Arrows10 Technology *
Picture: ConceptDraw Arrows10 Technology
There are numerous articles about the advantages of flowcharting, creating business graphics and developing different charts. Nevertheless, these articles are almost useless without the main component - the examples of flowcharts, org charts and without a fine example, it is difficult to get all the conveniences of creating diagrams. You can find tons of templates and vivid examples on Solution Park. This illustration shows a variety of business diagrams that can be created using ConceptDraw DIAGRAM. It comprises a different fields of business activities: management, marketing, networking, software and database development along with design of infographics and business illustrations. ConceptDraw DIAGRAM provides a huge set of sample drawings including business process modeling diagrams,, network diagrams, UML diagrams, orgcharts, DFD, flowcharts, ERD, geographical maps and more.Examples of Flowcharts, Org Charts and More
Picture: Examples of Flowcharts, Org Charts and More
Related Solution:
You can design the Prioritization Matrix by hand on the paper, but we offer you the most easier way — to use the ConceptDraw DIAGRAM diagramming and vector drawing software extended with Seven Management and Planning Tools Solution from the Management Area.Prioritization Matrix *
Picture: Prioritization Matrix
Related Solution:
Risk Diagram (PDPC) - ConceptDraw OFFICE suite is a software for Risks Diagram making. This diagram identifies possible risks in accomplishing corrective actions. With the Risks Diagram, one analyzes each action separately in a tree of all actions and develops a preventive action in response of each potential obstacles or circumstances which may be a risk.CORRECTIVE ACTIONS PLANNING. Risk Diagram (PDPC) *
Picture: CORRECTIVE ACTIONS PLANNING. Risk Diagram (PDPC)
While studying, many of the students encounter the necessity of remaking class projects, over and over. To facilitate this process you can use special electrical and telecom plan software, which helps altering projects in several clicks. Using templates will fasten your work, and you will have more free time. This sample represents an electrical and telecommunication floor plan. Electrical and telecom floor plans contain a floor plan , on which imposed the layout of electrical, and telecommunications equipment. They shows electrical and telecom details regarding the current floor of a building: lightening, fixtures, wires, outlets, circuit panels, etc. Using of standart notation of electrical and telecommunication symbols makes the plan understandable for engineers, architects, constructors, specialist in electricity and telecommunications.Electrical and Telecom Plan Software
Picture: Electrical and Telecom Plan Software
Related Solution:
Value Stream Mapping solution extends ConceptDraw DIAGRAM software with templates, samples and vector shapes for drawing the current state value stream maps.Learn how to create a current <br>state value stream map *
Picture: Learn how to create a current state value stream map
Related Solution:
Teams working with Scrum methodology use the product backlog items (PBIs), bug work item types (WITs), reports and dashboards. SCRUM Workflow solution for ConceptDraw DIAGRAM software offers collection of samples, variety of predesigned objects, clipart and graphic elements, a set of Scrum process work items and workflow which are developed for agile teams working using Scrum.Scrum process work items and workflow *
Picture: Scrum process work items and workflow
Related Solution:
The arrangement of tables and seating charts near them have great value in many premises and situations. It is often very convenient to draw a plan before the furniture arrangement. ConceptDraw DIAGRAM software offers the Seating Plans solution from the Building Plans area for fast and easy drawing the table seating chart template and samples.Table Seating Chart Template *
Picture: Table Seating Chart Template
Related Solution:
ConceptDraw
DIAGRAM 18