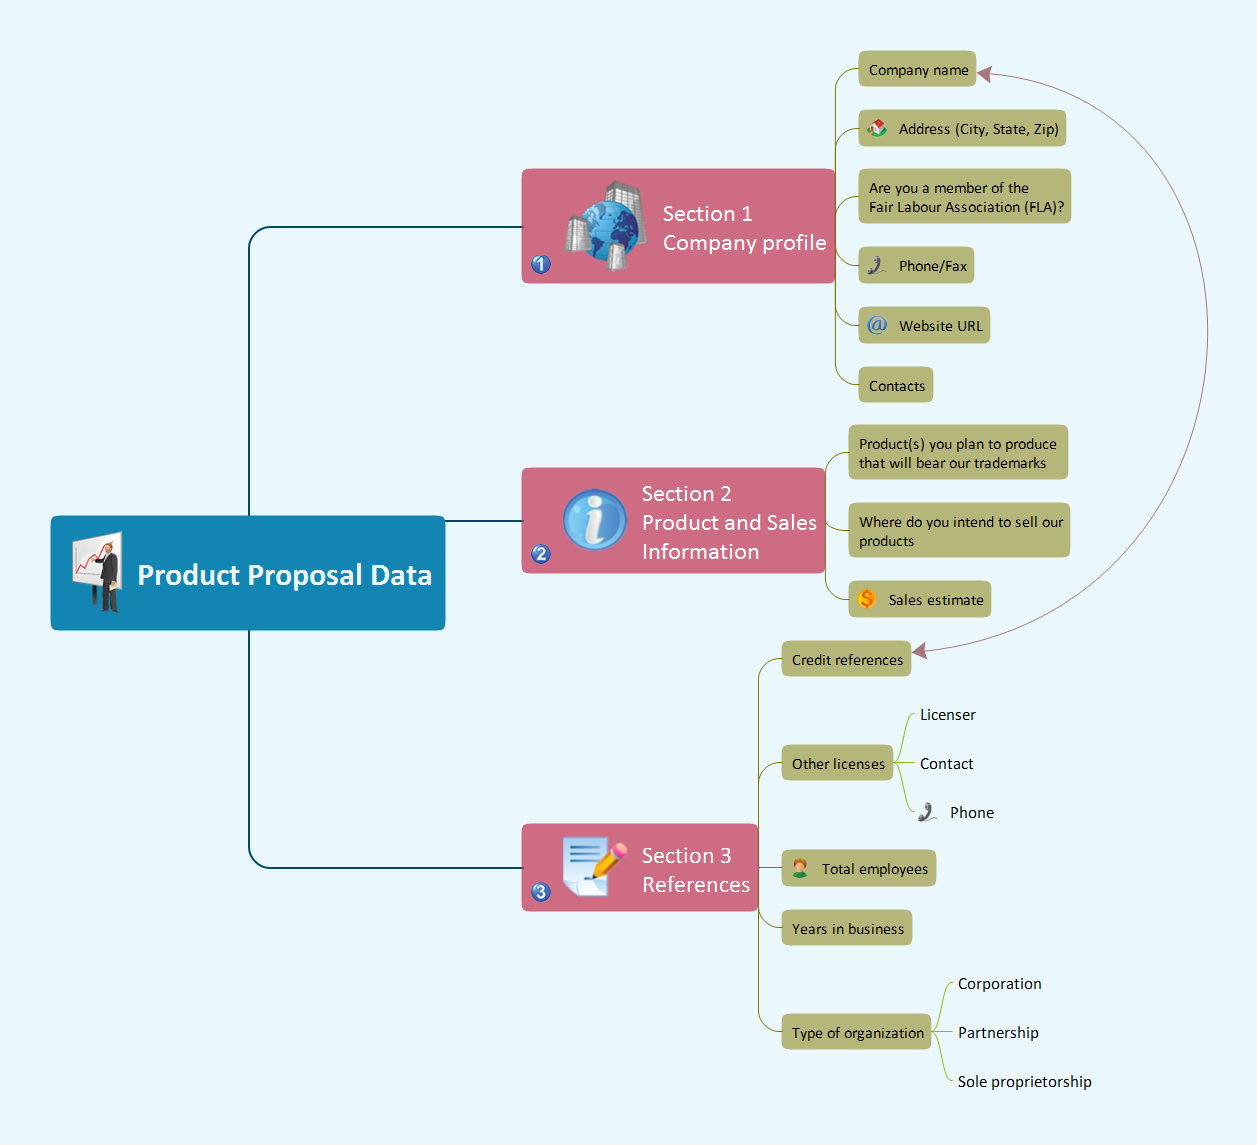
Product Proposal Data document mind map sample is created using ConceptDraw MINDMAP mind mapping software. This mind map example helps to learn how to share and present business documents to team via Skype.
Use this mindmap example for implementation of Remote Presentation for Skype solution from ConceptDraw Solution Park.
TEN RELATED HOW TO's:
The SWOT Analysis solution contains easy-to-use mind map templates that help identify Strengths, Weaknesses, Opportunities, and Threats, as well as outputs to ConceptDraw DIAGRAM for presenting analysis results.
Picture: SWOT Analysis
Related Solution:
Using ConceptDraw you will be able to create bubble diagrams from the ready ConceptDraw library objects or make your own objects. The created diagram can be saved and edited, objects can be moved and links between them will be automatically repainted after object moving because of using the ConceptDraw connectors.
Picture: Bubble diagrams with ConceptDraw DIAGRAM
Related Solution:
Video tutorials on ConceptDraw products. Try it today!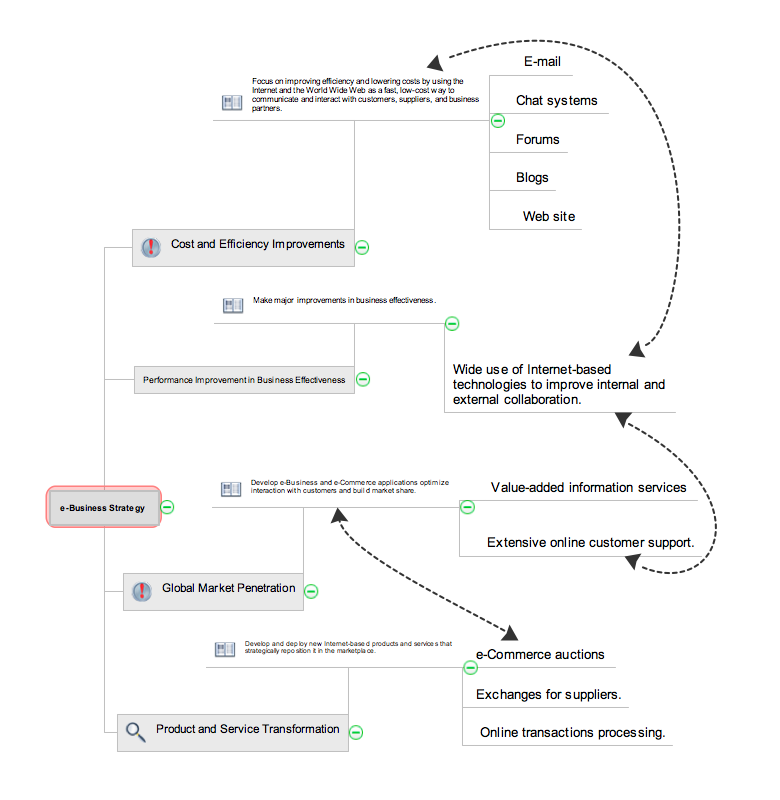
Picture: How to show a mind map presentation via Skype
Related Solutions:
You want to make an infographic and need the useful and convenient drawing tools for this? In this case the ConceptDraw DIAGRAM software extended with Education Infographics Solution is a real godsend for you.
Picture: Make an Infographic
Related Solution:
Any building project must respond to some requirements. Moreover, finding a drawing software for developing a waste water plan is significant. Designing plumbing plans may be difficult in the beginning, but practice makes perfect.
Layout of plumbing fixtures and, kitchen equipment a is a very important part of the home's interior design. If you do not want to find out suddenly the bath in your kitchen, or stove in your bathroom, you need to pay due attention to this plan. ConceptDraw Building Plans libraries give you a number of vector objects. Using them you can quickly and professionally sketch a plan of kitchen or bathroom in proper scale and with objects depicting your desired equipment. Then your contractor never will confuse a bath with a stove and a washing machine with a toilet and your house will be really a home of your dreams.
Picture: Building Drawing Software for Designing Plumbing
Related Solution:
Designing your own house sounds exciting at the beginning, but as the time passes, the more you realize there are stumbling blocks. To aid yourself, discover how to use house design software, and develop floor plans, landscape layouts or furniture arrangement plans easily. You can start from altering templates, and you won’t even notice how your designing skills would improve rapidly.
This private country house and landscape plan was created using ConceptDraw Floor Plans solution. Its power set of libraries containing near 700 vector graphic elements enhanced with handy templates is designed, so that an ordinary people can create professional floor plans. Using the stuff, provided by this solution, you can effortlessly design a plan of house, rooms and even backyard layout and landscape. This will save your time and money.This sample plan represents a detailed plan of the private ownership. It defines the apartments layout, the appointment arrangement and even possible location of plants in the garden.
Picture: How To use House Design Software
Related Solution:
The Bubble Map is a popular tool for visualization a data set which is widely used in economics, medicine, software engineering, architecture, and many other fields. Each bubble on the Bubble Map is characterized by coordinates, color and size. ConceptDraw DIAGRAM diagramming and vector drawing software extended with Business Diagrams Solution from the Management Area is a powerful Bubble Map Maker.
Picture: Bubble Map Maker
Related Solution:
It is easy to recreate any informational system structure using diagrams. There are three main components of any ER diagram: entity, attribute and relationship. Basing on these three components, one can define other, less used elements, such as weak entity or relationship, derived attribute, recursive relationship etc.
This is the set of graphic elements of ERD Chen's notation. This ERD notation is used to represent an entity–relationship models. It involves the set of geometric forms: rectangles - depicting entities, ovals - representing attributes and diamonds depicting relationships assigned for first-class objects, that can have relationships and attributes of their own. Connections are displayed with arrowed lines. It is known that the Chen's ERD notation is used to show a detailed view of entities and relationships. ConceptDraw Entity-Relationship Diagram solution from the Software Development section of Solution Park provides the ability to create ERD of database structure for software development purposes using the Chen’s notation elements.
Picture: Components of ER Diagram
Related Solution:
Great examples of Infographic Maps, they are needed for inspiration.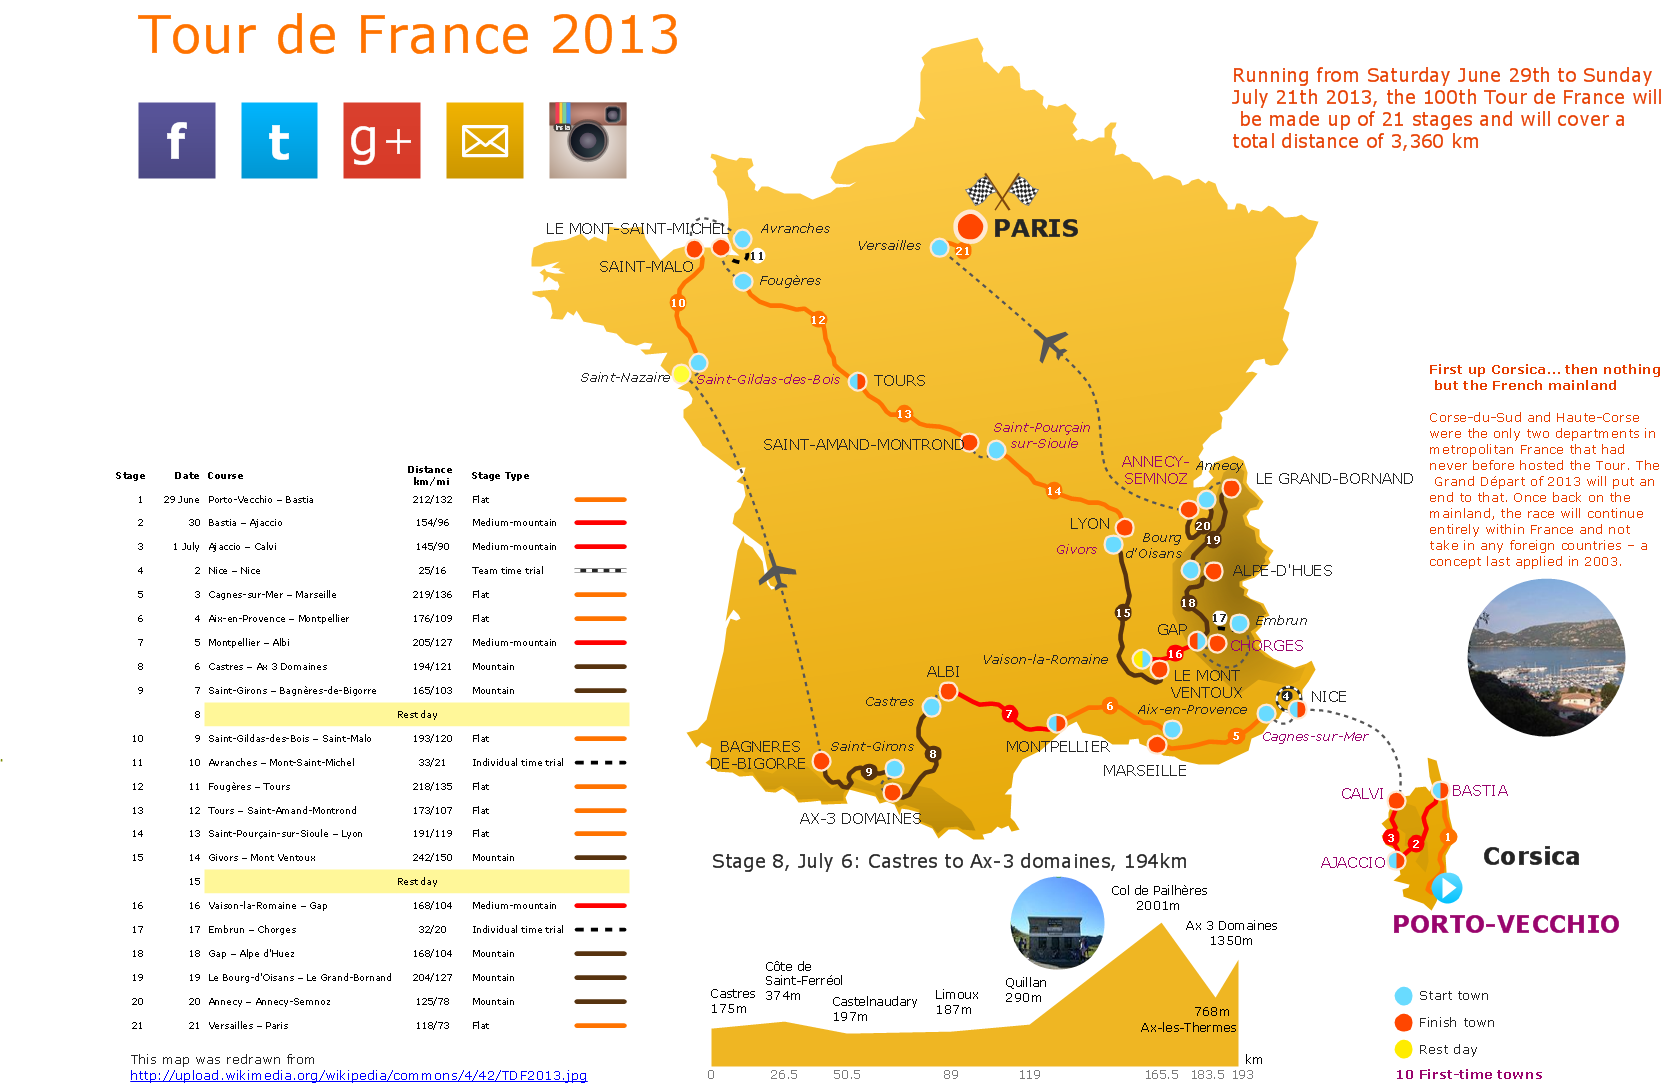
Picture: Superb Examples of Infographic Maps
Enterprise collaboration software helps to facilitate action-oriented teams working together over geographic distances by providing tools that aids on communication, collaboration process and problem solving.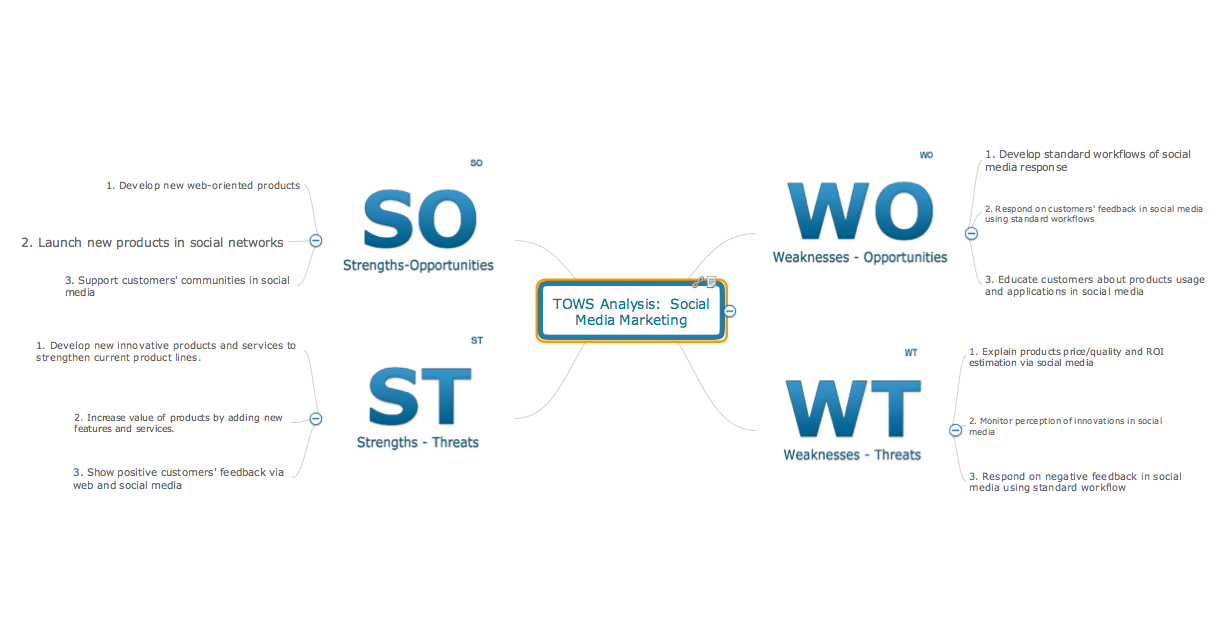
Picture: How To Use Enterprise Collaboration Software
Related Solution: