
Example 1. Components of ER Diagram, Crow's Foot and Chen's notations
The Chen's ERD notation is still used and is considered to present a more detailed way of representing entities and relationships.
Most other notation systems are adaptations, or use part of these original styles. Here is a brief list of some of other standards that have been developed:
- Bachman notation
- Barker’s notation (ERDs for Oracle)
- EXPRESS and EXPRESS-G notation
- IDEFX1
- UML class diagrams
- Merise
- Object role modeling
- (Min – Max) notation

Example 2. ER Diagram, Chen's notation
ERDs are an invaluable tool for software engineers, particularly since computing capacity, and thus data storage capacity, has markedly increased in recent years. They allow every aspect of database design to be managed, tested and communicated before implementation. Because ERDs have such a broad scope of influence across database activities, it’s imperative the standardized notation can be utilized and interpreted by a wide variety of stakeholders.

Example 3. ER Diagram, Crow's Foot
The Entity-Relationship Diagram (ERD) solution from ConceptDraw Solution Park extends ConceptDraw DIAGRAM ector graphics and diagramming software with the ability to draw your own entity relationship diagrams using Chen's or Crow's Foot notations applying 2 libraries with numerous predesigned ER icons:
- ERD, Chen's Notation library
- ERD, Crow's Foot Notation library

Example 4. ERD Solution
The samples you see on this page were created in ConceptDraw DIAGRAM using the components of ER diagram from the libraries of Entity-Relationship Diagram (ERD) Solution. An experienced user spent 10-15 minutes creating each of these samples.
Use the Entity-Relationship Diagram (ERD) Solution for ConceptDraw DIAGRAM to create your own Entity-Relationship Diagrams of any complexity quick, easy and effective.
The Entity-Relationship Diagrams designed with ConceptDraw DIAGRAM are vector graphic documents and are available for reviewing, modifying, converting to a variety of formats (image, HTML, PDF file, MS PowerPoint Presentation, Adobe Flash or MS Visio), printing and send via e-mail in one moment.
TEN RELATED HOW TO's:
When you need to visually represent the structure of relational database, Entity relationship diagram (ERD) is a type of diagram for that case.
Most entity-relationship diagrams can be built with objects from Flowchart solution or ERD Solution which contains inbuilt templates. Follow these steps to create your own custom ERD diagram.
Don't be frightened if it looks complex, ConceptDraw DIAGRAM makes it easy to create an ERD, and hundreds of other diagrams, in minutes.
Picture: Developing Entity Relationship Diagrams
Related Solution:
When we start to speak about databases, we must always mention database structure visualization. One of the most common ways to do it is to create an entity relationship diagram, and to put appropriate symbols on it. It is important either for database projecting and for its' future maintenance.
Entity Relationship Diagram describes data elements and their relationships within a database. There are a set of special symbols that depict each element of an entity relationship diagram. Entities - represents some stable components such as supplier, employee, invoice, client, etc. Relation symbols show how the entities interact. Attributes define characteristics of the relationships. Attributes can be one-to-one or many-to-many. Physical symbols is used in the physical models. They represent items such as fields, tables, types and keys. ERD physical symbols are the building material for the database. Notation lines are used to illustrate the relationships. The most common method is Crow’s Feet notation. You can use ConceptDraw Entity-Relationship Diagram (ERD) solution to represent a database using the Entity-Relationship model.
Picture: Entity Relationship Diagram Symbols
Related Solution:
There are many ways to describe a database structure. One of the most usual is to draw an entity relationship diagram (ERD) using a Crow’s Foot notation to represent database elements. If you don’t want to draw it on paper, you should use an appropriate software.
An entity-relationship (ER) diagram is used to show the structure of a business database. ERD represents data as objects (entities) that are connected with standard relationships symbols which Illustrate an association between entities. ERD, there is a wide range of ERD notations used by data bases architects for reflecting the relationships between the data entities. According to the crow’s foot notation relationships are drawn as single labeled lines designating a certain kinds of relationship. Crow foot notation is a most frequently used ERD standard, because of improved readability of diagrams, with a more accurate use of space on the page._Win_Mac.png)
Picture: Entity Relationship Diagram - ERD - Software for Design Crows Foot ER Diagrams
Related Solution:
UML Component Diagrams are used to illustrate the structure of arbitrarily complex systems and illustrates the service consumer - service provider relationship between components.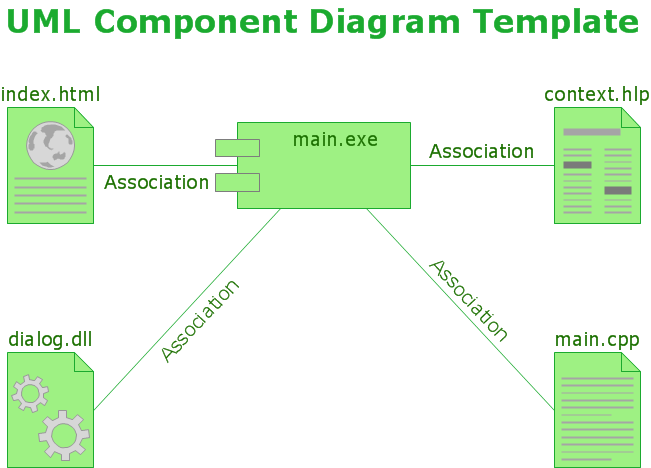
Picture: UML Component Diagram
UML Component Diagram illustrates show components are wired together to larger components and software systems that shows the structure of arbitrarily complex systems.
Rapid UML Solution for ConceptDraw DIAGRAM contains 13 vector stencils libraries with 393 interactive shapes that you can use to design your UML diagrams.
To design a Component Diagram use the UML Component Diagram library.
UML Component Diagram library contains 36 shapes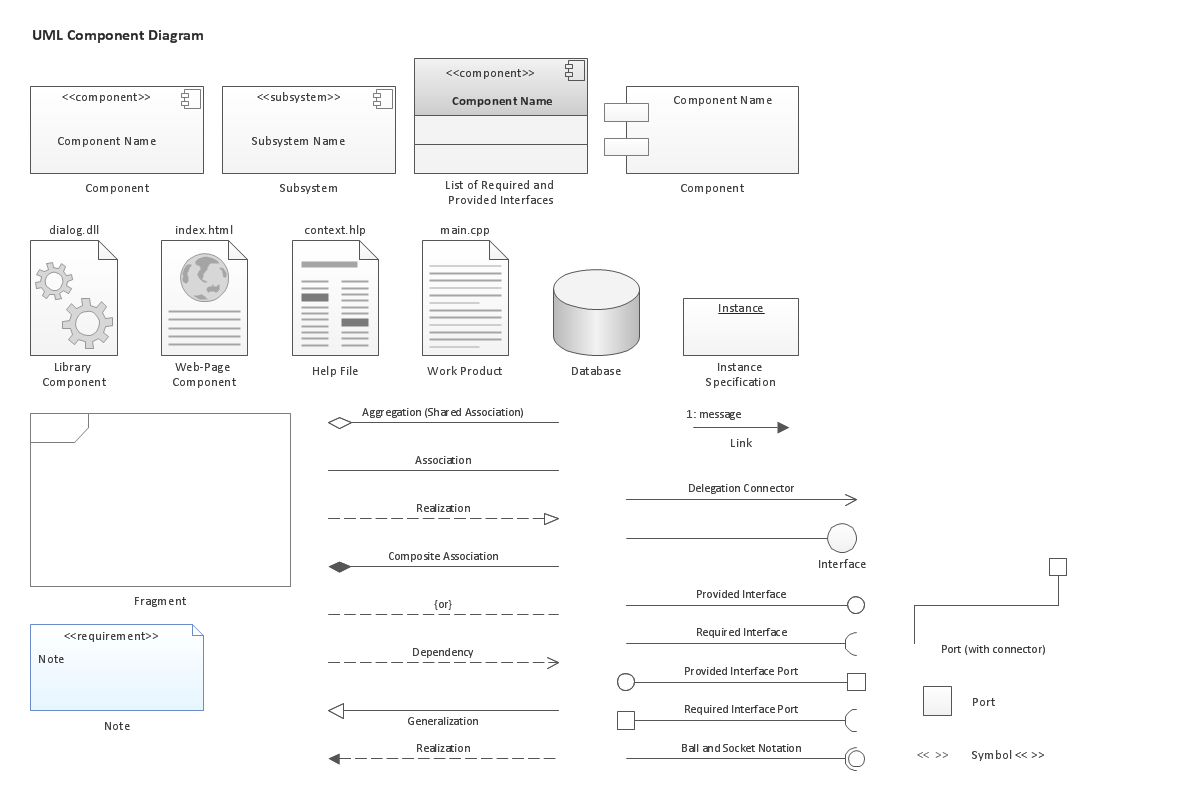
Picture: UML Component Diagram. Design Elements
Related Solution:
A database is a data collection, structured into some conceptual model. Two most common approaches of developing data models are UML diagrams and ER-model diagrams. There are several notations of entity-relationship diagram symbols and their meaning is slightly different. Crow’s Foot notation is quite descriptive and easy to understand, meanwhile, the Chen notation is great for conceptual modeling.
An entity relationship diagrams look very simple to a flowcharts. The main difference is the symbols provided by specific ERD notations. There are several models applied in entity-relationship diagrams: conceptual, logical and physical. Creating an entity relationship diagram requires using a specific notation. There are five main components of common ERD notations: Entities, Actions, Attributes, Cardinality and Connections. The two of notations most widely used for creating ERD are Chen notation and Crow foot notation. By the way, the Crow foot notation originates from the Chen notation - it is an adapted version of the Chen notation.
Picture: ERD Symbols and Meanings
Related Solution:
Creating of Entity-Relationship Diagrams (ERDs) is a complex process that requires convenient, automated tools. ConceptDraw DIAGRAM diagramming and vector drawing software offers a powerful ER Diagram Tool - the Entity-Relationship Diagram (ERD) Solution from the Software Development Area.
Picture: ER Diagram Tool
Related Solution:
The world-best Entity Relationship Diagram software suitable for professional ERD drawing is ConceptDraw DIAGRAM software extended with the Entity-Relationship Diagram (ERD) solution. This solution contains all libraries, templates and samples you may need for professional ERD drawing.
Picture: Entity Relationship Diagram Software
Related Solution:
Complexity of databases increases day by day, due to this the Entity relationship models and E-R diagrams become more and more popular, and now are an important part of database design. E-R diagrams created at ConceptDraw DIAGRAM allow visually and graphically represent structure and design of databases.
Picture: E-R Diagrams
Related Solution:
It is very difficult to get into database model idea without any examples. To create one, you can use Chen’s notation for Entity Relationship Diagrams (ERD) and try to see all the peculiarities yourself. This notation describes entities and relations as basic geometric shapes like rectangles and diamonds.
Chen notation for Entity-relationship diagrams is used for designing relational databases. It depicts the database entities as a set of subjects. For example events, people, ideas, etc. All entities has common characteristics (attributes). Any object of the system is identified as the sole and unique. The name of entity should indicate the class or type of the the whole object, not a given example. The connection commonly represents a relationship between entities. Conceptdraw Entity-Relationship Diagrams (ERD) solution provides the libraries with ready-to-use ERD element fitting Chen's notation objects and relationships.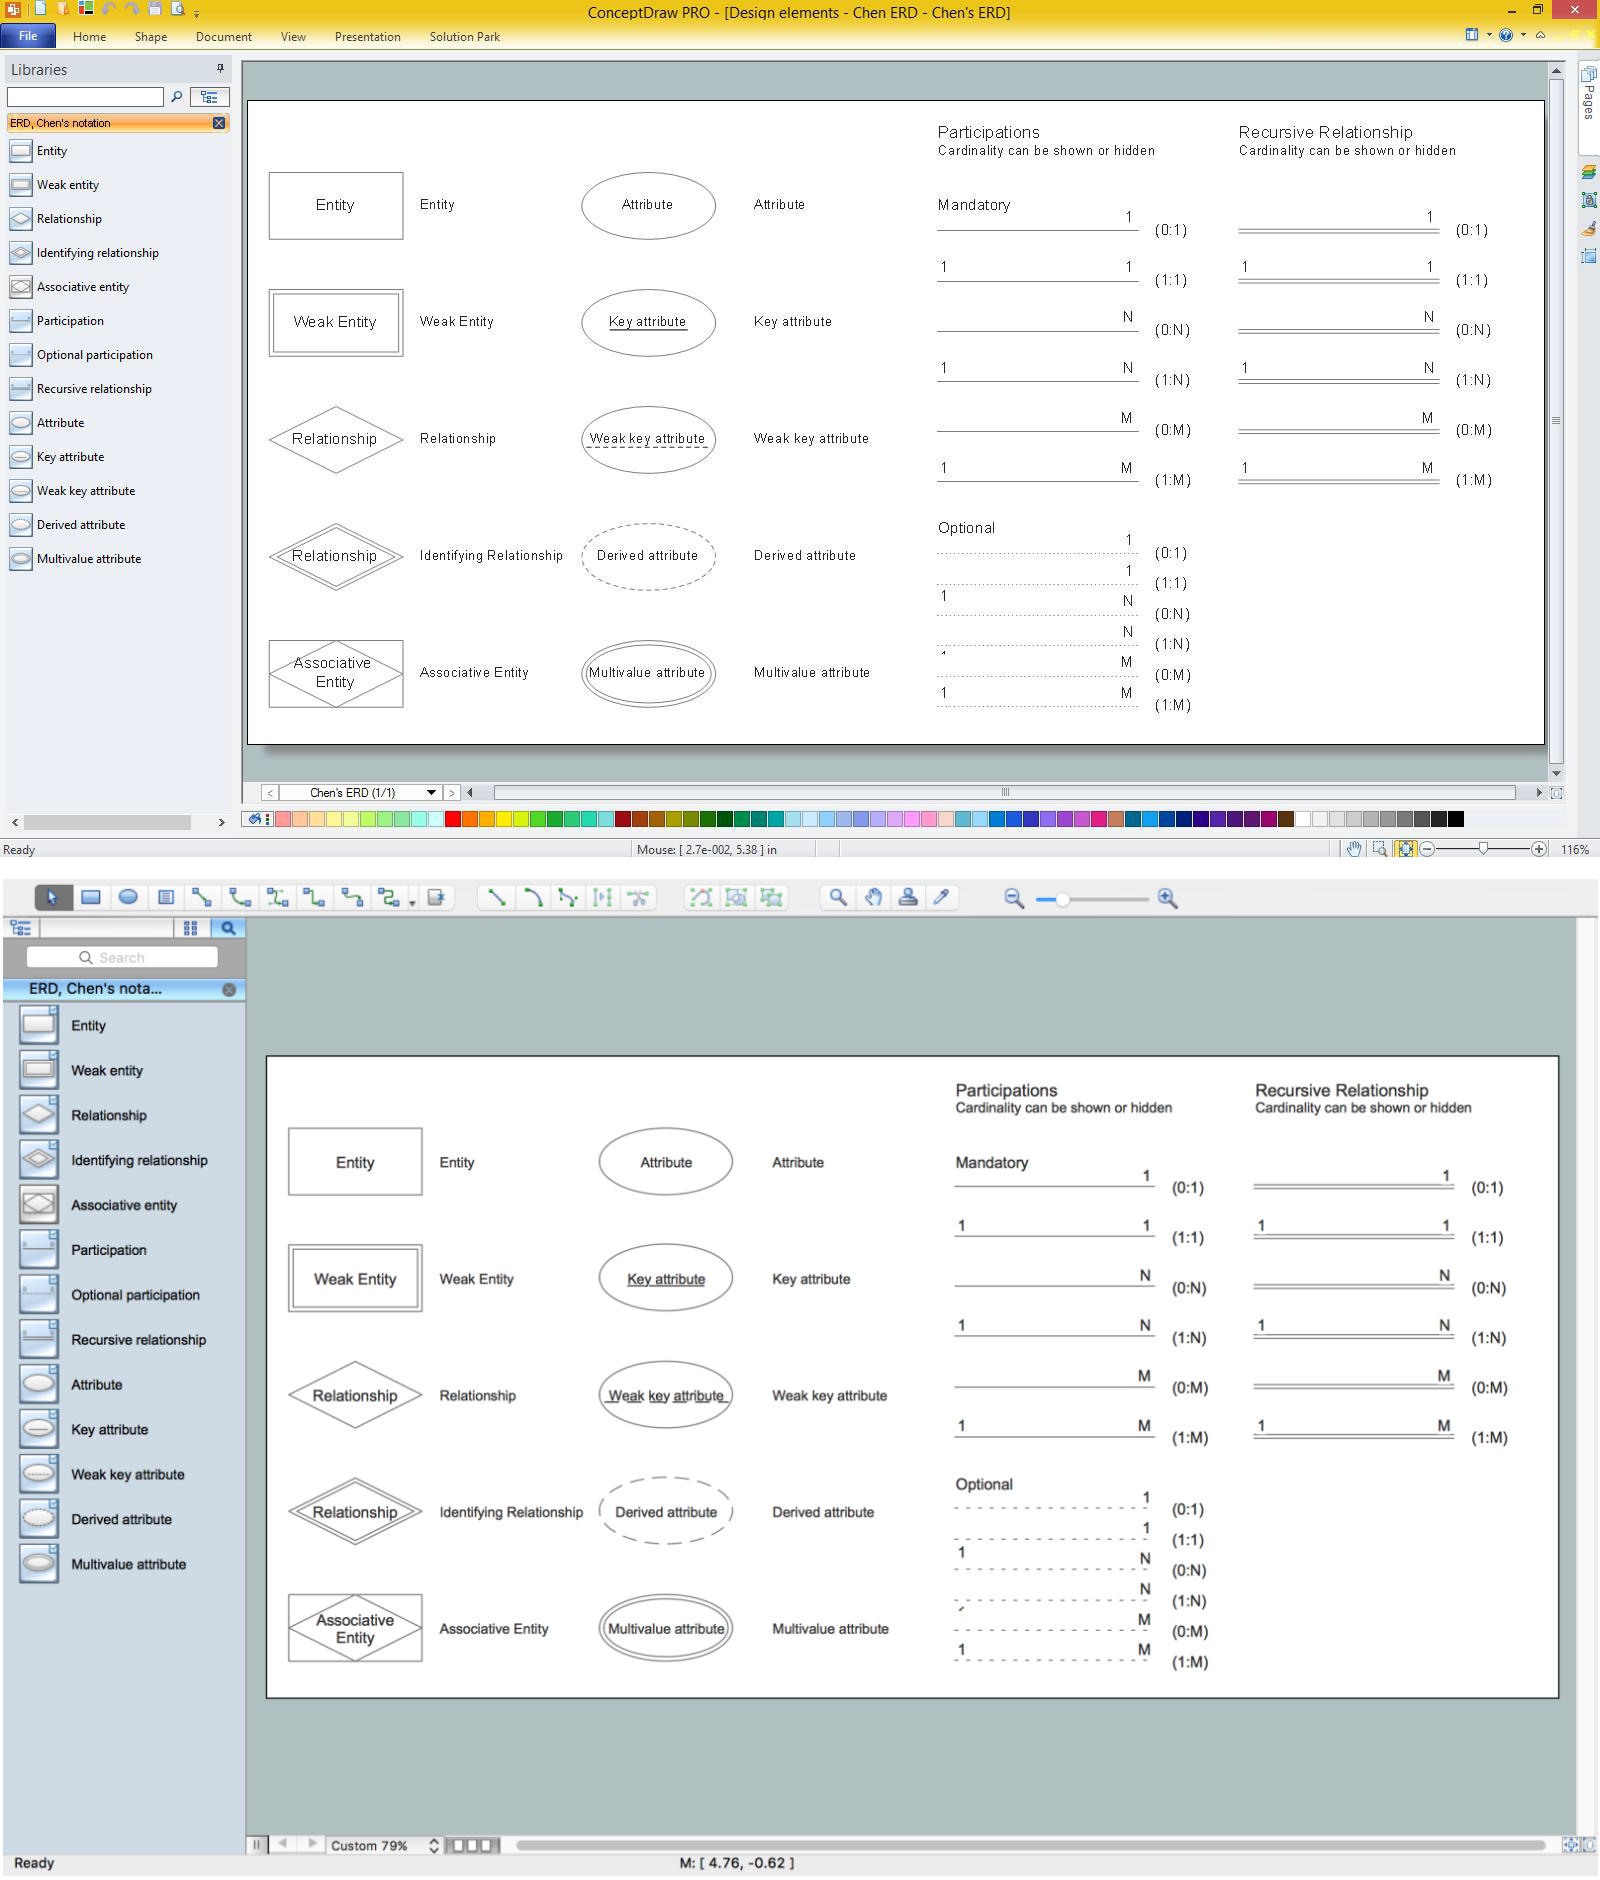
Picture: Design Element: Chen for Entity Relationship Diagram - ERD
Related Solution:


