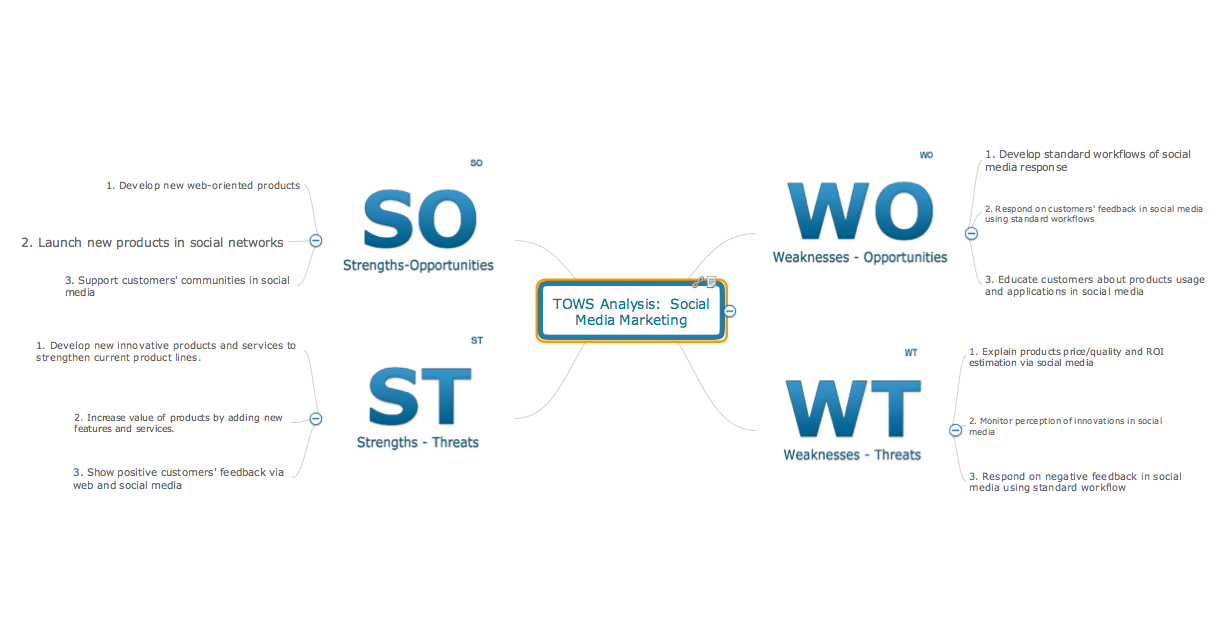
TOWS analysis social media marketing mind map sample is created using ConceptDraw MINDMAP mind mapping software. This mind map example helps to learn how to use mind map presentation via Skype in enterprise.
Use this mindmap example for implementation of Remote Presentation for Skype solution from ConceptDraw Solution Park.
NINE RELATED HOW TO's:
Structure of a software product might get very complex and complicated, if software engineers did not pay much attention to the architecture of the product. It will take a few minutes to create UML diagrams with ConceptDraw DIAGRAM , because this software is just perfect for diagramming. You can alter ready-to-use templates, or make your own, whatever you need.
This illustration represent the example of UML diagram made by using ConceptDraw Rapid UML solution. This activity diagram displays the stages of the software development process similar to a flow chart. This diagram depicts the states of elements in the software system. It can be applied to represent software and coding logic. This UML diagram was drawn with the help of the ConceptDraw Rapid UML solution which supplies the kit of vector libraries, containing the symbols of the Unified Modeling Language notations.
Picture: UML Diagrams with ConceptDraw DIAGRAM
Related Solution:
Mind map specifying various online marketing objectives for a company with specific targets outlined for each objective.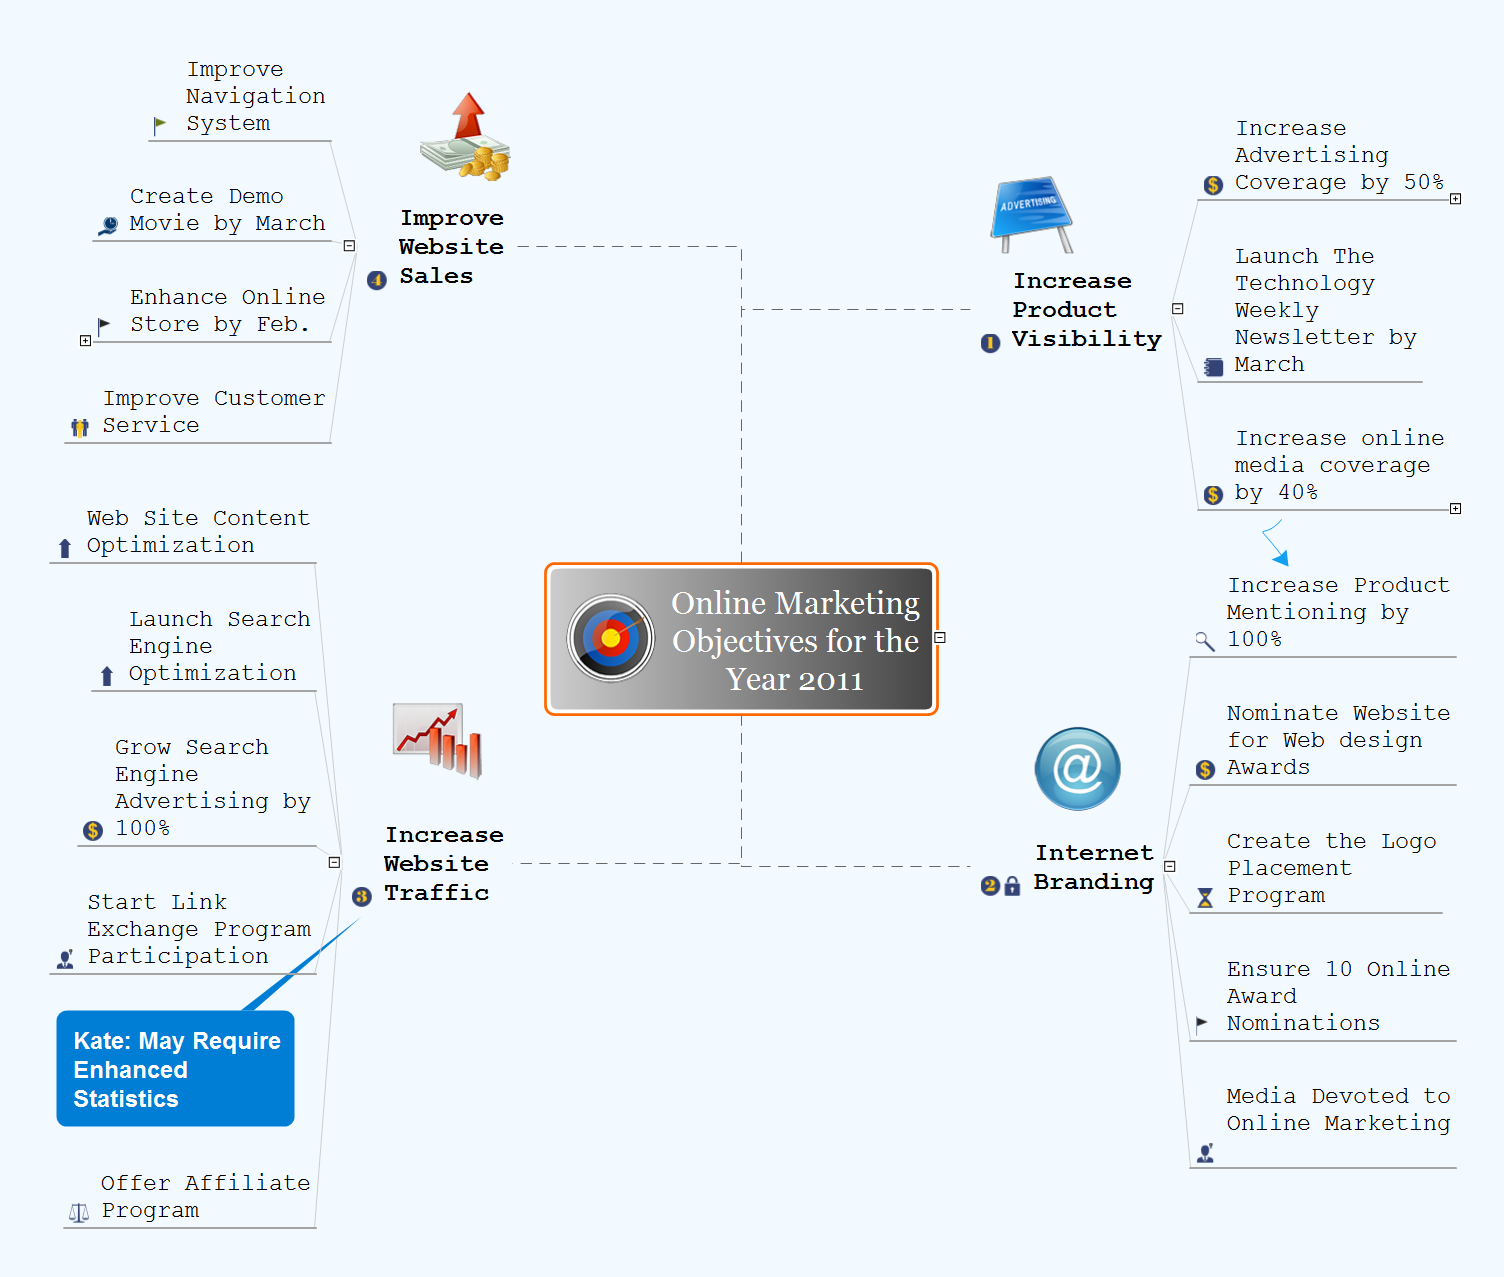
Picture: Online Marketing Objectives
Related Solution:
ConceptDraw MINDMAP - an excellent tool for exporting mind maps to PowerPoint to visualize and presenting your project. You can simply generate, change, update your mindmap and then make a presentation in PowerPoint.
Picture: How To Do A Mind Map In PowerPoint
Related Solution:
macOS is used increasingly often as a productivity platform by many companies and businesses across the world. SWOT Analysis is an essential business tool for companies to determine their future course of action. As a tool for digital drawing of SWOT Analysis diagrams under macOS, ConceptDraw offers Mac Tools - SWOT Analysis examples and templates are included to allow for effortless creation of SWOT and TOWS Analysis diagrams. With ConceptDraw it is equally easy to create your SWOT Analysis diagram under Microsoft Windows and macOS.
This image demonstrates the diversity of SWOT and TOWS matrix templates delivered with SWOT and TOWS Diagrams add-on for ConceptDraw DIAGRAM diagramming software. Together they compose a professional solution for performing SWOT and TOWS analysis. There are number of templates of different Matrix Diagrams. In addition to the set of embedded templates, this solution allows one to design SWOT and TOWS matrices tailored to certain business characteristics or corporate style. Using matrix template, you can easily discover Strengths, Weaknesses, Opportunities, and Threats, your business faced. This means that the first step to creating a successful business strategy, you have done.
Picture: Mac Tools - SWOT Analysis
Whenever you need quick presentations, the ability to choose specific content, the ability to focus on specific stakeholder needs, update data, or create polished slide decks — ConceptDraw MINDMAP provides a presentation solution for you.
Picture: Presentation Preparation using Mind Maps
Related Solution:
Jackson System Development (JSD) is a linear method of system development created by Michael A. Jackson and John Cameron in the 1980s. It comprises the whole software life cycle directly or providing a framework for more specialized techniques.
When implementing the Jackson System Development method and designing JSD diagrams, you can succesfully use the powerful and helpful tools of ConceptDraw DIAGRAM software extended with Entity-Relationship Diagram (ERD) solution from the Software Development area of ConceptDraw Solution Park.
Picture: JSD - Jackson system development
Related Solution:
Home remodeling is something that many people face at one point or the other. The first part of any home remodeling is to create a new home plan. At first, it may seem a daunting and costly endeavor, but to take it on yourself, you just need to choose the right home remodeling software. Digital drawing software, such as ConceptDraw DIAGRAM , includes home plan examples to help you get started, as well as multiple advanced and powerful options, and an intuitive interface to go with them.
People who want to make changes in their houses planning have previously prepare a plan of rebuilding, of house, apartment or any other construction. If somebody desires to change anything in the interior design he also requires a plan, as it’s handy to see on the plan the coming result and then begin to implement it. All these tasks will be solved better with ConceptDraw DIAGRAM and its solution for Building Plans. You will design professional looking Home Plans quick and easy using the vector libraries, templates and samples, supplied with Solution.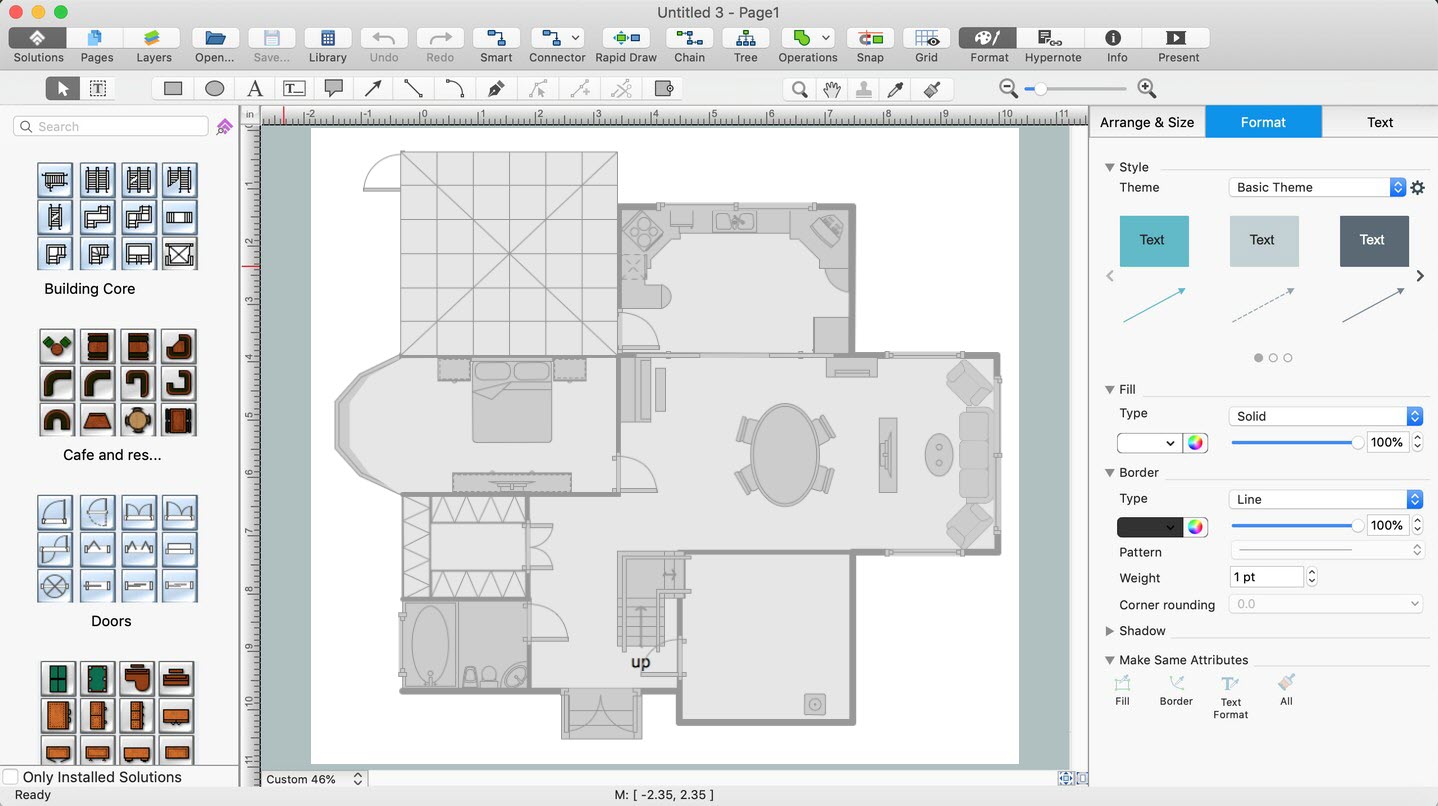
Picture: Home Remodeling Software. Home Plan Examples
Related Solution:
ConceptDraw PROJECT delivers a rich set of built-in functionalities and optional product extensions that support your daily workflow in time-saving and creative ways. This video lesson will teach you how to work with costs in your project document.
Picture: Project — Working With Costs
ConceptDraw MINDMAP and Evernote has a multitude of options for users — you can save any part of a mind map: including topics, branches, and entire maps to your Evernote.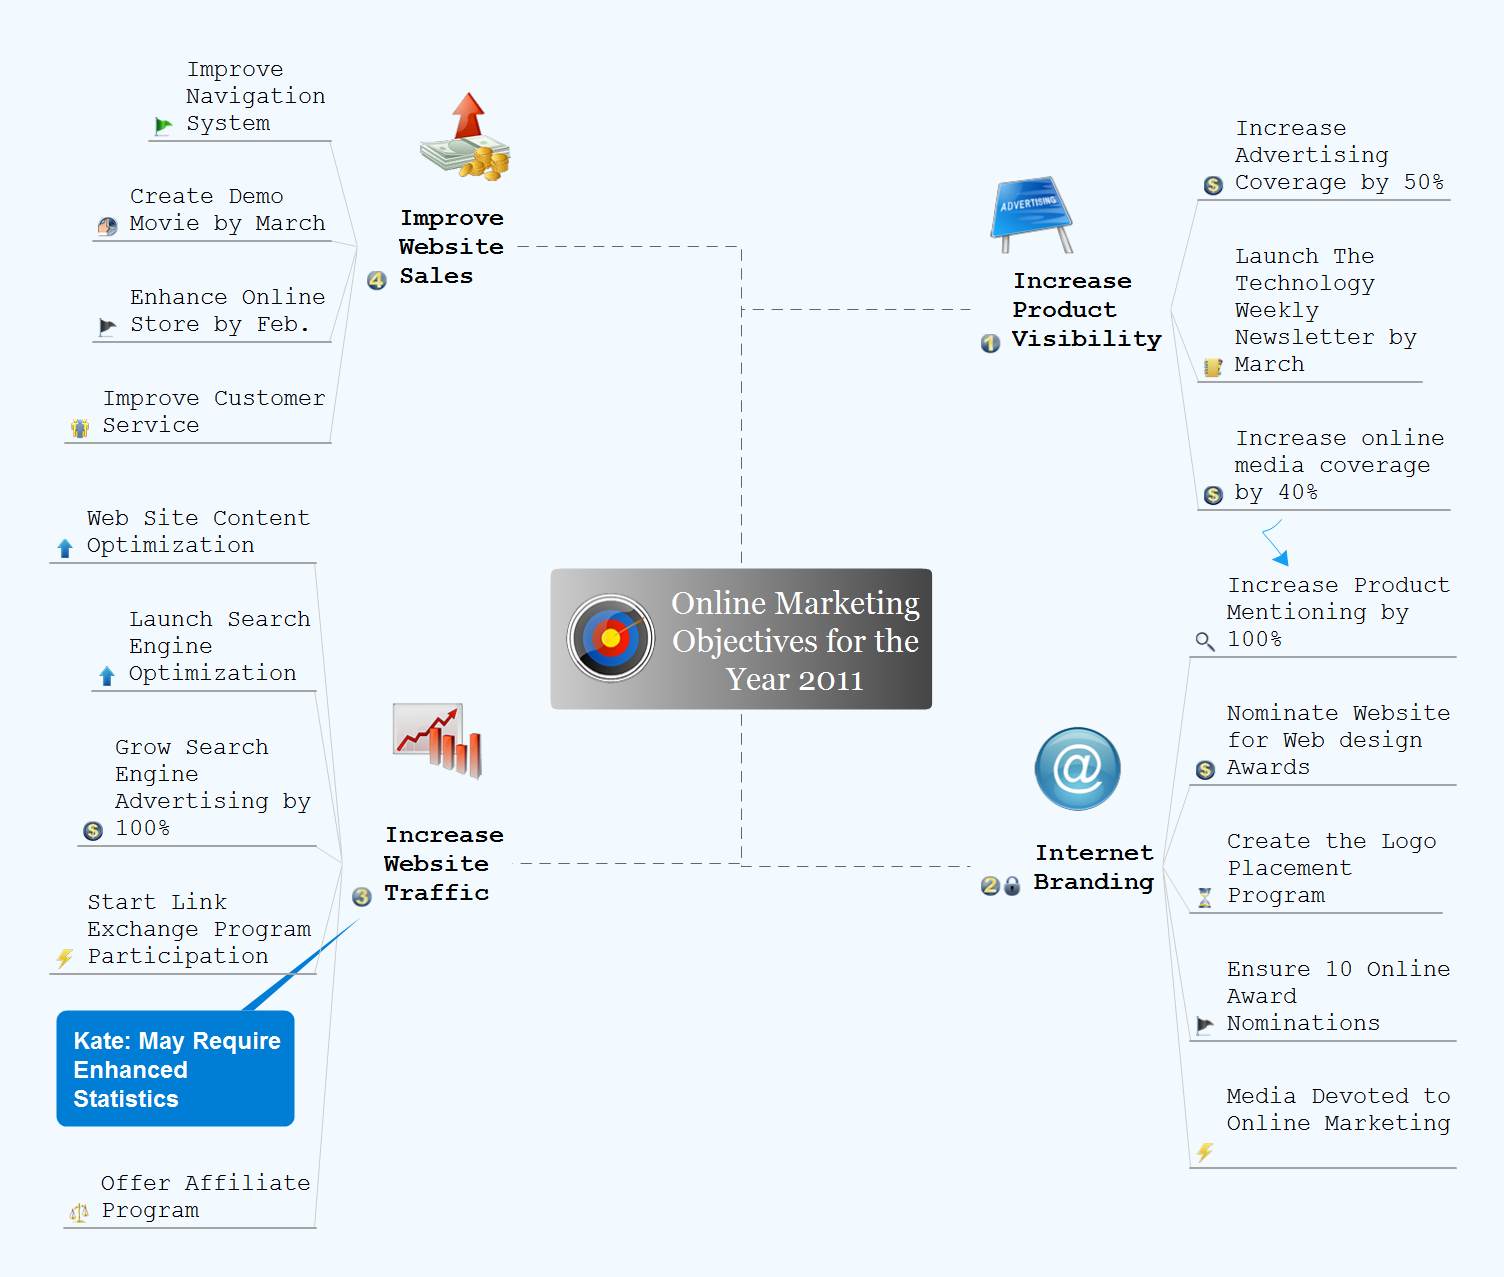
Picture: Evernote + MindMapping
Related Solution: