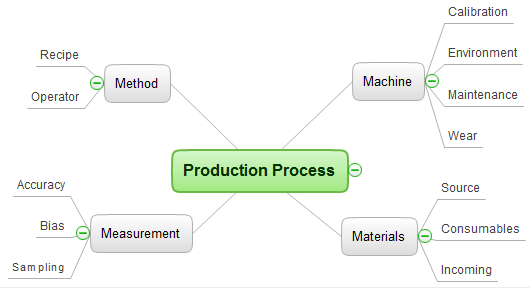
Production process quality problem solving mind map template is created using ConceptDraw MINDMAP mind mapping software. This mind map template helps group to collaborate on quality problem solving.
Use this mindmap template for implementation of Remote Presentation for Skype solution from ConceptDraw Solution Park.
EIGHT RELATED HOW TO's:
ConceptDraw MindMap benefits comparing to Mindjet Mindmanager:
Economical. (Lower license price, support is no charge maintenance is an optional one-time fee that delivers to you the next major release) ConceptDraw products are structured to save you money from the date of purchase for the life of the product. When you compare ConceptDraw MINDMAP to Mindjet Mindmanager the cost savings will be obvious.
Flexible Licensing. ConceptDraw is licensed per-named-user. Want ConceptDraw on 2 PCs, 2 Macs, or a PC and a Mac? Straightforward licensing makes this easy.
Picture: Looking at ConceptDraw MINDMAP as a Replacement for Mindjet Mindmanager
Related Solutions:
The visual form of mind maps is helpful in all stages of quality management, from describing problem to describing and documenting a decision.
Picture: Quality Project Management with Mind Maps
Related Solution:
Event-Driven Process Chain flowcharts for improvement throughout an organisation.
ConceptDraw DIAGRAM is a software for making EPC flowcharts to provide business process modelling. Its excellent business process improvement tools.
Picture: An Event-driven Process Chain (EPC) - flowchart used for business process modelling
Related Solution:
Mind map specifying various online marketing objectives for a company with specific targets outlined for each objective.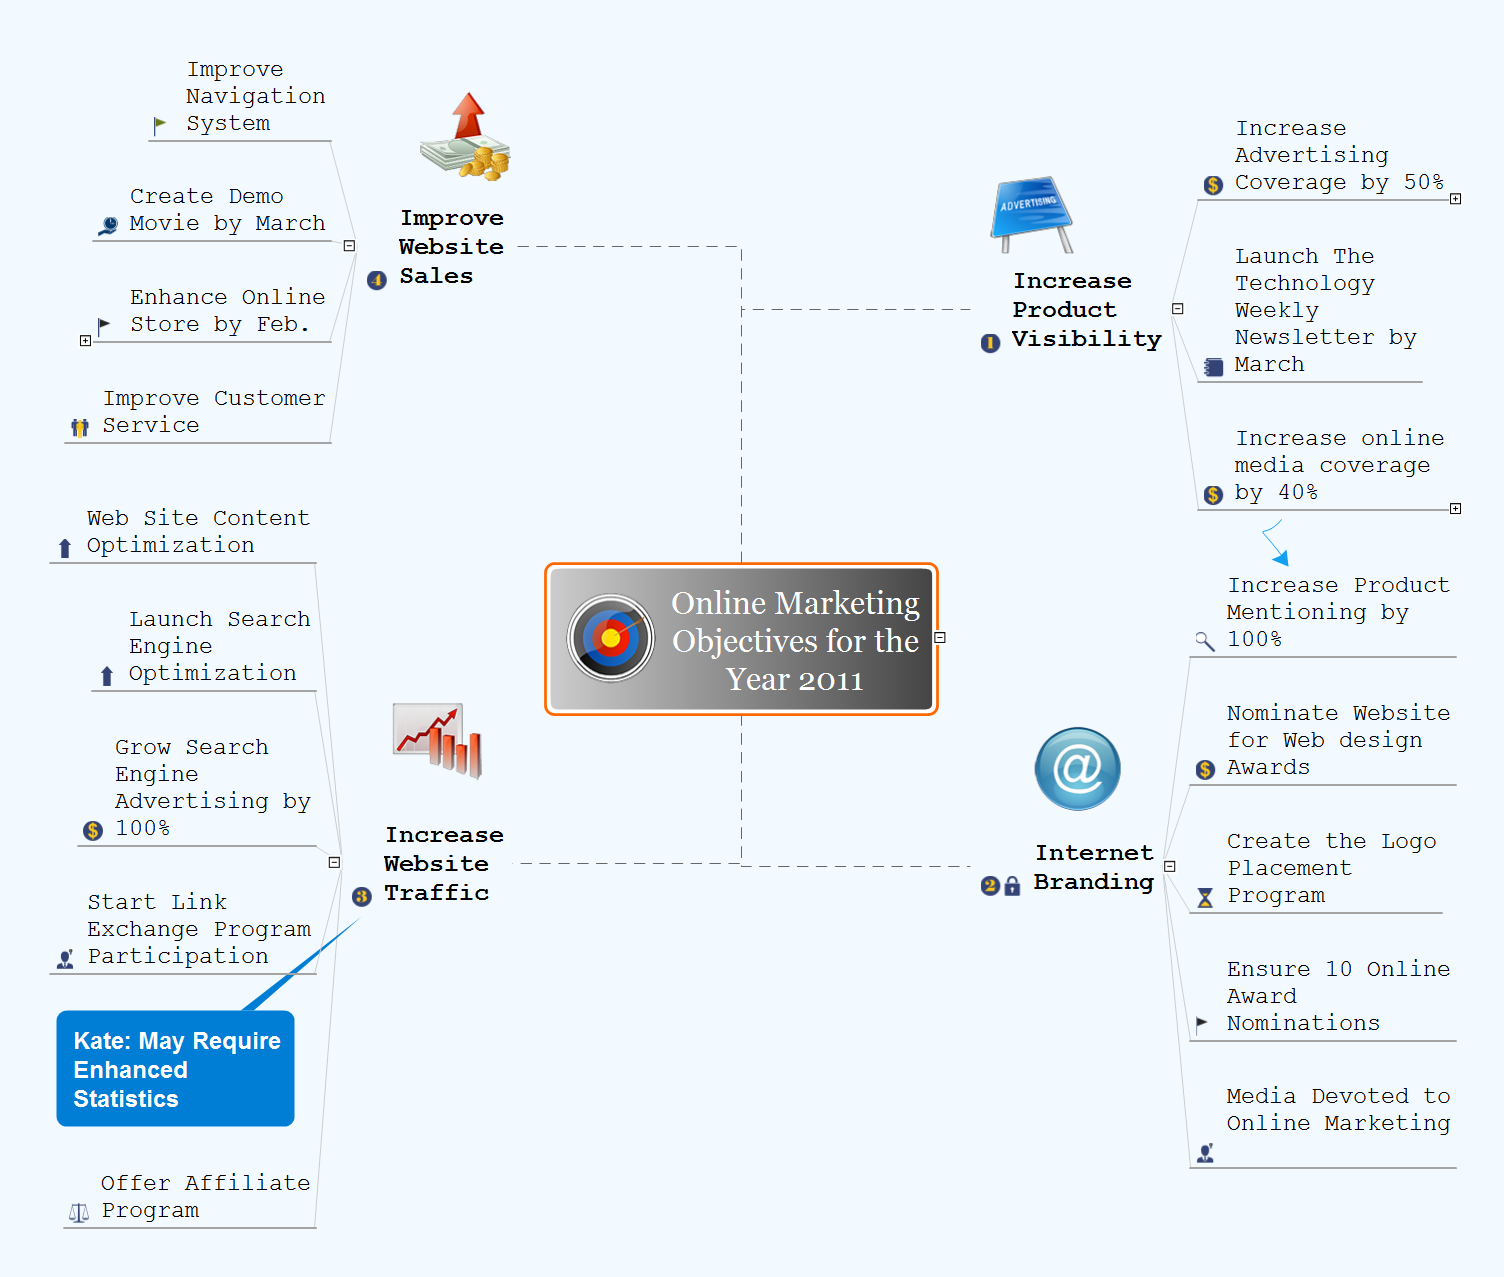
Picture: Online Marketing Objectives
Related Solution:
Many people who use mind mapping software for personal organizing find ConceptDraw MINDMAP sufficiently useful mind mapping tool in their business and daily life. Especially many positive responses receive ConceptDraw MINDMAP as cross platform tool to mind maps for Macintosh and Windows.
Picture: Think and act effectively
The power, economy, and versatility of ConceptDraw MINDMAP takes personnel and team productivity to another level. Discover today what this means to you.
Picture: Mind Map Making Software
Related Solution:
ConceptDraw DIAGRAM is new software for business and technical drawing. Powerful business drawing tools, extensive libraries with pre-drawn shapes, free samples of business drawings, technical drawings and flowcharts, support of many graphic formats enable users to visually develop their business drawings charts and diagrams in any combination of drawings, diagrams and flow charts.
Picture: ConceptDraw DIAGRAM The best Business Drawing Software
Related Solution:
ConceptDraw DIAGRAM - business process modeling software for mac offers the Business Process Diagram Solution with powerful tools to help you easy represent the business processes and create the business process diagrams based on BPMN 1.2 and BPMN 2.0 standards that allows to create of both simple and complex (nested) models of processes.
There are 16 BPMN 1.2 and BPMN 2.0 stencil libraries containing 230 vector objects: Rapid Draw library, Connections library, Gateways and Artifacts libraries, Data library, Gateways library, Choreographies library, Conversations library, Activities libraries, Events libraries, Expanded Objects libraries, Swim lanes libraries.
Picture: Business Process Modeling Software for Mac
Related Solution: