Quality Management Teams
Use the quality mind maps as a perfect addition to quality visualization in your quality management teams. Mind maps provide descriptive documents for daily work and keep all quality team members clearly informed about key points. With ConceptDraw MINDMAP and new Quality MindMap solution everyone can easily describe a quality process using a tree structure as well as show process relations, use visual symbols to improve understanding, and produce presentations.
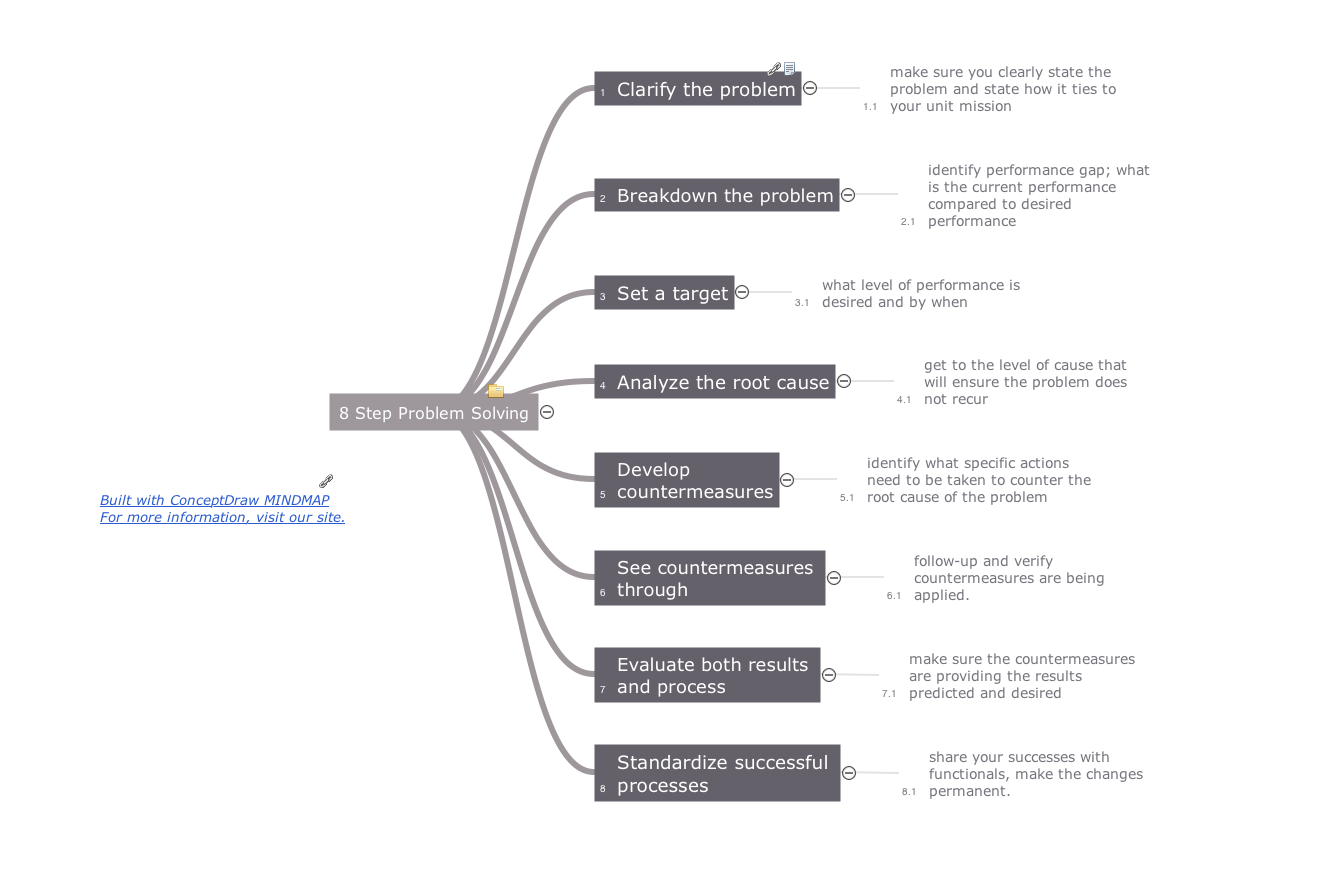
Pic.1 Quality mind map - 8 step problem solving.
This mind map sample was created in ConceptDraw MINDMAP with Quality mindmaps solution as a demonstration of the creative approach to quality management in daily work of quality management team.
See also Samples:
TEN RELATED HOW TO's:
ConceptDraw MINDMAP is a good way to describe visual instructions on any quality process.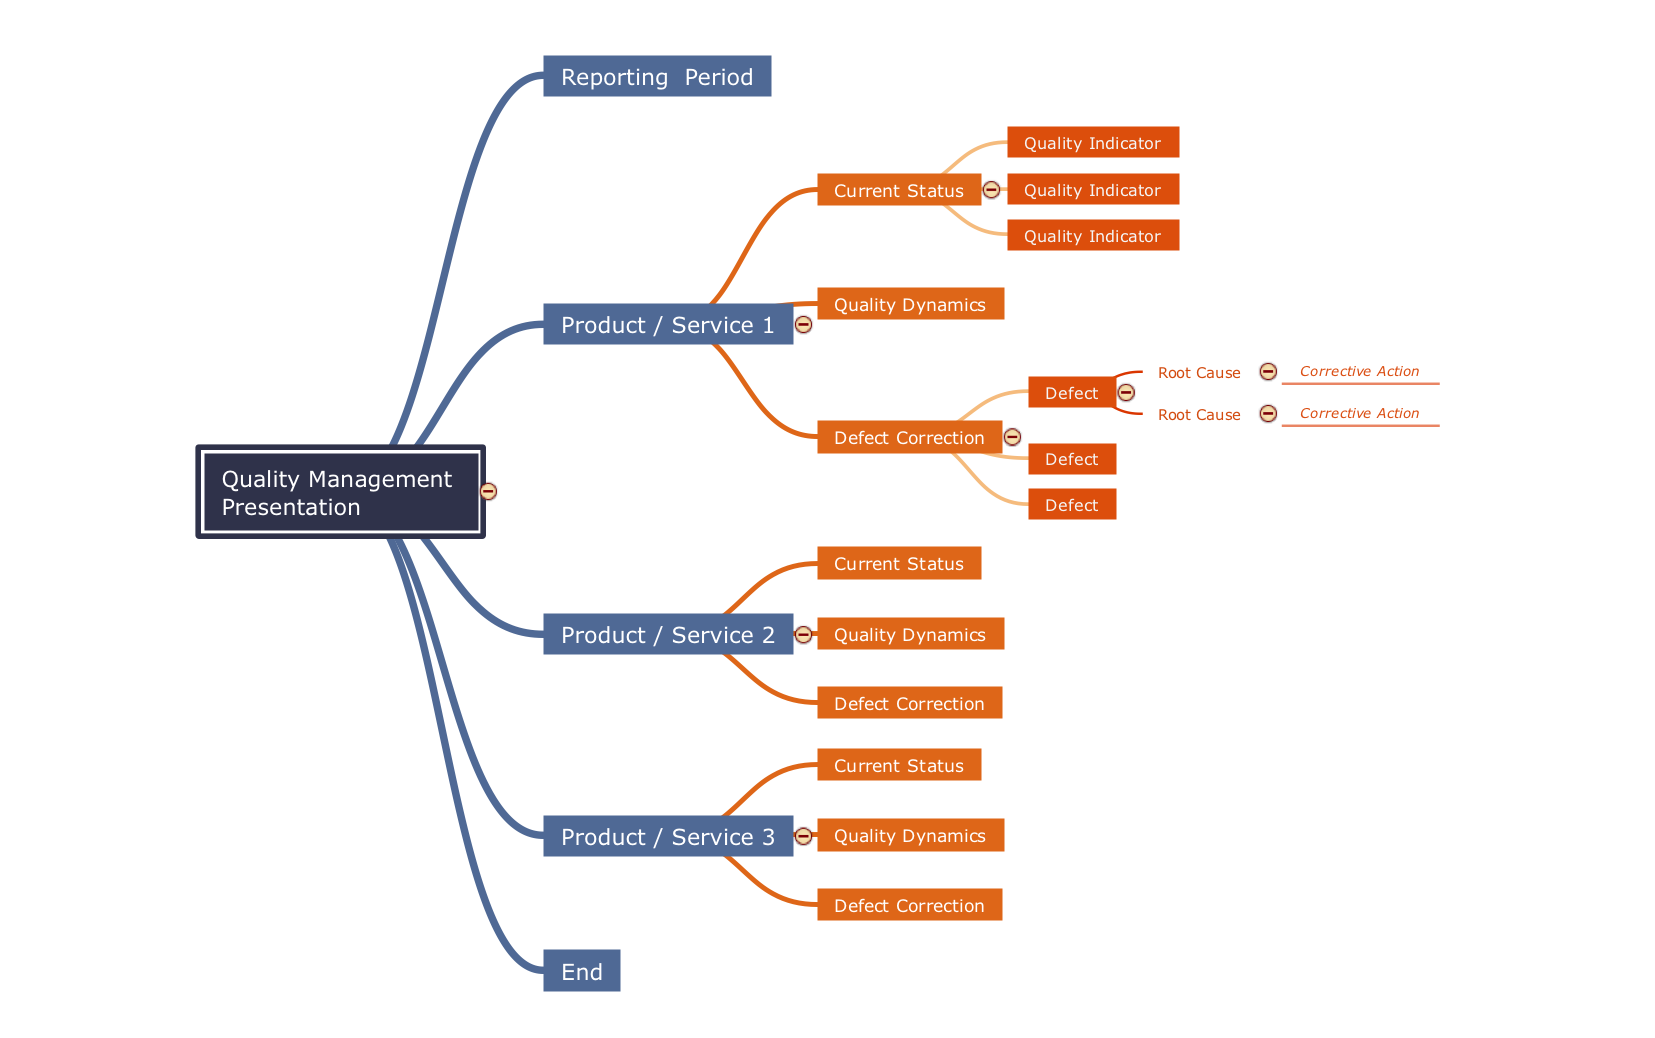
Picture: Mind Map - Quality Structure
Related Solution:
ConceptDraw gives the ability to draw Flowchart documents. Flowcharts solutionis a powerful tool that extends ConceptDraw application for drawing business flowcharts.
ConceptDraw DIAGRAM vector diagramming and business graphics software enhanced with with templates, green and interactive flowchart makers, samples and stencil libraries from ConceptDraw Solution Park which all focused to help with drawing flowcharts, block diagrams, bar charts, histograms, pie charts, divided bar diagrams, line graphs, area charts, scatter plots, circular arrows diagrams, Venn diagrams, bubble diagrams, concept maps, and others.
Picture: The Best Flowchart Software Available
Related Solution:
Samples, templates and libraries contain vector clip art for drawing the Road Transport Illustrations.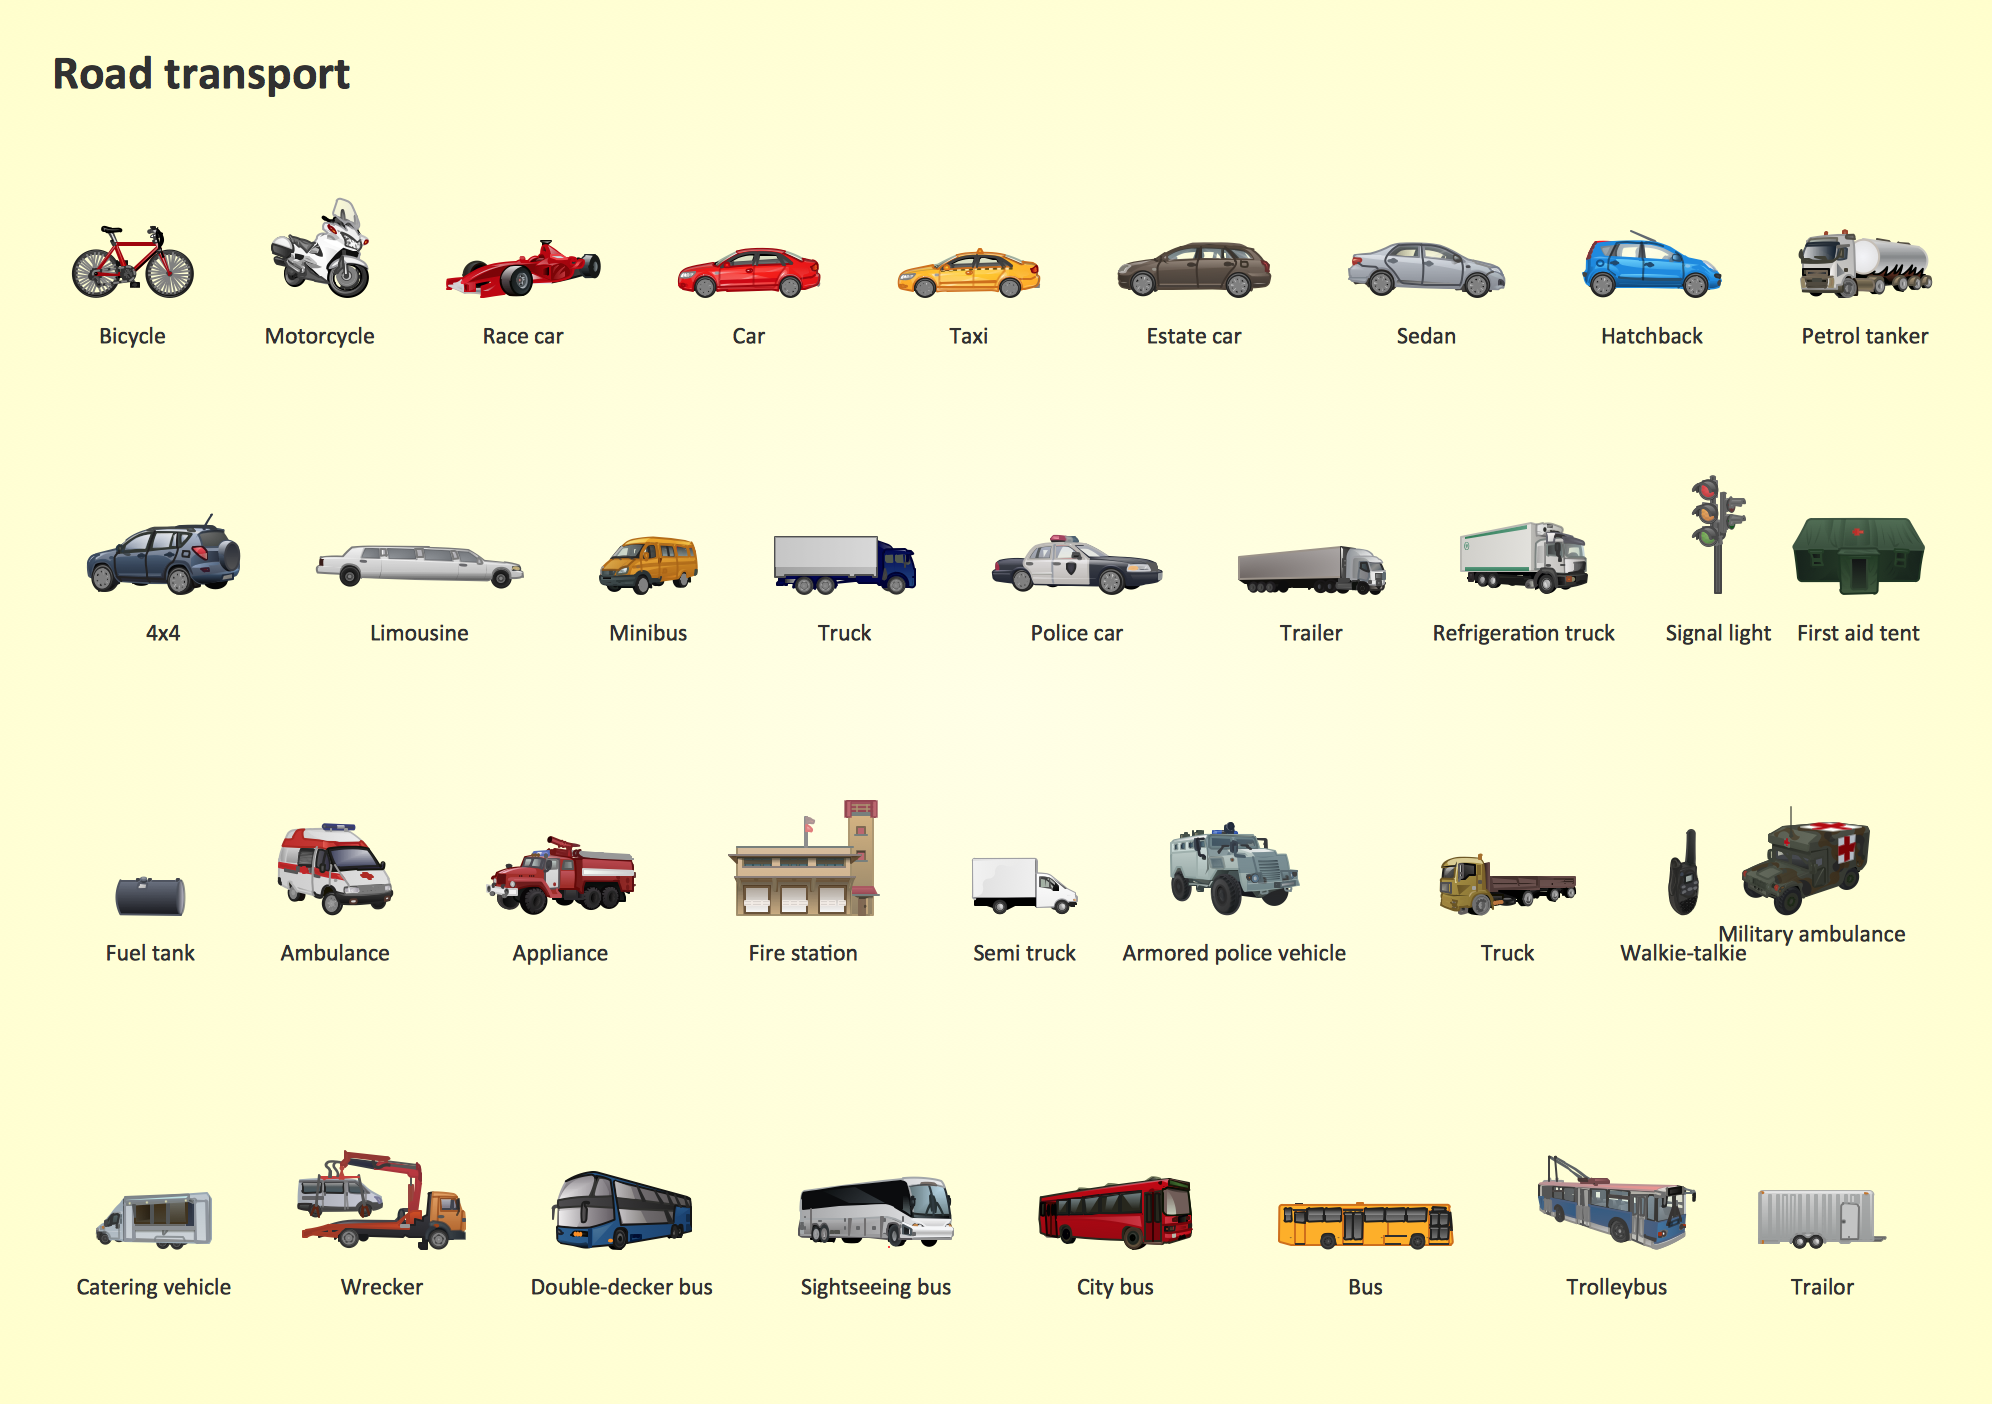
Picture: Road Transport - Design Elements
Related Solution:
Value Stream & Process Flow Diagramming Software is a very popular Lean Manufacturing tool that allows to see and visualize in details the company's processes and current state, the flow of material and information, and thus gives the possibility to analyze the efficiency of company's processes and then develop improved processes. Value stream maps are also a good way to define the steps that do not add value to the end product, in other words waste in a company's processes.
Picture: Value Stream & Process Flow Diagramming Software
Related Solution:
Analyze the root causes of factors that influence the problem. A diagram is constructed separately for each high priority factor. Identify the root causes for a factor and then propose possible corrective actions. The diagram displays the structure of causes for a factor and possible corrective actions. The Root Cause Analysis Tree Diagram is used for further formulation of actions.
Picture: Root Cause Tree Diagram
Related Solution:
Group Meeting via Skype - a guide on how to successfully hold a group meeting and presentation.
Picture: How To Successfully Hold a Group Meeting and Presentation
Related Solution:
Using Evernote with a Mind Map.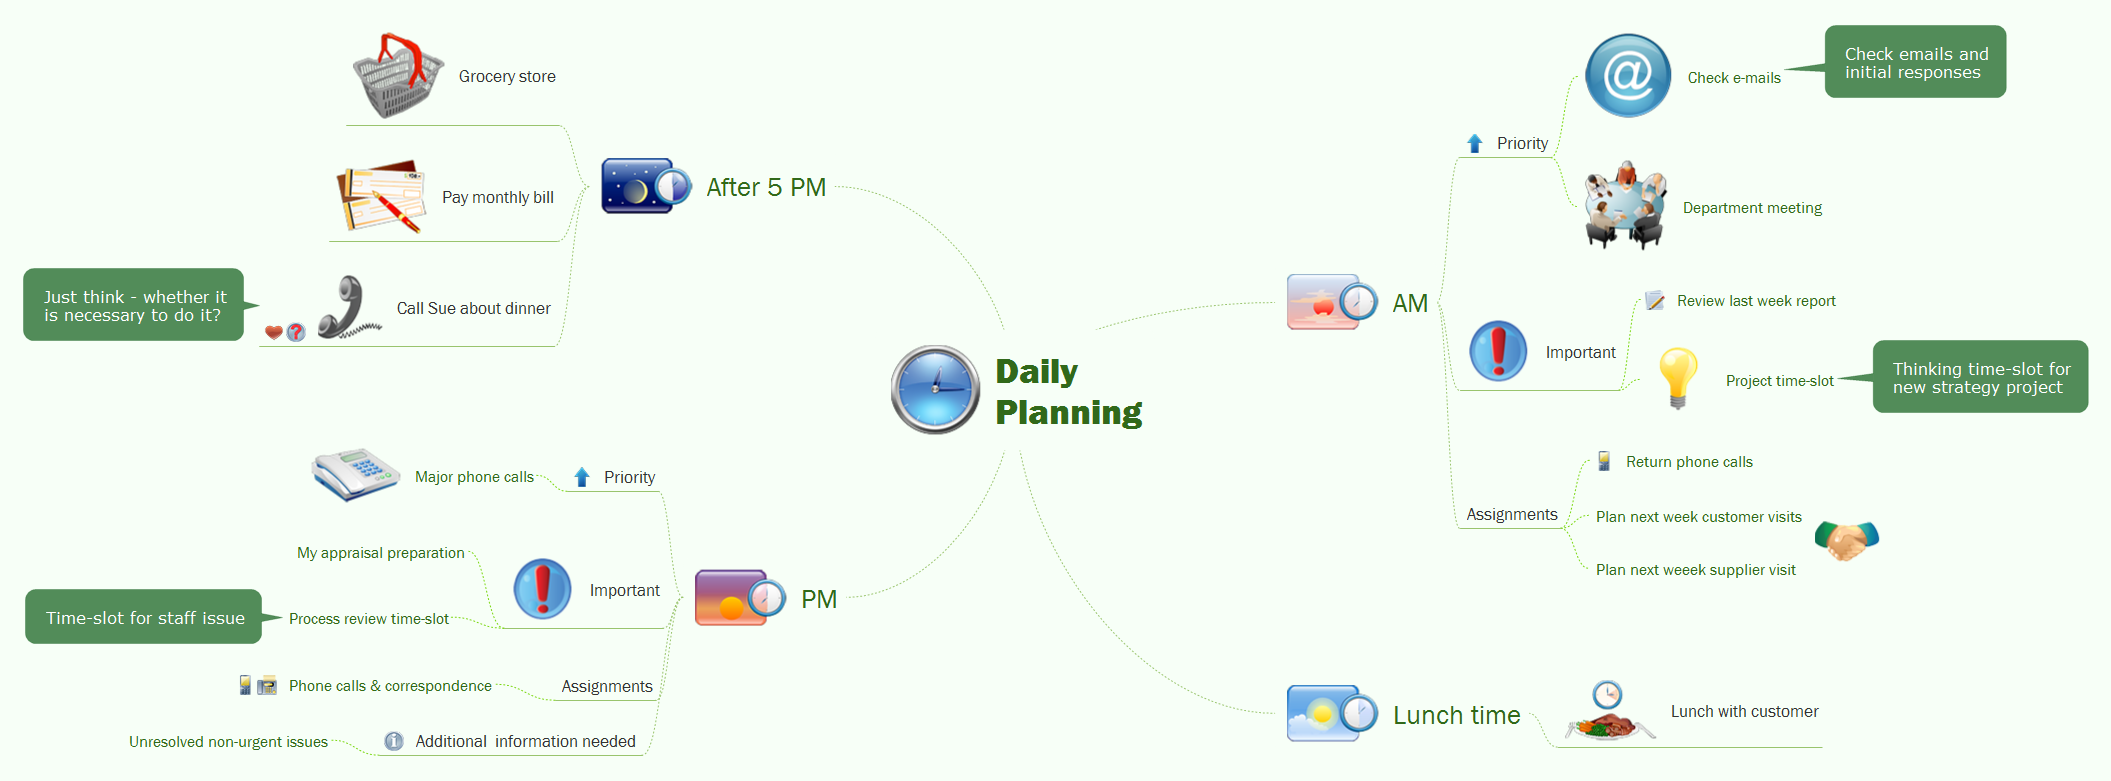
Picture: Note Taking Software
Related Solution:
ConceptDraw MINDMAP Mac OS X version enables you to export your mind map into the iCal calendar and generate tasks from mind map topics.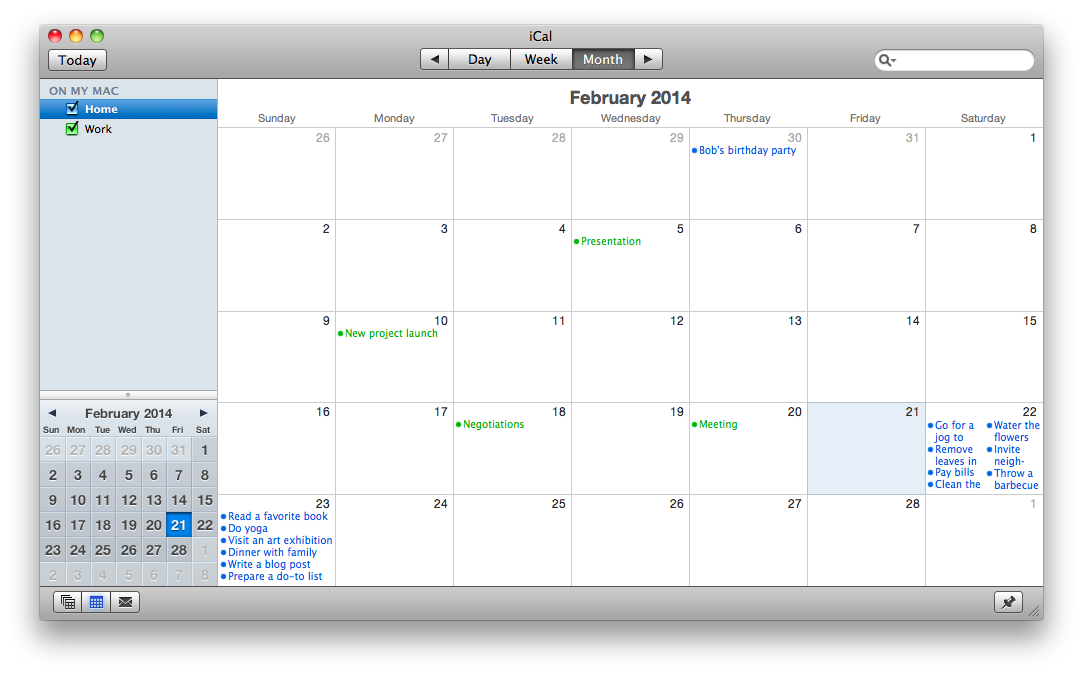
Picture: Export from ConceptDraw MINDMAP to Apple iCal
Related Solution:
ConceptDraw Note Exchange Solution permits users to develop and organize notes and tasks in ConceptDraw MINDMAP. Your work can be accessed later, just with one click, regardless of preferred platform.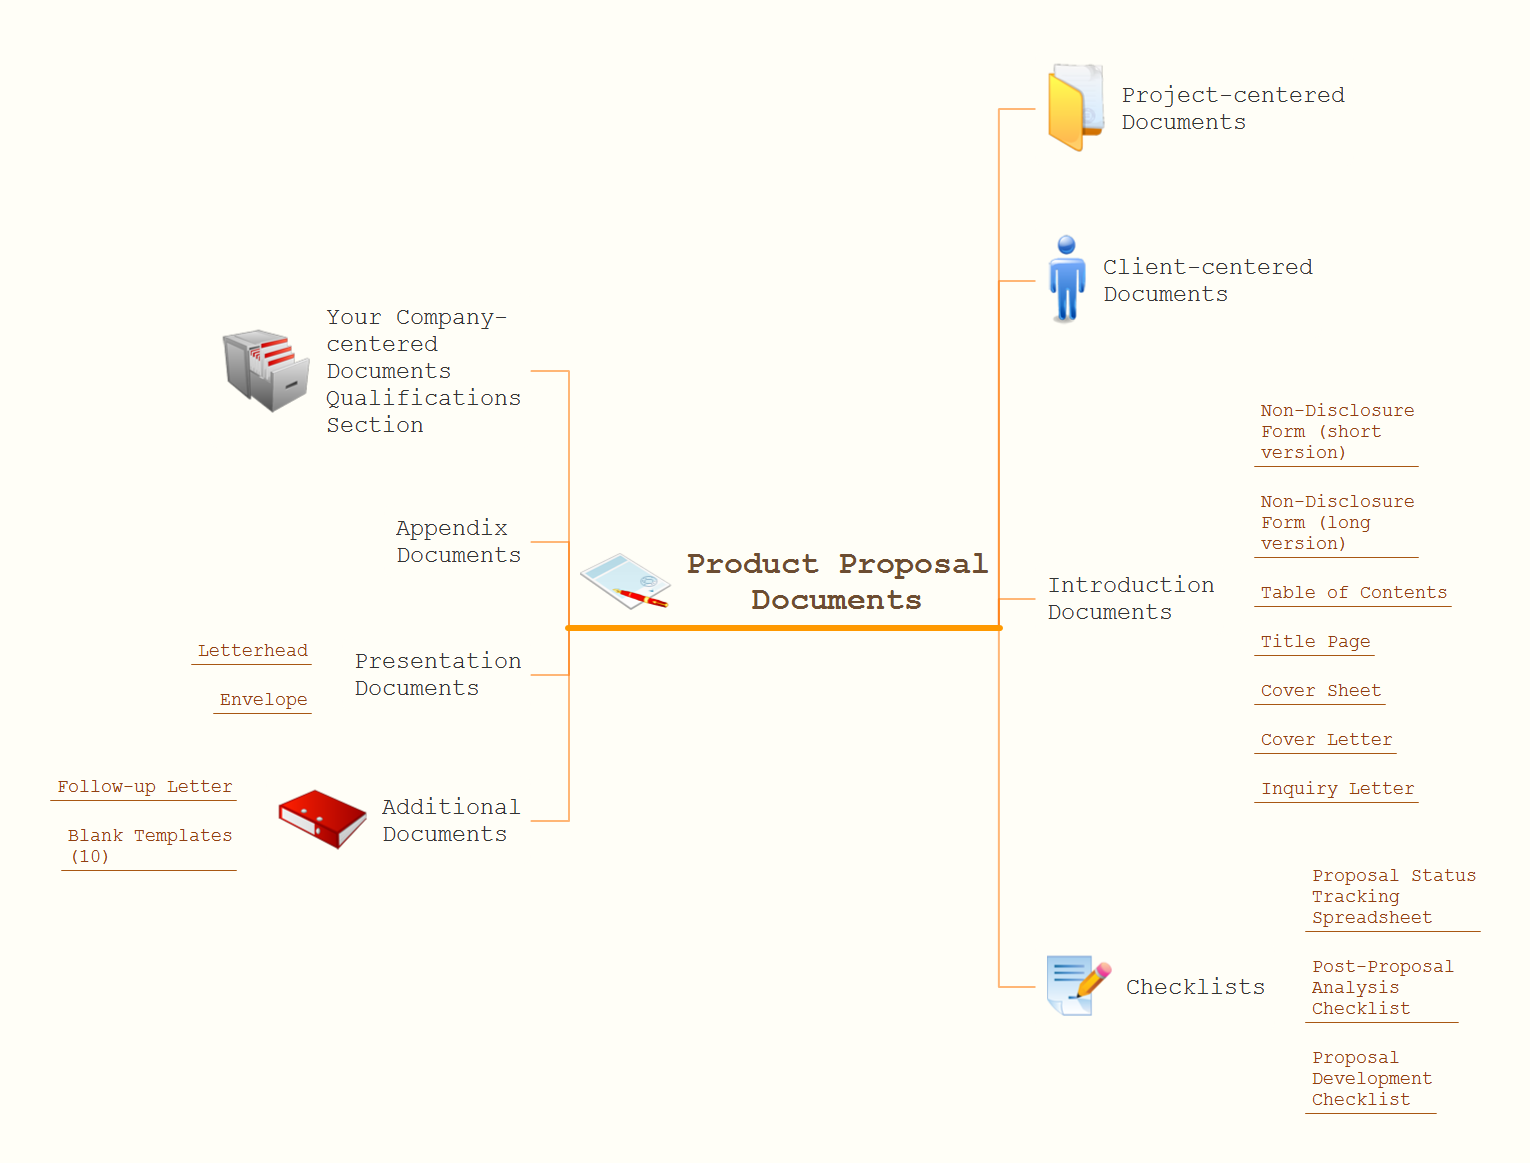
Picture: Detail Specifications Exchanging Mind Maps with Evernote
Related Solution:
When developing the Classroom Seating Chart it is necessary to take into account the characteristics of the taken premises. Each seating place must to be comfortable and each pupil must to see good the teacher and the chalkboard. Let's design the Classroom Seating Chart in ConceptDraw DIAGRAM software extended with School and Training Plans Solution from the Building Plans Area.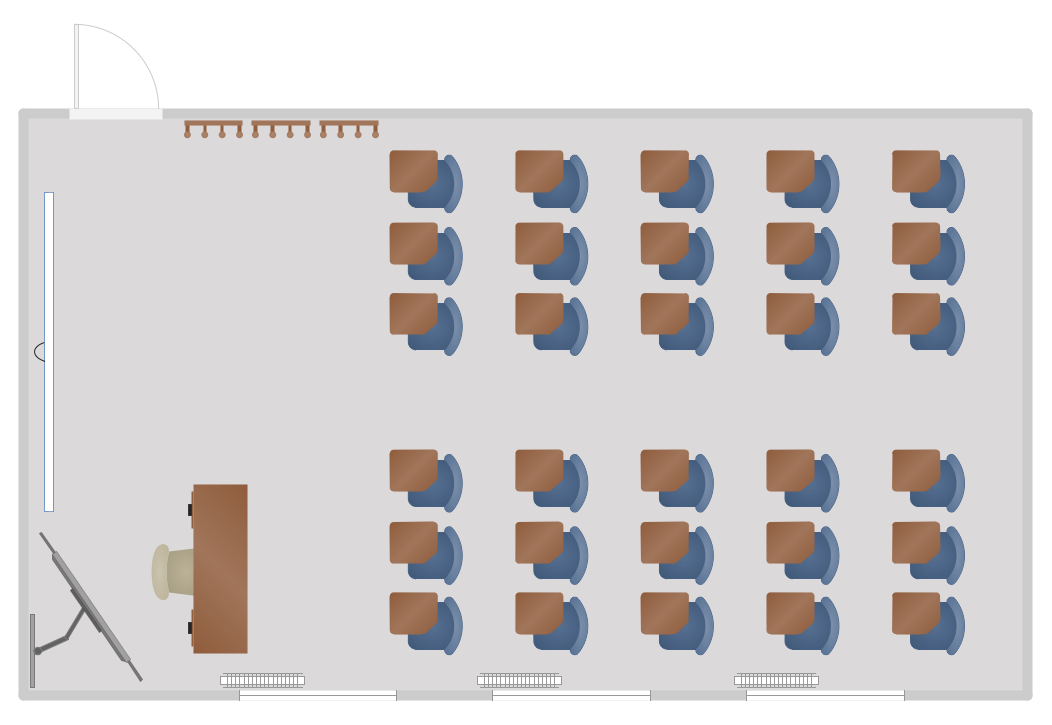
Picture: Classroom Seating Chart
Related Solution:
ConceptDraw
MINDMAP 16