EPC Diagrams Illustrate Business Process Work Flows
Event-driven Process Chain
The Event-driven Process Chain (EPC) Diagrams allows users present business process models in terms of work flows. The EPC diagram can shows various business processes.
ConceptDraw DIAGRAM includes tools that are specifically designed to facilitate the process of depicting business processes.
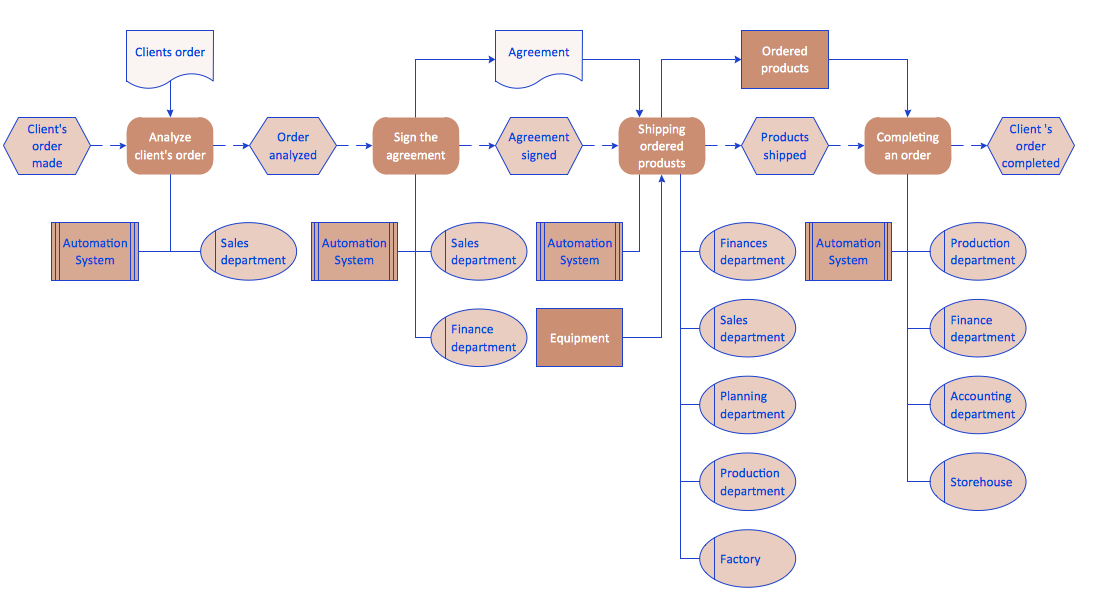
Pic.1 Order processing - EPC diagram.
The Event-driven Process Chain Diagrams solution extends ConceptDraw DIAGRAM software with EPC templates, samples, and vector shape library for the drawing of EPC business process work flows.
The Event-driven Chain Diagrams solution assists in the planning of resources and improves business processes using EPC workflows.
TEN RELATED HOW TO's:
Event-Driven Process Chain flowcharts for improvement throughout an organisation.
ConceptDraw DIAGRAM is a software for making EPC flowcharts to provide business process modelling. Its excellent business process improvement tools.
Picture: An Event-driven Process Chain (EPC) - flowchart used for business process modelling
Related Solution:
ConceptDraw DIAGRAM diagramming and vector drawing software offers the Event-driven Process Chain Diagrams EPC Solution from the Business Processes Area of ConceptDraw Solution Park with powerful drawing tools to help you draw the EPC diagram of any complexity quick and easy.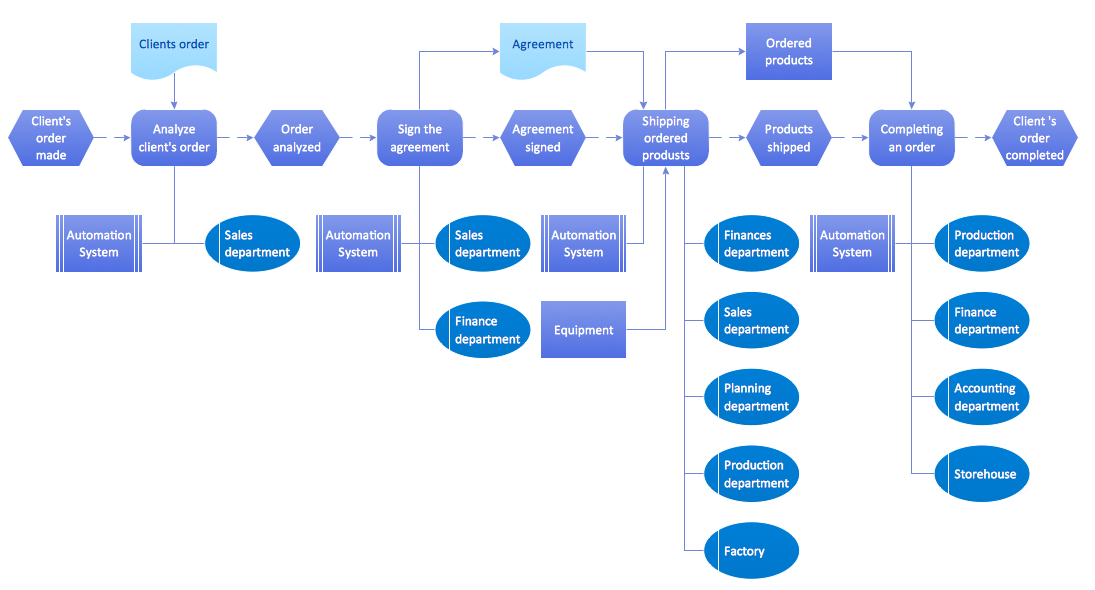
Picture: EPC Diagram
Related Solution:
A flowchart is a widely used type of diagram that visually represents an algorithm, workflow or process, using the boxes of various kinds to depict the steps and connecting them with arrows to show the order of execution these steps. Еhe ConceptDraw DIAGRAM supplied with Accounting Flowcharts Solution from the Finance and Accounting Area of ConceptDraw Solution Park is a powerful diagramming and vector drawing software which ideally suits for designing Ordering Process Flowchart of any complexity.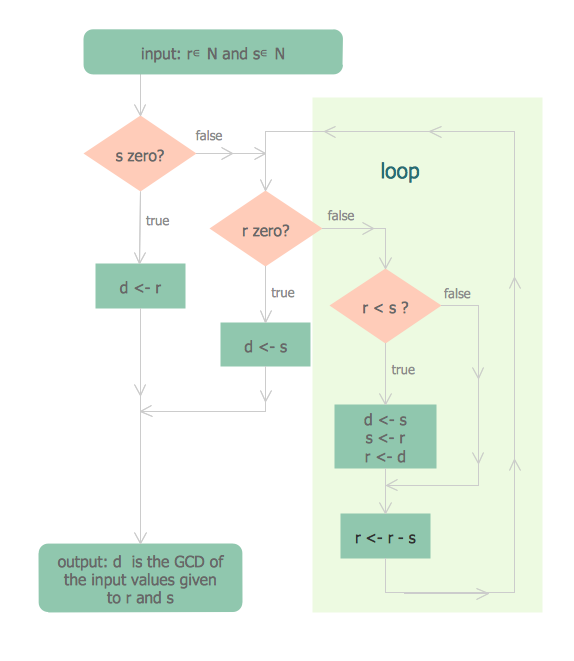
Picture: Ordering Process Flowchart. Flowchart Examples
Related Solution:
Create Quality Engineering Diagrams (value stream maps) - for value stream analysis and value stream management, material and information flow mapping, using our quick start templates included with ConceptDraw.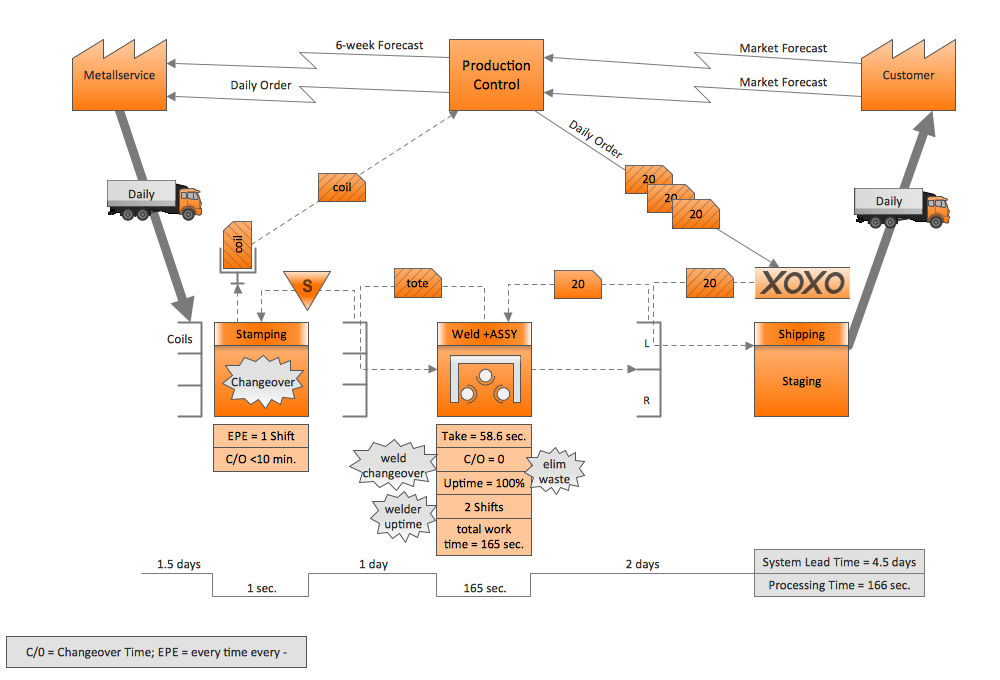
Picture: Quality Engineering Diagrams
Related Solution:
Users can create Value Stream Mapping Presentations using presentation mode in ConceptDraw DIAGRAM.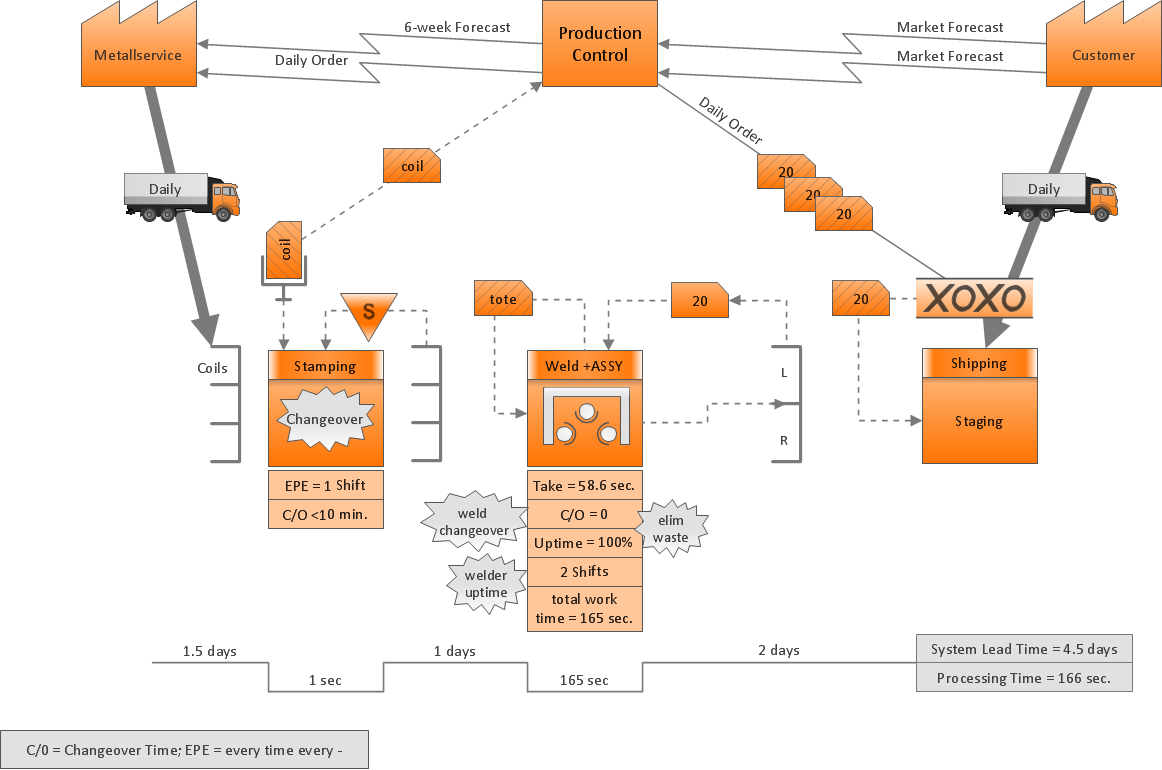
Picture: Value Stream Mapping Presentations
Related Solution:
Event-Driven Process chain Diagrams for improvement throughout an organisation.
ConceptDraw DIAGRAM - software that reduces the time needed to create a business process model.
Picture: Software for Drawing EPC Diagrams
Related Solution:
New Smart connectors in ConceptDraw DIAGRAM now have an auto-routing feature. This means that connectors always find the optimal route between objects and automatically recalculate that path when moving these objects.
You don't have to think about your connectors, they think for you.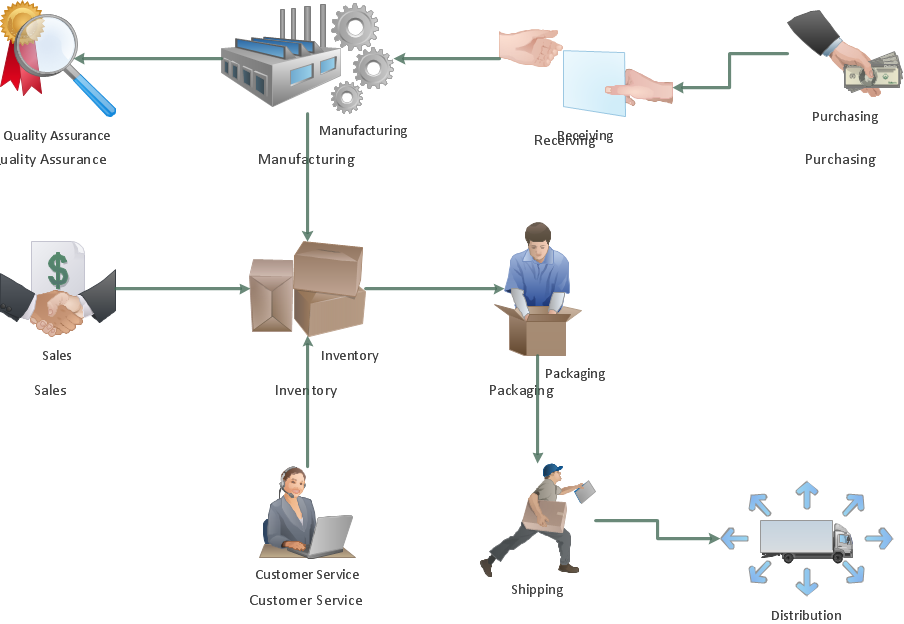
Picture: ConceptDraw Arrows10 Technology
One of the most popular option helps to draw diagrams faster is pre-designed set of examples related to each kind of diagram. ConceptDraw DIAGRAM software extended with the Workflow Diagrams solution delivers a complete set of workflow process examples helps you to start making your own workflow faster.
Picture: Workflow Process Example
Related Solution:
There are many ways to define the flow of information within a system. Structured-systems analysis method often uses data flow diagrams to show data flow, data storages and data processing visualization. These diagrams are easy to develop and quite useful.
Here is a dataflow diagram presenting an example of the manufacturing process flow. The oval process shapes represent a process that controls data within the current system. The process may produce data or make some action based on data. Data flows are represented by lines. They show the movement of information through the system. The direction of the data flow is depicted by the arrow. The external entities are shown by rectangles. They represent the external entities interacting with the system. The data store objects (unclosed rectangles) are used to show data bases participating in a process flow.
Picture: Data Flow Diagram
Related Solution:
ConceptDraw DIAGRAM diagramming and vector drawing software enhanced with powerful HR Flowcharts Solution perfectly suits for Human Resource Management.
Picture: Human Resource Management
Related Solution:
ConceptDraw
DIAGRAM 18