EPC - Business Processes in Terms of Work Flows
Event-driven Process Chain
The Event-driven Process Chain (EPC) Diagrams allows managers visually present business process models for they improvement. The EPC diagram shows various business processes in terms of work flows. ConceptDraw DIAGRAM includes tools that are specifically designed to facilitate the process of depicting business processes.

Pic.1 Design elements for EPC diagrams.
Stencil library EPC Diagram Shapes from Event-driven Process Chain Diagrams solution provides 23 vector design elements for drawing event-driven process chain diagrams.
Use design elements from the EPC Diagram Shapes library for drawing your EPC diagrams to plan resources and improve business processes.
TEN RELATED HOW TO's:
EPC or The Event - driven Process Chain diagrams that provide Enterprise Resource Planning improvement.
ConceptDraw DIAGRAM - software that reduces the time needed to create a business process model.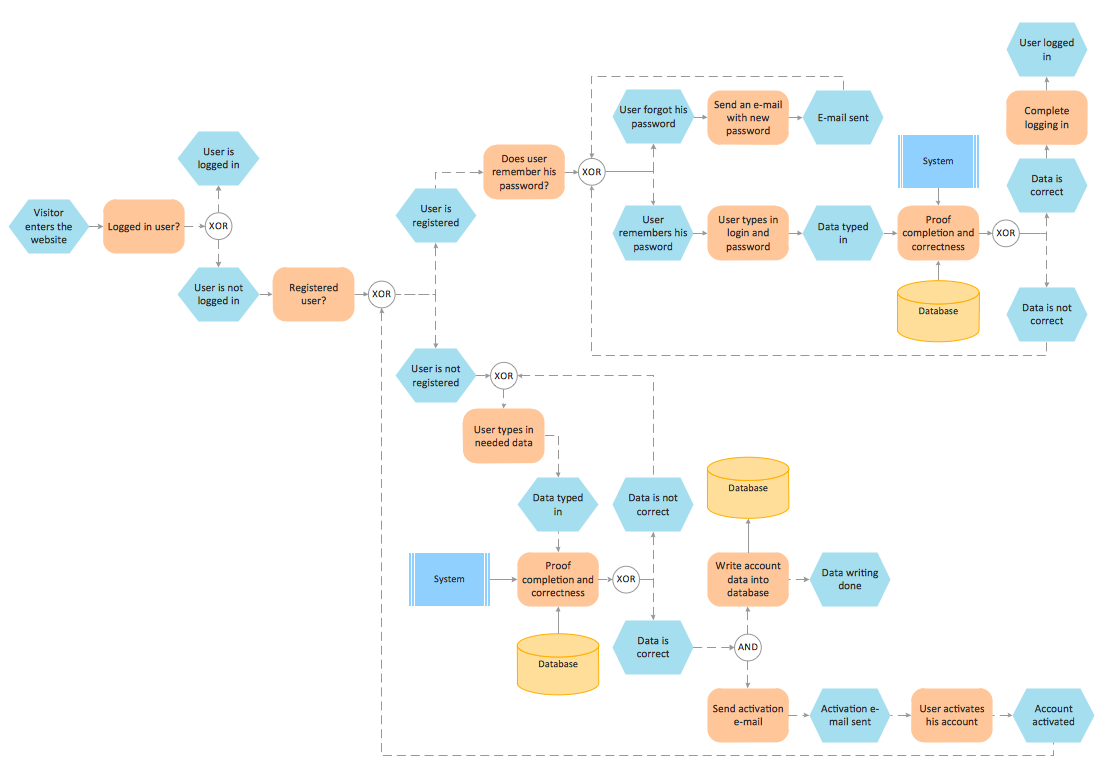
Picture: Formalization and Verification of Event-driven Process chain
Related Solution:
ConceptDraw Flowcharts visualize a process or algorithm of program as step/operation blocks of various shapes connected with arrowed lines showed the process flow direction. They are used to visualize business or technical processes and software algorithms.
Picture: Selecting & Creating Flowcharts
Related Solution:
ConceptDraw DIAGRAM diagramming and vector drawing software offers the Event-driven Process Chain Diagrams EPC Solution from the Business Processes Area of ConceptDraw Solution Park with powerful drawing tools to help you draw the EPC diagram of any complexity quick and easy.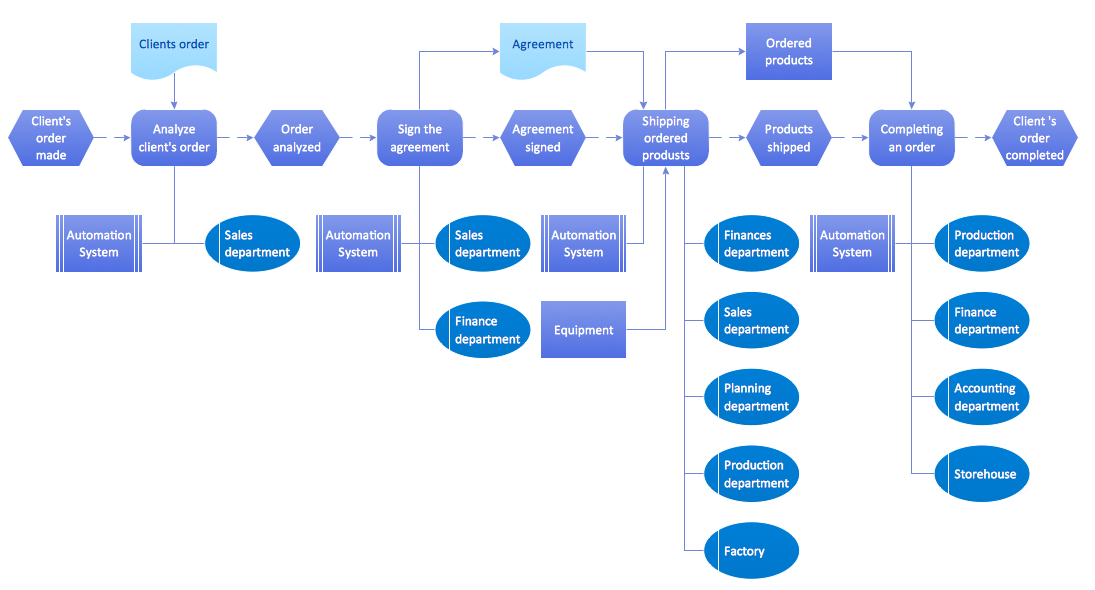
Picture: EPC Diagram
Related Solution:
A process flow diagram (PFD) is a diagram commonly used in chemical and process engineering to indicate the general flow of plant processes and equipment.
ConceptDraw DIAGRAM diagramming and vector drawing software extended with Flowcharts Solution from the Diagrams Area of ConceptDraw Solution Park offers the extensive drawing tools for quick and easy design professional looking Process Flow Diagrams.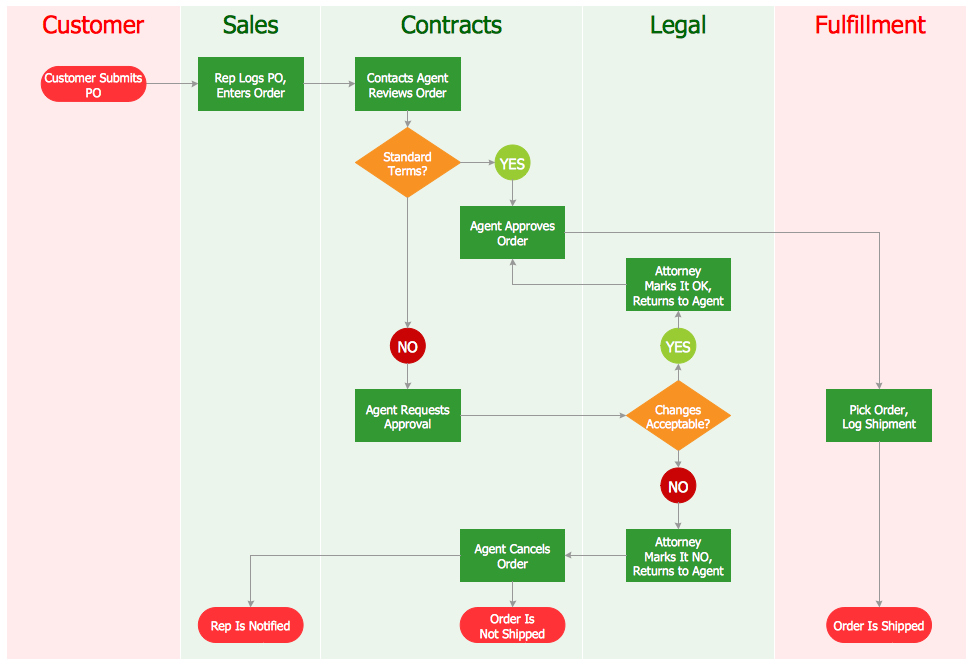
Picture: Process Flow Diagrams
Related Solution:
Many professionals have to solve problems every day. Designing of the process algorithm contribute to understand where the problem is in the process. A Flowchart is a graphical tool that most usable for breaking down processes.
Definition of flowchart - a diagram that shows step-by-step progression through a procedure or system especially using connecting lines and a set of conventional symbols.
All the icons, symbols and connectors needed for creating standardized notation flowcharts are contained within Software Flow Chart.
Picture: Software Flow Chart
Related Solution:
Workflow Diagram - workflow process diagram is a visual representation of a organizational process flow. Often it used as the same visual notation as process flow diagram. Visualising business processes using workflow diagram (workflow process diagram) allows estimate business process efficiency, analyse and optimize the process itself. Workflow diagram helps get focusing on each step and relations between workflow steps. ConceptDraw DIAGRAM is software for making workflow diagram. It contains specific designed graphics to draw workflow diagrams effectively. This is workflow diagram maker which do your work process effective.
Picture: Work Flow Process Chart
Related Solution:
For vector shapes and connector tools for quick and easy drawing diagrams for business, technology, science and education - The best choice for Diagramming is ConceptDraw DIAGRAM.
Picture: Diagram Software - The Best Choice for Diagramming
Is it possible to draw a diagram as quickly as the ideas come to you? The innovative ConceptDraw Arrows10 Technology included in ConceptDraw DIAGRAM is a simple and powerful tool to create any type of diagram.
You mau choose to start from one of plenty diagram templates or to use your own idea.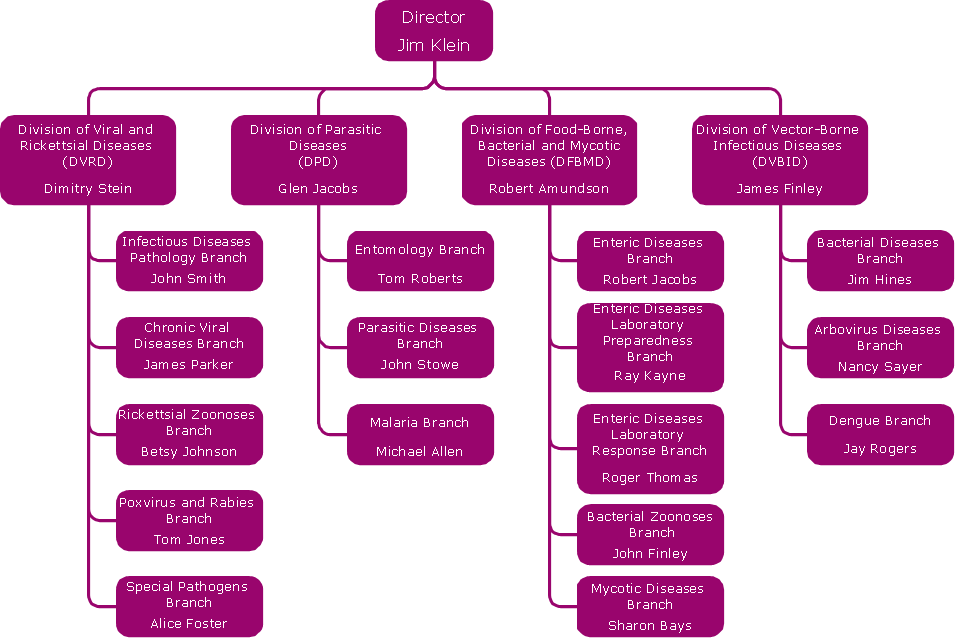
Picture: How To Draw a Diagram
The Total Quality Management Diagram solution helps you and your organization visualize business and industrial processes. Create Total Quality Management diagrams for business process with ConceptDraw software.
Picture: TQM Software — Build Professional TQM Diagrams
Related Solution:
The HR Management Software is an incredibly powerful tool for those who need to analyze or present human resource process flows in a visually effective manner.
Picture: HR Management Software
Related Solution:
ConceptDraw
DIAGRAM 18