Accounting Data Flow from the
Accounting Flowcharts Solution
The Accounting Flowchart visually describes the financial accounting process, shows the accumulated information about transactions and events for creating the balance sheet and the final income statement.
ConceptDraw DIAGRAM provides you the incredibly useful feature — ConceptDraw STORE that gives you the possibility to navigate through ConceptDraw Solution Park, manage downloads and updates, take the access to libraries, templates and samples directly from it.
For designing the Accounting Data Flow from the ConceptDraw STORE you can choose the Accounting Flowcharts Solution from the Finance and Accounting Area.

Sample 1. Accounting Data Flow from the Accounting Flowcharts Solution
Use the predesigned vector objects from the Accounting Flowcharts library creating the Accounting Data Flow from the Accounting Flowcharts Solution.

Sample 2. Accounting Flowcharts Library
To draw the professional looking colorful Accounting Data Flow from the ConceptDraw DIAGRAM quick and easy: simply drag the desired accounting flowchart shapes from the Accounting Flowcharts library into your document, type the title and text, add the colors. You will get the best results in minutes.

Sample 3. Design Elements Accounting Flowcharts
Accounting Flowcharts Solution contains also a wide variety of templates and samples that you can use as the base for your own Accounting Flowcharts of any complexity.

Sample 4. Accounting Data Flow
Use the Accounting Flowcharts Solution to create your own professional Accounting Flowcharts and Accounting Data Flow from the ConceptDraw DIAGRAM quick and easy.
The Accounting Flowcharts produced with ConceptDraw DIAGRAM are vector graphic documents and are available for reviewing, modifying, and converting to a variety of formats (image, HTML, PDF file, MS PowerPoint Presentation, Adobe Flash or MS Visio).
TEN RELATED HOW TO's:
This sample shows the Purchasing Flow Chart Diagram that displays the money flow in the carbon offset sphere. The carbon offsets are the compensatory measures that the companies make for the carbon emissions. You can see on this sample the groups that have interests in the carbon offsets and the money flow after the carbon offset vendors sold the carbon offsets.
Picture: Purchasing Flow Chart.Purchasing Flowchart Example
Related Solution:
The strategic balance is a combination of factors that can both positively and negatively affect the activity of the company. To know the factors that influence the organization success, managers should use SWOT matrix template that will define the potential inner strengths and weaknesses and potential external opportunities and threats. This matrix does not contain a ready solution, but allows to streamline all the available information.
This is a handy template of a SWOT matrix. It can serves as a visual guide for management students. To simplify the task, on the left and on the right we have added hints with examples of external and internal factors. This template one can found among numerous templates of SWOT and TOWS matrices that are included in the the eponymous solution by ConceptDraw Solution Park.
Picture: SWOT Matrix Template
Structured-systems analysis and design method uses data flow diagrams to represent the process of data flowing through a system. Talking about this might be useless without a proper example of DFD for online store (Data Flow Diagram). This DFD example shows all the distinctness that a diagram can bring into a scattered data structure.
Data flow diagrams are used to show how data is processed within some business processes. Making DFD is a common practice for business process modeling and analysis. This diagram represents the online store business flow. It describes inputs and outputs within online selling process and depicts the interactions between its participants. This DF diagram can be used by system analysts to create an overview of a business, to study and discover its inherent strengths and weak points.
Picture: Example of DFD for Online Store (Data Flow Diagram)
Related Solution:
ConceptDraw DIAGRAM is a software for producing flow charts. The software delivers built-in object libraries with vector stencils that allows you to use RapidDraw technology. By clicking on direction arrows one can add a new object to flowchart. Users can start drawing their own flowchart diagrams in fast and simple way.
Picture: Diagram Flow Chart
Related Solution:
Starting producing workflow diagram from template you save time and avoid the blank page syndrome. At first, the workflow template is set of rules for a workflow. The workflow symbols used in the specific case are part of workflow template. This is the subset of large standard collections of workflow symbols. The first part of workflow template is identification of symbols allowed in use in your specific case. The best way would be to collect them in your customized drawing collection of workflow symbols which used in your specific cases of workflow diagrams. Another way to create business process documents is using business process flow diagram which have similar purposes and have different visual notation.
ConceptDraw DIAGRAM is professional workflow diagram software with the rich extentions from ConceptDraw Solution Park. The basic solution for workflow diagramming is Workflow Diagrams Solution. It delivers a rich set of workflow diagram templates and samples help you draw diagrams e
Picture: Workflow Diagram Template
Related Solution:
Engineering students usually have huge amount of homework. Learning how to develop a technical drawing is one of the necessary skills. Luckily, at the present time, there’s no need to draw it on paper, because there a lot of software tools for it.
This drawing represents the Bearing symbols library, that is the part of the ConceptDraw Mechanical Engineering solution. Bearings are the important components of any movable mechanism. The function of bearing is to align, guide, and support the moving parts in any mechanical construction. Usually they are located between moving and stationary parts, it works as a connection point between them. Using Mechanical Engineering solution and ConceptDraw DIAGRAM one can effortlessly draw engineering diagrams of any complexity.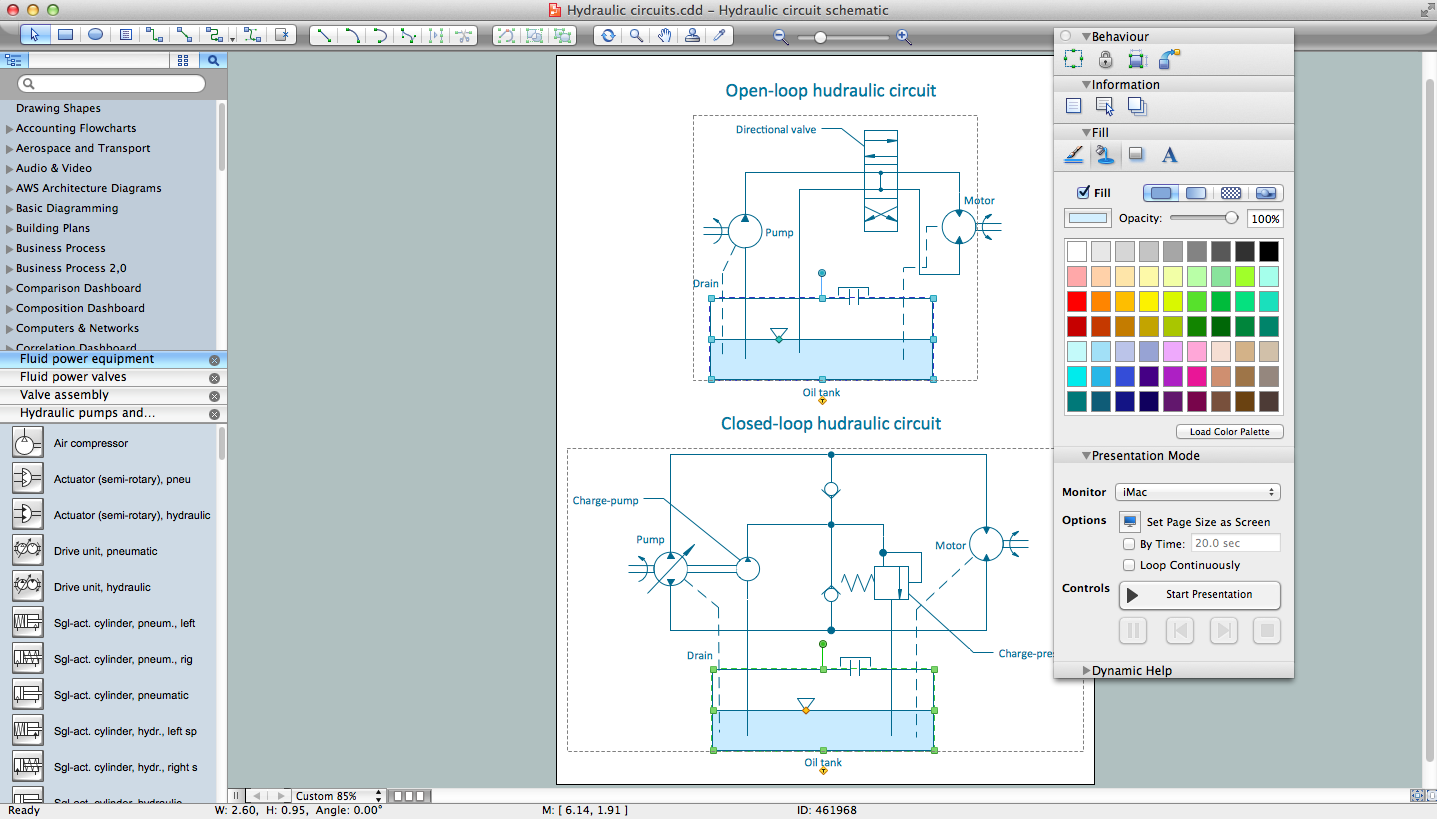
Picture: Technical Drawing Software
Related Solution:
ConceptDraw DIAGRAM diagramming and vector drawing software extended with Physics solution from the Science and Education area is a powerful software for creating various physics diagrams.
Physics solution provides all tools that you can need for physics diagrams designing. It includes 3 libraries with predesigned vector physics symbols: Optics Library, Mechanics Library and Nuclear Physics Library.
Picture: Physics Symbols
Related Solution:
Diagramming is an astonishing way to visualize business processes. The list of the most common business process flowchart symbols is quite long starting from basic flowcharts, continuing with SIPOC diagrams. Business process modeling was never easier than now, with special ConceptDraw Business Process Mapping solution.
To carry out all professional standard requirements for business processes mapping, it is necessarily to follow the special graphical notations. ConceptDraw Business Process Mapping solution offers an exhaustive suite of tools to aid business process mapping. There are three vector libraries SIPOC Diagrams, Business Process Flowcharts, and Swim Lanes that contains totally more than 50 symbols of standard BPM notations. This is all that professionals need to effectively evaluate and manage quality in business processes.
Picture: Business Process Flowchart Symbols
Related Solution:
There are plenty of diagramming tools, the question is to choose the most suitable for your needs. For example, you can choose ConceptDraw DIAGRAM as organizational chart software and get fascinating results in a few minutes. An orgchart is useful for any corporation.
This is an example of a hierarchical organization scheme of the company. It has tree-like structure. Each middle manager is subordinated to a few employees, and he is accountable to one of the top managers. Every type of organizational composition of businesses may be presented in the view of an organizational chart that is supported by ConceptDraw Organisational Charts solution. There are number of ways of building a structure of business organization, establishing how it should function.
Picture: ConceptDraw DIAGRAM - Organizational chart software
Related Solution:
Why to import PowerPoint slides into ConceptDraw MINDMAP ?
Picture: 3 Tips for a Killer Presentation
Related Solution:


