Account Flowchart Stockbridge SystemFlowchart Examples
ConceptDraw defines some flowchart types, divided into ten categories Every flowchart type has specific shapes and examples
A data processing system is a combination of people, machines, as well as the processes which produce a defined set of outputs out of a defined set of inputs. Both the outputs and the inputs can be interpreted as facts, data, information, etc. The definition depends on the interpreter's relation to the system and a common synonymous term is known to be an “information system”.
Any data processing system is known to be involving a combination of conversion for converting data to another format, a validation for making sure that the supplied data is correct, clear and useful, sorting for arranging the items in some particular sequence or in the different sets, summarization known to be simply reducing the detail data to its main points, aggregation, which is simply combining the multiple pieces of data, analysis (the organization after the collection and interpretation as well as the presentation of data) and reporting, which is a process of listing the details or the summary of data in a way of the computed information sometimes.
There are many types of data processing systems exist, such as those defined by the application area, the scientific data processing, which is a process involving a computation being simply the comparison as well as the arithmetic operations, upon a small amount of the so called “input data”. As a result, there is a small volume of output left in the very end. The so called “commercial data processing” is the one involving a large volume of input data, a large volume of output and a few computational operations.
“Data analysis” is the one of the methods used for describing the facts, detecting the patterns, developing explanations, as well as testing the hypotheses. It is used for analysing the sales and the data from the customers upon receiving the result of the surveys they’ve been through for identifying the connections between the different products allowing the so called “cross selling campaigns”. There are systems defined by the service type, the so called “transaction processing systems”. There are also the information storage and the retrieval systems, the control and command systems, the computing service systems, the process control systems and the message switching systems.
One of the most commonly used examples of a data processing system is the process of maintaining a check register when the transactions which are simply checks and deposits are recorded upon uprising, as well as the transactions being summarized for determining an existing balance. There are also so called “deposits by source” exist as well as the “checks by type”, such as the ones used within the charitable organizations’ activities. Such information is used for obtaining the information, such as the total of all contributions within one year. It is well-known that a system, in which all the transactions are being recorded on a consistent basis, as well as the same method of the so called “bank re-conciliation” is used each time.
Transaction processing is known to be distinct from all the other computer processing models, such as batch processing, real-time processing and time-sharing. The batch processing is simply an execution of a series of programs, which are known to be also called as the “jobs”, on a computer without using any manual intervention. A few transactions are called a “batch”. Such batch is known to be collected as well as processed at the very same time, resulting in each transaction having not an immediate result, available while the transaction is being entered, having a time delay.
But there are so called “real time systems” where an appropriate response to a stimulus can be always guaranteed as well as the request quick enough for affecting the conditions caused the stimulus itself. Each of the transactions in the real-time processing is known to be unique, being not a part of a group of any different transactions. A Transaction Processing System is basically a system, which is known to be collecting, modifying, retrieving and storing any data transactions of any enterprise. Transaction processing, instead of allowing some user to be able to run the so called “arbitrary programs”, allows the predefined as well as the structured transactions. Each of such transactions is basically a short duration, having its processing activity for each of the transactions programmed in advance.
Once you decide to create a flowchart mentioning all the processes happening within any needed system to be described, you can always use a very useful and unique as well as professionally developed software — ConceptDraw DIAGRAM Such application allows its users to make any needed flowchart, including the account one mentioning all the processes taking place within a particular system going into as many details as it is needed, using the previously created graphical objects as well as the pre-made examples of all the mostly and widely used flowcharts. Some of the existing solutions from ConceptDraw STORE contains more than one template enabling all the ConceptDraw DIAGRAM users to have such examples as their own drafts which can be always edited in order to end up having an amazing result — a professionally made chart, flowchart, diagram, any needed map, scheme, plan as well as other drawings, depending on what field of the business activity you are involved in.

Example 1. Cross-Functional Flowcharts Solution
Thus, one of the solutions provided by the IT specialists of CS Odessa is the “Cross-Functional Flowcharts”, offering 45 graphical shapes as well as the pre-made and ready-to-use samples of the flowcharts, such as Cross-Functional ones. Having ConceptDraw DIAGRAM as well as the mentioned solution which can be downloaded from ConceptDraw STORE (and ConceptDraw STORE application can itself be downloaded from this site, as well as a ConceptDraw DIAGRAM one) means having an opportunity to make any needed flowchart, including the Cross-Functional one, mentioning all the needed data as well as its circulation within a particular system, such as a Stockbridge one.

Example 2. Stockbridge system flowchart example
"This is a flowchart of a data processing system combining manual and computerized processing to handle accounts receivable, billing, and general ledger."
[Data processing system. Wikipedia]
TEN RELATED HOW TO's:Connecting objects manually in ConceptDraw DIAGRAM is a snap:
- points;
- Connecting groups of objects;
- Auto-routing;
- Connectors text;
- Snap to Guides ;
- Quick. Picture: ConceptDraw Arrows10 Technology The Process Flowchart or Process Flowchart Diagram (PFD) is a visual representation relations between major parts of the system, the steps in a process, and even connections between various systems. The possibility to easy create professional-looking and attractive Process Flowcharts, Business Process Diagrams and Maps which visualize the steps of complex processes is provided by Business Process Diagram Solution from the Business Processes Area of ConceptDraw Solution Park and 16 libraries with 230 process flowchart symbols from BPMN 1.2 and BPMN 2.0.
 Picture: Process Flowchart SymbolsRelated Solution: What is Purchasing Process and How to Meet The Standards. Common key elements of purchasing process representation.
 Picture: Why is it important to have a formal purchasing process?Related Solution: This sample was created in ConceptDraw DIAGRAM diagramming and vector drawing software using the Flowcharts solution from the Diagrams area of ConceptDraw Solution Park.
This sample shows the Flowchart that displays the procedures of 2PP (two-party preferred) voting and counting the voters. The two-party-preferred vote is the result of the elections that was distributed to the final two parties.
Picture: Why is it important to have a formal purchasing process?Related Solution: This sample was created in ConceptDraw DIAGRAM diagramming and vector drawing software using the Flowcharts solution from the Diagrams area of ConceptDraw Solution Park.
This sample shows the Flowchart that displays the procedures of 2PP (two-party preferred) voting and counting the voters. The two-party-preferred vote is the result of the elections that was distributed to the final two parties. Picture: Basic Flowchart Images. Flowchart ExamplesRelated Solution: Everything about Bookkeeping: Accounting flowchart process. Which symbols to use, how to make a chart.
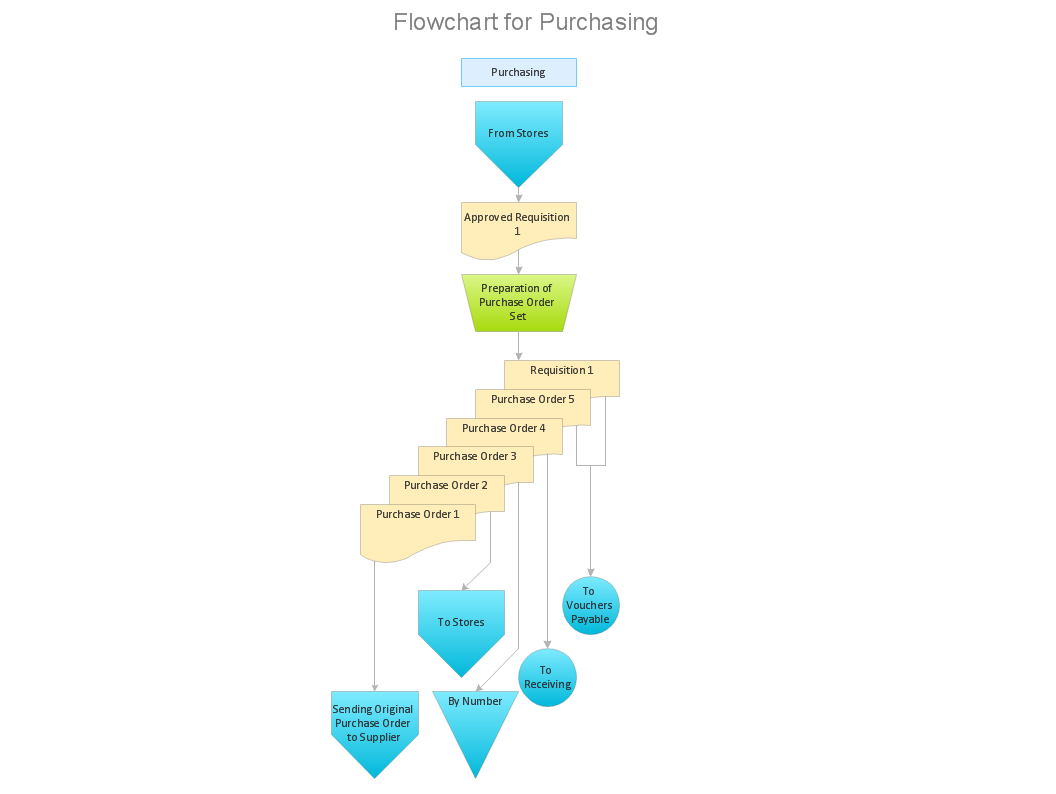 Picture: Introduction to bookkeeping: Accounting flowchart processRelated Solution: Create your own flow charts of purchasing business processes using the ConceptDraw DIAGRAM software
 Picture: Purchasing Flowchart - Purchase OrderFlowchart ExamplesRelated Solution: The excellent possibility to create attractive Cross Functional Flowcharts for step-by-step visualization the operations of a business process flow of any degree of detailing is offered by ConceptDraw’s Cross-Functional Flowcharts solution. The extensive selection of commonly used vector cross functional flowchart symbols allow you to demonstrate the document flow in organization, to represent each team member’s responsibilities and how processes get shared or transferred between different teams and departments.
 Picture: Cross Functional Flowchart SymbolsRelated Solution: Is it possible to develop a diagram as quickly as the ideas come to you? The innovative ConceptDraw Arrows10 Technology included in ConceptDraw DIAGRAM is a powerful drawing tool that changes the way diagrams are produced.
While making the drawing process easier and faster.
Picture: Cross Functional Flowchart SymbolsRelated Solution: Is it possible to develop a diagram as quickly as the ideas come to you? The innovative ConceptDraw Arrows10 Technology included in ConceptDraw DIAGRAM is a powerful drawing tool that changes the way diagrams are produced.
While making the drawing process easier and faster. Picture: How to draw a Cross-Functional FlowchartRelated Solution: Job duties in small companies are usually spread randomly among workers, causing lots of problems and misunderstanding. One of the ways to restore order in business processing is to create a cross-functional flowchart with swim lanes that would represent every step in production system. Another advantage of using swim lanes flowchart is that it represents not only processes, but people responsible for them.
Swim lane diagram is a kind of a process flow diagram. Its special feature is that it joins the features of process flow diagrams with organizational charts. Thus, a swim lane diagram display a participant of the business process in a conjunction with general flow of the business system. A swim lane diagram is looks similar to a swimming pool's lanes. Lanes can be horizontal and vertical. The lanes are pointed out relatively to resource name, which is assigned on implementation of the given part of the business process. ConceptDraw Business Process Mapping solution delivers the ability to design develop swim lanes flowcharts using the vector graphic objects of Swim Lanes library.
Picture: How to draw a Cross-Functional FlowchartRelated Solution: Job duties in small companies are usually spread randomly among workers, causing lots of problems and misunderstanding. One of the ways to restore order in business processing is to create a cross-functional flowchart with swim lanes that would represent every step in production system. Another advantage of using swim lanes flowchart is that it represents not only processes, but people responsible for them.
Swim lane diagram is a kind of a process flow diagram. Its special feature is that it joins the features of process flow diagrams with organizational charts. Thus, a swim lane diagram display a participant of the business process in a conjunction with general flow of the business system. A swim lane diagram is looks similar to a swimming pool's lanes. Lanes can be horizontal and vertical. The lanes are pointed out relatively to resource name, which is assigned on implementation of the given part of the business process. ConceptDraw Business Process Mapping solution delivers the ability to design develop swim lanes flowcharts using the vector graphic objects of Swim Lanes library. Picture: Swim Lane DiagramsRelated Solution: Sometimes it's difficult to find a path in work processes or to understand the requirements, especially when you are a newcomer. To get your thoughts straight, create a workflow diagram, and put everything on it. This will not only help you to get into the workflow, but also show it’s weaknesses.
This illustration captures the workflow process of payment an invoice for the electricity consumed by certain enterprise. It was drawn in ConceptDraw DIAGRAM using its solution for Workflow Diagrams. Making a workflow charts means that you need to depict consistently all processes engaged to the workflow process. Then, you should connect them with symbols meaning study and analysis. Next, add symbols of decisions. A work flow diagram made precisely and correctly can help to clarify your work flow to any person.
Picture: Swim Lane DiagramsRelated Solution: Sometimes it's difficult to find a path in work processes or to understand the requirements, especially when you are a newcomer. To get your thoughts straight, create a workflow diagram, and put everything on it. This will not only help you to get into the workflow, but also show it’s weaknesses.
This illustration captures the workflow process of payment an invoice for the electricity consumed by certain enterprise. It was drawn in ConceptDraw DIAGRAM using its solution for Workflow Diagrams. Making a workflow charts means that you need to depict consistently all processes engaged to the workflow process. Then, you should connect them with symbols meaning study and analysis. Next, add symbols of decisions. A work flow diagram made precisely and correctly can help to clarify your work flow to any person. Picture: Workflow DiagramRelated Solution:
ConceptDraw DIAGRAM 18
Picture: Workflow DiagramRelated Solution:
ConceptDraw DIAGRAM 18
A data processing system is a combination of people, machines, as well as the processes which produce a defined set of outputs out of a defined set of inputs. Both the outputs and the inputs can be interpreted as facts, data, information, etc. The definition depends on the interpreter's relation to the system and a common synonymous term is known to be an “information system”.
Any data processing system is known to be involving a combination of conversion for converting data to another format, a validation for making sure that the supplied data is correct, clear and useful, sorting for arranging the items in some particular sequence or in the different sets, summarization known to be simply reducing the detail data to its main points, aggregation, which is simply combining the multiple pieces of data, analysis (the organization after the collection and interpretation as well as the presentation of data) and reporting, which is a process of listing the details or the summary of data in a way of the computed information sometimes.
There are many types of data processing systems exist, such as those defined by the application area, the scientific data processing, which is a process involving a computation being simply the comparison as well as the arithmetic operations, upon a small amount of the so called “input data”. As a result, there is a small volume of output left in the very end. The so called “commercial data processing” is the one involving a large volume of input data, a large volume of output and a few computational operations.
“Data analysis” is the one of the methods used for describing the facts, detecting the patterns, developing explanations, as well as testing the hypotheses. It is used for analysing the sales and the data from the customers upon receiving the result of the surveys they’ve been through for identifying the connections between the different products allowing the so called “cross selling campaigns”. There are systems defined by the service type, the so called “transaction processing systems”. There are also the information storage and the retrieval systems, the control and command systems, the computing service systems, the process control systems and the message switching systems.
One of the most commonly used examples of a data processing system is the process of maintaining a check register when the transactions which are simply checks and deposits are recorded upon uprising, as well as the transactions being summarized for determining an existing balance. There are also so called “deposits by source” exist as well as the “checks by type”, such as the ones used within the charitable organizations’ activities. Such information is used for obtaining the information, such as the total of all contributions within one year. It is well-known that a system, in which all the transactions are being recorded on a consistent basis, as well as the same method of the so called “bank re-conciliation” is used each time.
Transaction processing is known to be distinct from all the other computer processing models, such as batch processing, real-time processing and time-sharing. The batch processing is simply an execution of a series of programs, which are known to be also called as the “jobs”, on a computer without using any manual intervention. A few transactions are called a “batch”. Such batch is known to be collected as well as processed at the very same time, resulting in each transaction having not an immediate result, available while the transaction is being entered, having a time delay.
But there are so called “real time systems” where an appropriate response to a stimulus can be always guaranteed as well as the request quick enough for affecting the conditions caused the stimulus itself. Each of the transactions in the real-time processing is known to be unique, being not a part of a group of any different transactions. A Transaction Processing System is basically a system, which is known to be collecting, modifying, retrieving and storing any data transactions of any enterprise. Transaction processing, instead of allowing some user to be able to run the so called “arbitrary programs”, allows the predefined as well as the structured transactions. Each of such transactions is basically a short duration, having its processing activity for each of the transactions programmed in advance.
Once you decide to create a flowchart mentioning all the processes happening within any needed system to be described, you can always use a very useful and unique as well as professionally developed software — ConceptDraw DIAGRAM Such application allows its users to make any needed flowchart, including the account one mentioning all the processes taking place within a particular system going into as many details as it is needed, using the previously created graphical objects as well as the pre-made examples of all the mostly and widely used flowcharts. Some of the existing solutions from ConceptDraw STORE contains more than one template enabling all the ConceptDraw DIAGRAM users to have such examples as their own drafts which can be always edited in order to end up having an amazing result — a professionally made chart, flowchart, diagram, any needed map, scheme, plan as well as other drawings, depending on what field of the business activity you are involved in.

Example 1. Cross-Functional Flowcharts Solution
Thus, one of the solutions provided by the IT specialists of CS Odessa is the “Cross-Functional Flowcharts”, offering 45 graphical shapes as well as the pre-made and ready-to-use samples of the flowcharts, such as Cross-Functional ones. Having ConceptDraw DIAGRAM as well as the mentioned solution which can be downloaded from ConceptDraw STORE (and ConceptDraw STORE application can itself be downloaded from this site, as well as a ConceptDraw DIAGRAM one) means having an opportunity to make any needed flowchart, including the Cross-Functional one, mentioning all the needed data as well as its circulation within a particular system, such as a Stockbridge one.
Example 2. Stockbridge system flowchart example
"This is a flowchart of a data processing system combining manual and computerized processing to handle accounts receivable, billing, and general ledger." [Data processing system. Wikipedia]