UML Collaboration Diagram (UML2.0)
How To draw UML Collaboration Diagrams
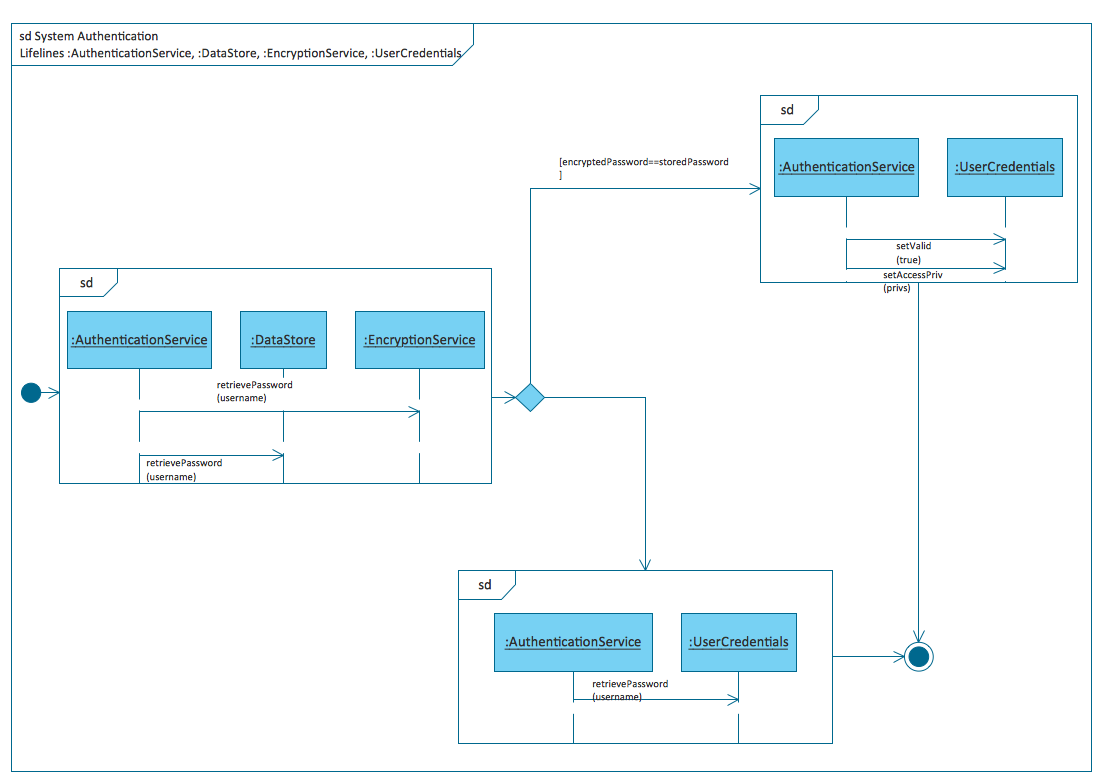
UML Collaboration Diagram depicts the interactions between objects or parts in terms of sequenced messages and describes both the static structure and dynamic behavior of a system. ConceptDraw has four examples that will help you to start using software for drawing UML Collaboration Diagrams. You can also use the appropriate stencils of UML notation to draw your own UML Collaboration Diagram.

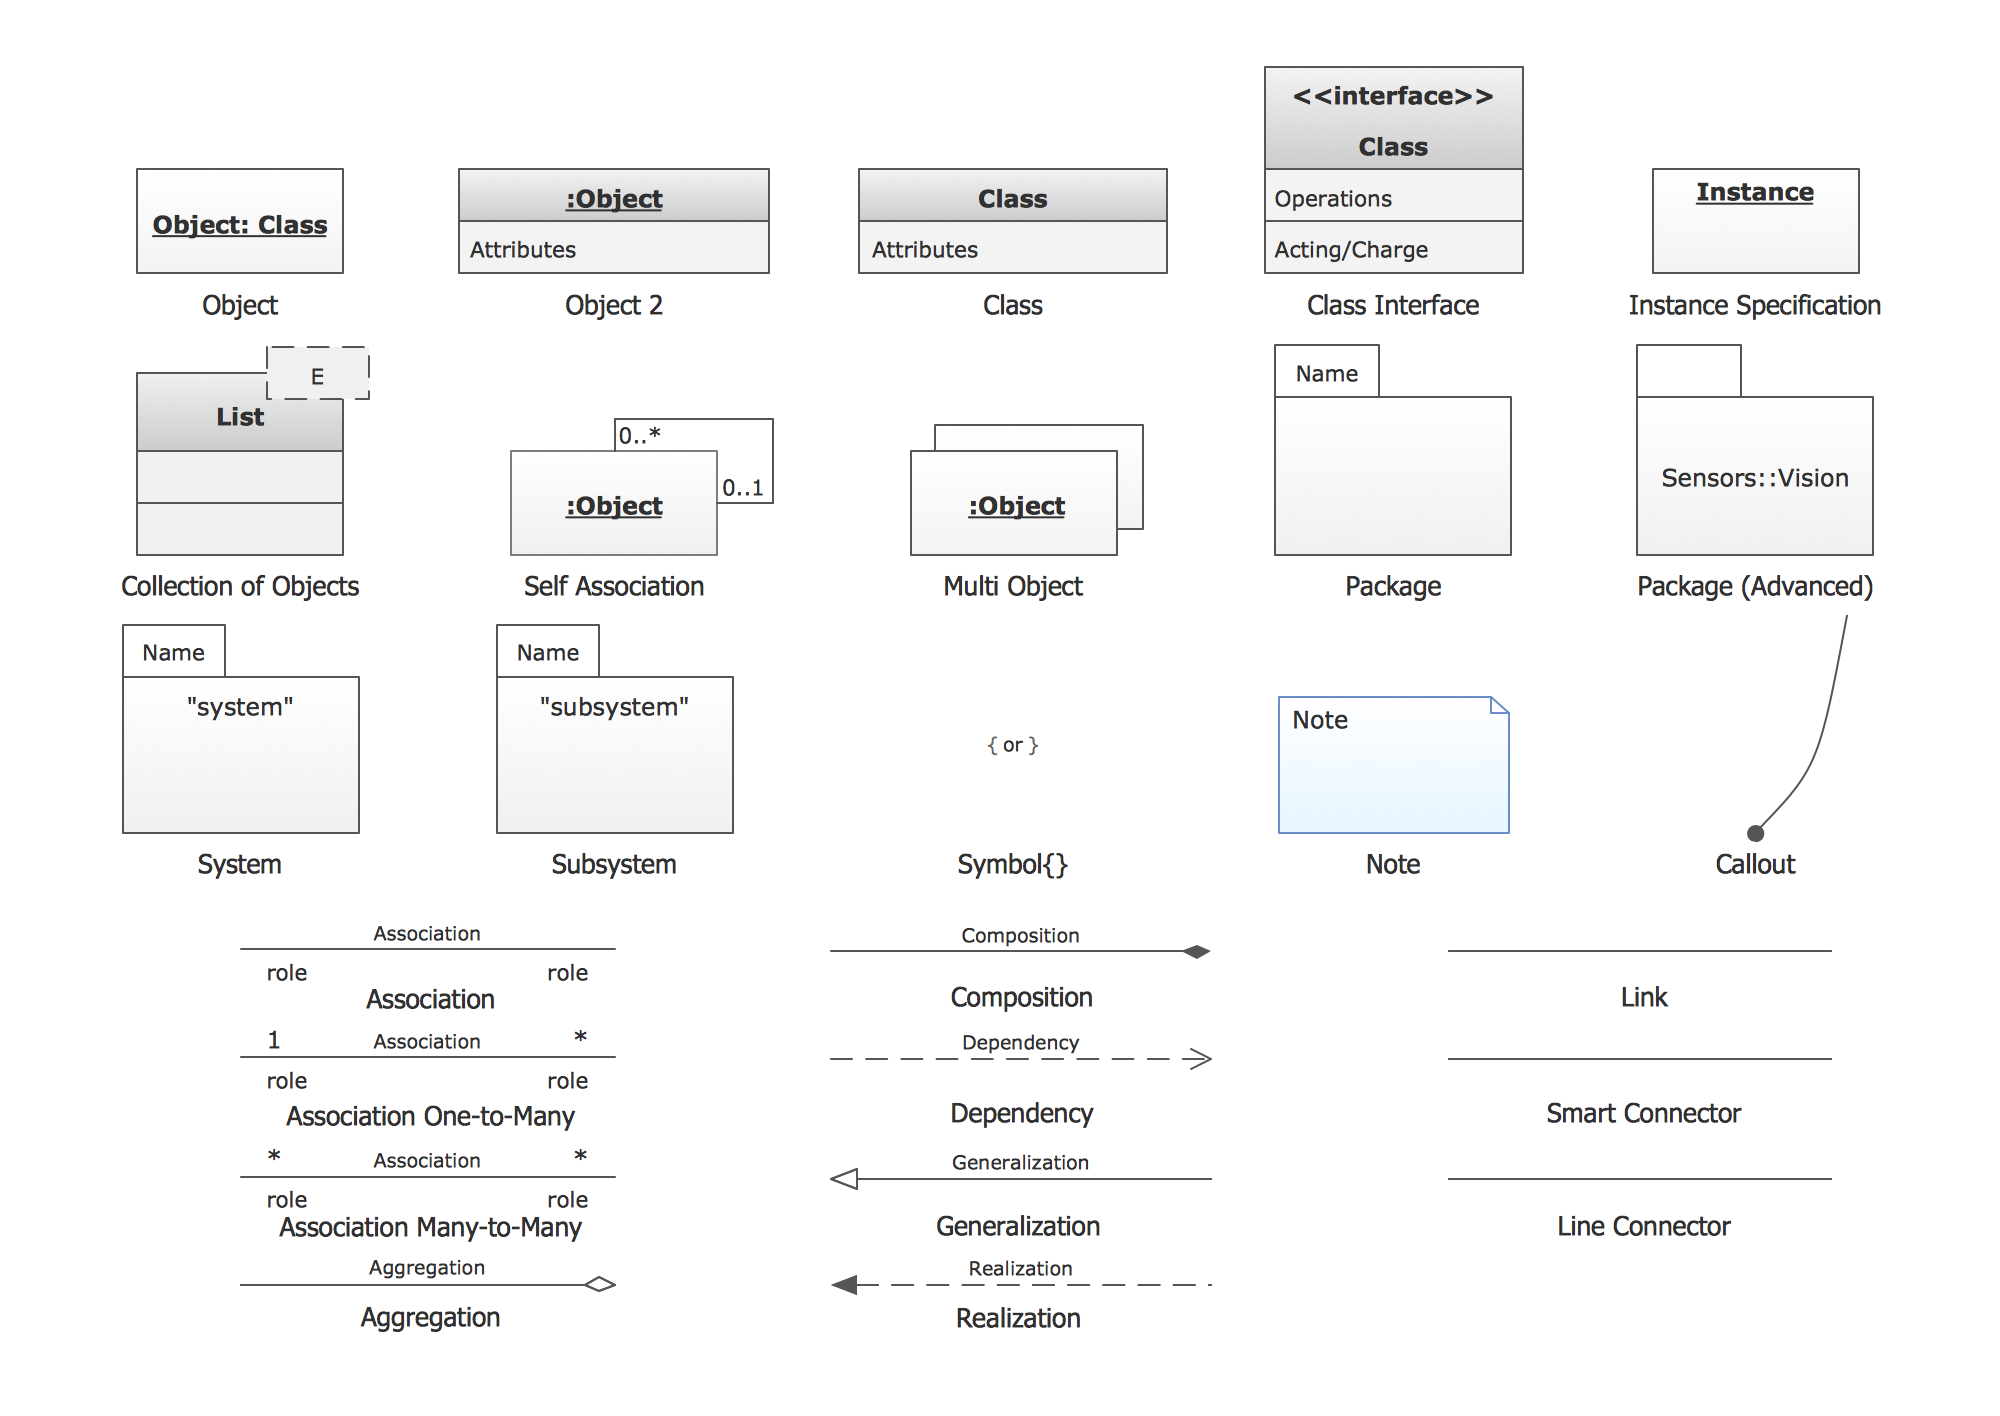
Example 1. UML Collaboration Diagram Symbols

Example 2. UML collaboration diagram. Online bookshop
This UML collaboration diagram sample is created using ConceptDraw DIAGRAM diagramming and vector drawing software enhanced with Rapid UML solution from ConceptDraw Solution Park.

Example 3.UML Diagrams solution
Rapid UML solution provides templates, examples and libraries of stencils for quick and easy drawing all the types of system and software engineering diagrams according to UML 2.4 and 1.2 notations.

Example 4. UML Collaboration Diagram Template


Example 5. UML Collaboration Diagram Samples (MAC OS X and Windows)
Use ConceptDraw DIAGRAM with UML communication and collaboration diagrams templates, samples and stencil libraries from Rapid UML solution to show the interactions between objects or parts of your system in terms of sequenced messages.